Elliott Wave View: Russell 2000 Aiming for All-Time HighShort term Elliott Wave view suggests rally from May 13, 2021 low is unfolding as a 5 waves impulse Elliott Wave structure. Up from May 13 low, wave ((i)) ended at 2245.1 and pullback in wave ((ii)) ended at 2152.35. The Index has started to rally again within wave ((iii)). Up from wave ((ii)) low, wave i ended at 2193.8 and dips in wave ii ended at 2170.20. Index then resumes higher in wave iii towards 2236.30 and pullback in wave iv ended at 2228.90. Final leg higher in wave v ended at 2250.2 which completes wave (i) in higher degree.
Pullback in wave (ii) ended at 2204.60. Index then extends higher in wave (iii) towards 2286.70 with internal subdivision of another 5 waves in lesser degree. Pullback in wave (iv) ended at 2256.50. Near term, expect a few more highs before the Index ends wave (v) and also wave ((iii)) in higher degree. From there, it should pullback in wave ((iv)) to correct cycle from May 19 low before the rally resumes. As far as May 19 pivot low at 2152.35 stays intact, expect dips to find support in 3, 7, or 11 swing for further upside.
RTY1! trade ideas

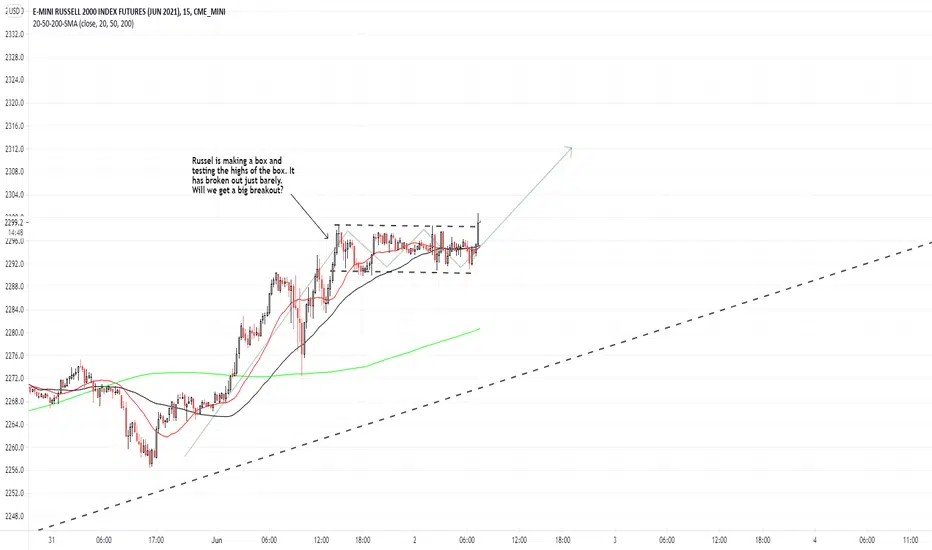
RTY breakout higher from box.Russell is breaking higher out of a box. A lot of people use this as an excuse to enter the market, on the idea that old resistance (once broken) becomes new support.
RTY Daily +400 Ticks Bullish PushThe RTY daily time frame is in an up channel. The
market hit the bottom of the channel and showing
signs of pushing bullish towards the top of the
channel price point 2327.0 which is also an up
sub Fibonacci extension about +411 Ticks above
the live market. It will be a good idea to turn to
the one hour time frame and to look for low prices
in the buy zone.

RTY1! (Russel) : 2 areas of potential bullish reactionPrice could dip into discount, mitigate some 4H zones and then go higher.
Wait for confirmations before going long. GLGT.

RTY rolled overRTY selling off because it hit my target (lol) and was overbought on both RSI and MFI.
ES and NQ are not overbought, looks like sector rotation back. So much rotation I'm getting dizzy.
Note: All foreign markets except China rallied last night, no short positions over the weekend. In fact, I'm all cash.
Keep in mind foreign markets trade on Monday. Gap direction for Tuesday is impossible to tell, but I'm bullish for now.

Russel 2K Bulls beware; proceed with cautionFurtures M2K just hit the 100% extension and slope resistance in the Asian session too... Watch out; May want to play the pull back

RTY UpdateOverbought so I'm not sure it;s gonna hit the target I drew up yesterday, but tomorrow is Ponzi Friday.
Maybe a rotation out of small caps and into tech tomorrow.


RTY, +1,000 Tick bullish pushRTY daily time frame is in an up channel. The market hit the bottom of the channel and is showing signs of pushing toward the top of the channel. The market is starting to make an up Fibonacci with an extension about a +1,000 ticks above the market price. Turning to the one hour time frame and looking for low prices in the buy zone will be a good idea as long as the market stays above the bottom of the daily up channel.


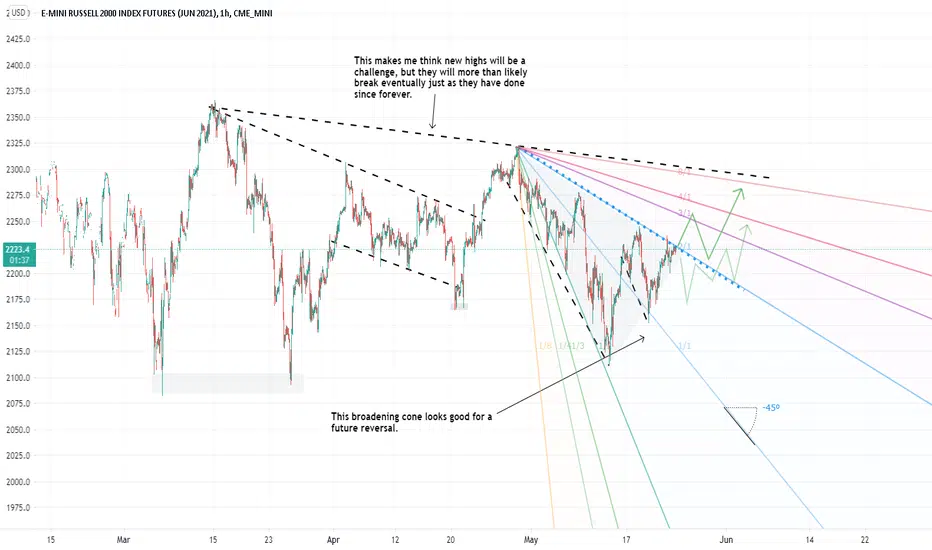
Broadening descending patterns on Russel. Makes me think Gann.It looks like it might have found the bottom already to me. The downward sloping upper trendline on the top looks like it could be trouble, but in the meantime I think it will trickle upward.
I have listed as 'neutral' because one of my two paths has Russel collecting at a lower level.
$IWM: Rejection of high, are they trying to dump it at 2240?Wondering if the $GDX is showing us something and could there be potential that these are getting riskier?

RT_Y 🩸 Killer entry on Bat Pattern Tp1 on deck, clean pattern on Heiki (candles) Learn how to find these daily, pls Dm me

RTY Trade Idea- LongThe Russell here is in a massive range on the 1 Day chart. On the 4hr, price looks much like the NQ. Our bias is long as we're at the bottom end of the range and we're seeing bullish momentum. Currently waiting for a pullback with a bullish engulfing/break of structure.


+2,000 Tick push on Russell 2000RTY One hour time frame is in a large up channel. The market hit the bottom of the channel and hit the daily down Fibonacci Extension. If the buyers are to take control. Now is a great time. Looking for the market to break and close in the buy zone off the one hour time frame will be a great idea to receive confirmation the buyers are taking control.

RTY Futures breakdownRussel 2000 futures Breakdown to 2100 ish?
Decent risk reward if yesterday's high isn't reclaimed.
I see temporary downward momentum at least to recent area of significant demand.


RTY: E-Mini RussellAt the close of last week, we saw a bounce in major indexes. After creating a downward channel, the price broke out on the Russell 60 min chart. We can now predict the next movement.
Targets:
2288
2315
Thank you and Good Luck!
🛑Disclaimer🛑
The content of this analysis is subject to change at any time without notice. Trading leveraged products carry a high level of risk and may result in you losing substantially more than your initial investment. This is not financial advice.

Russell 2000 is getting ready to make new high soonHere are support and resistance levels. Close above 2292 would confirm it's intention to move higher. Initial target is overhead resistance trend line and then 2500. Close below 2161 could indicate short term trend change.
