Gold Futures | H4 FVG Test as Asian Session OpensGold Futures completely filled the Daily FVG, so I’ve removed it and adjusted the chart to focus on the H4 FVG zone.
Price is now pressing deeper inside this imbalance, with 3350 as the key level to watch:
Hold above → potential accumulation and rotation higher.
Break below → sweep into 3348 liquidity and possibly lower.
Asian session may provide the first reaction, but I’ll be watching closely for London to confirm whether we hold or break this zone.
GCZ2029 trade ideas

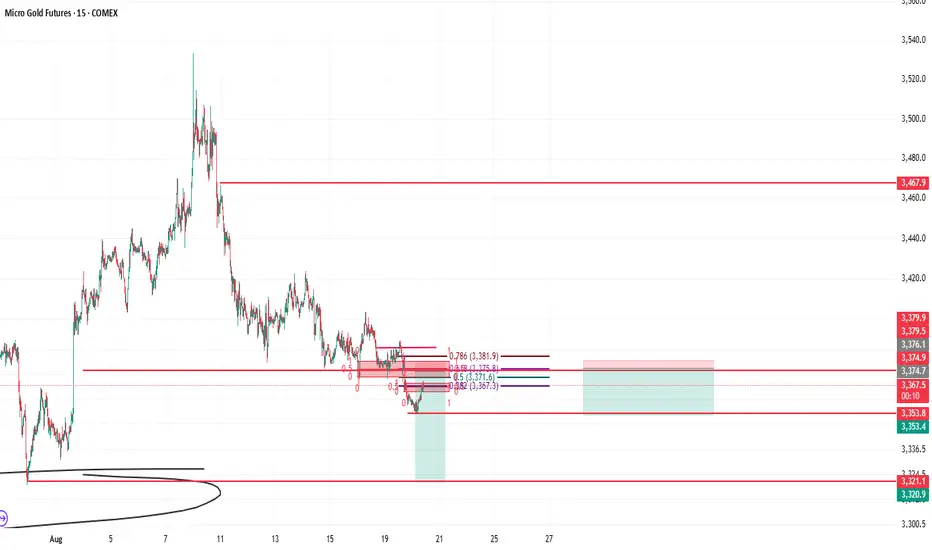
Shorting Gold again Here we go again.
Gold Should be shorted all the way until 3321 USD.
Its a very clear bearish trend TBH, so i think this should play out right.
To be safe though take the same entry and aim for 3353 usd.
BASICS: CREATE A ZONE #Gold #Zones📈 How to Create a Zone for Trading
This video will walk you step-by-step through creating a trading zone.
The purpose of the zone is to help identify the current market trend for a breakout.
✅ Remember: Consider trading the trend for the best setups and opportunities.
#TradingView #ForexTrading #DayTrading #TrendTrading #BreakoutStrategy #SmartMoney #TechnicalAnalysis #TradeTheTrend #PriceAction #MarketStructure #FuturesTrading #ForexCommunity

BASICS: Gold Entry, Doji & Flat ✨ Doji & Flat Strategy for Gold
This strategy will help you identify an entry point when trading gold.
The focus is on spotting Doji and flat patterns that signal potential market direction.
✅ Remember: Consider using this strategy to refine your entries and align with the trend.
#GoldTrading #ForexTrading #Doji #PriceAction #DayTrading #TradingView #GoldXAUUSD #TechnicalAnalysis #SmartMoney #MarketStructure #ForexCommunity #TradeTheTrend

Gold Futures | H4 FVG Fully Filled – What’s Next Into Weekly CloEarlier this week I was watching for price to pull back into the new H4 FVG after we closed above the Daily High. Price rejected from the Asian range mid and dropped cleanly into that zone, ultimately filling the H4 FVG completely.
Now on Friday, price sits right at the Weekly Low (3775.9) and the bottom of that H4 gap. This is a key decision point going into the weekly close.
📌 Scenarios I’m Watching:
✅ Bullish: If price holds this filled H4 FVG / W-L zone, we could see a re-accumulation and a push back toward 3388–3392 rejection block and possibly the Daily High (3394.6) next week.
❌ Bearish: If price fails to hold here, the next liquidity pools below are 3367.4 (D-L) and 3362.5.
📌 Key Levels:
Daily High: 3394.6
Weekly Low: 3775.9
Daily Low: 3367.4
Into Friday close, I’ll be watching whether we get acceptance above this zone (bullish continuation setup) or rejection that opens the door to new weekly lows.
👉 What do you think? Will this area hold as support, or do we see a deeper flush before the week closes?

Gold Technical Outlook Heading Into Powell's Jackson Hole SpeechIt is without a doubt that Jerome Powell's speech at the Jackson Hole symposium is THE event of the week, and possibly the biggest of the month and quarter. That brings the potential for safe-haven flows into gold as we veer towards this key event. I take a look at gold futures market exposure and key levels for gold futures.
Matt Simpson, Market Analyst and City Index and Forex.com

Gold Futures | Accumulation in Play – Watching for Manipulation Gold Futures are currently sitting in the Accumulation phase of an AMD sequence. Price is ranging just above the Daily/H4 FVG demand zone (3350–3360) after rejecting supply at 3387–3394.
Here’s what I’m watching:
Accumulation: Current consolidation between 3368–3387.
Manipulation: A clean sweep of yesterday’s low (3368) would complete this phase.
Distribution: If manipulation plays out, I’ll look for price to rotate higher, targeting 3387 → 3404 and potentially higher levels.
⚖️ Bias: Waiting for liquidity run before positioning long.
No need to rush — the sweep is the confirmation. Until then, patient observation.

GC 4h Chart for today With Jackson Hole upon us, we're going to get some explosive moves. I have mapped out my thoughts on the 4H chart. Good luck, be careful out there

GC Futures – Will Bulls Defend the Daily/H4 FVG Overlap?Gold Futures opened the week pressing directly into a stacked Daily + H4 FVG demand zone (3350–3360). Price action is sitting just above this level, making it the key battleground for the week.
Support: 3350 (FVG low), 3332 liquidity sweep
Resistance: 3377 → 3394 (prior D-H), 3451 (M-H)
Scenarios: Bounce off demand could target 3380–3394, with a reclaim opening 3420–3450. Failure here points to deeper liquidity at 3332.
Asian session may set the early range, but real direction likely comes during London/NY killzones. Watching closely for reaction inside the FVG overlap.

GC : Short levelHere is a great entry point for those who scalp this instrument or pips. The level is marked with a red arrow. It will be active until I report. It may become inactive over time.
Gold Futures | Watching Pullback into New H4 FVG for ContinuatioPrice pushed bullish after filling ~50% of the prior H4 Fair Value Gap and has now created a new H4 FVG just below. We also closed the day above yesterday’s high (3,394.1), showing strength.
📌 My Bias:
I’m looking for a pullback into the new H4 FVG (around 3,377–3,382) for potential continuation higher. This zone also lines up with the edge of value on the volume profile.
📌 Key Levels:
Daily High (D-H): 3,394.1
Weekly Low (W-L): 3,375.9
Daily Low (D-L): 3,353.3
📌 What I’m Watching:
✅ Acceptance above D-H = bullish continuation.
⚠️ Rejection back below D-H could signal a trap and return into prior value.
Will look for lower timeframe confirmation at the H4 FVG edge before considering longs.
Question for the community:
Do you see continuation higher from here, or are we at risk of a failed breakout?

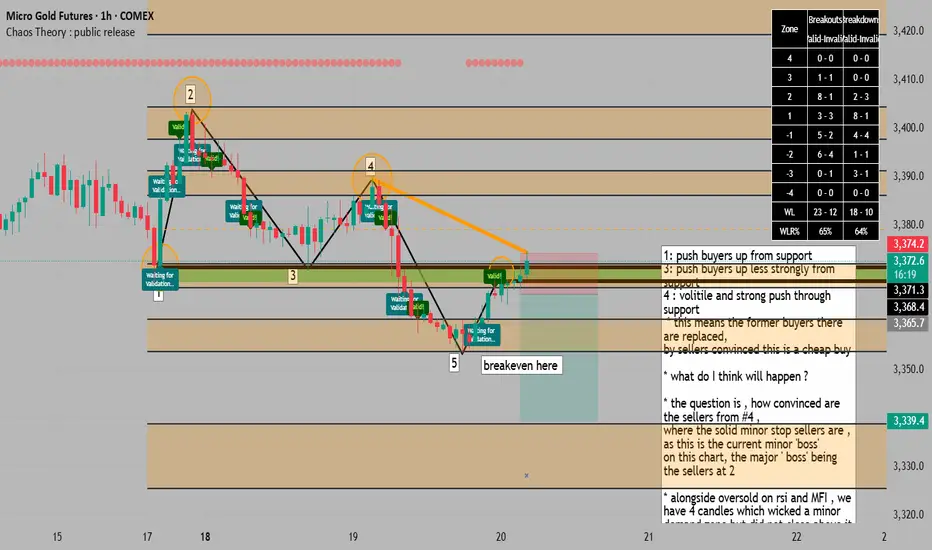
we are potentially at a support turned resistance for a = SELL1: push buyers up from support
3: push buyers up less strongly from support
4 : volitile and strong push through support
* this means the former buyers there are replaced,
by sellers convinced this is a cheap buy
* what do I think will happen ?
* the question is , how convinced are the sellers from #4 ,
where the solid minor stop sellers are , as this is the current minor 'boss'
on this chart, the major ' boss' being the sellers at 2
* alongside oversold on rsi and MFI , we have 4 candles which wicked a minor demand zone but did not close above it
* we also have hidden divergence on the MFI and RSI adding to a sell confluence.
* in my opinion its enough to get us to a 1:1, maybe breakeven and go for a larger target
* according to chaos theory indicator zones,
over the past 2,500 candles, when price closes below a zone, it has a 66% chance of reaching the next zone below, a low below the current candle then prsents a good entry, with a target at the zone below and a good breakeven point when price enters the second travel zone below ( 66% chance we will travel from a orange zone to the next )
* another interesting detail is that when we add horizontal resistance lines from the peak of the rsi and mfi, it co-incides with price peaks, and predicts the next downturn to be here as well.
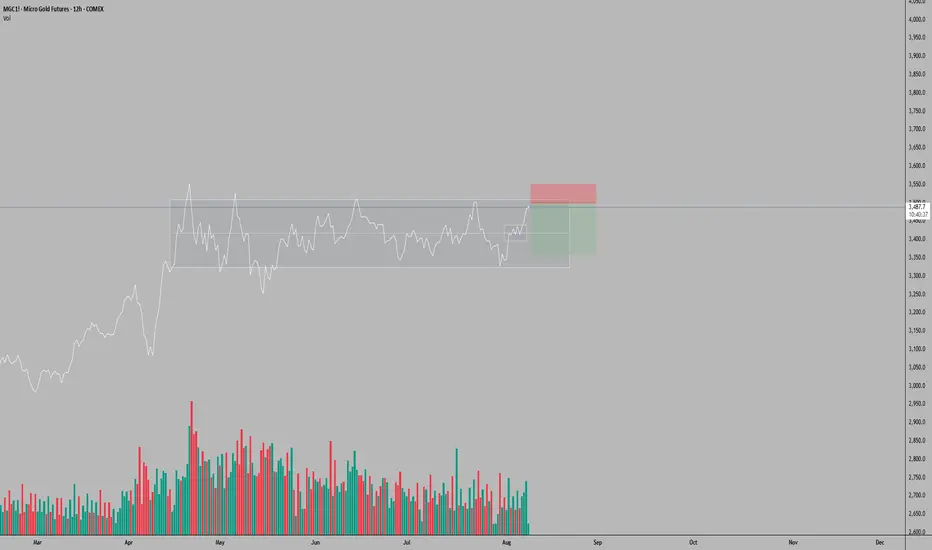
MGC (Micro Gold Futures) Trade Setup – 12H TimeframeOn the 12-hour timeframe, MGC has returned to the upper boundary of the horizontal range established since April 14, 2025. A surge in positive volume on August 7 was preceded by a sharp uptick beginning August 6, followed today by noticeably shallower volume—suggesting volume exhaustion and a potential pause or retracement.
Given today is Friday, profit-taking pressure may materialize following the rapid ascent that began with the breakout above the intermediate 3,400–3,440 zone on August 6. With no major macroeconomic events scheduled that could fuel further upside momentum, a pullback becomes a plausible scenario.
Illustrative Setup: A Sell Limit entry is considered around the 3,500 mark, with a Stop Loss at 3,550—matching the April 25 all-time high—and a Take Profit at 3,360, which aligns with intermediate support within the larger range. This setup offers a risk-reward ratio of approximately 2.8:1, assuming price reacts to overhead resistance and reverts toward the range’s mid-zone.
This analysis is provided solely for educational and entertainment purposes and does not constitute any form of financial or investment advice. Always manage your risk and trade responsibly.
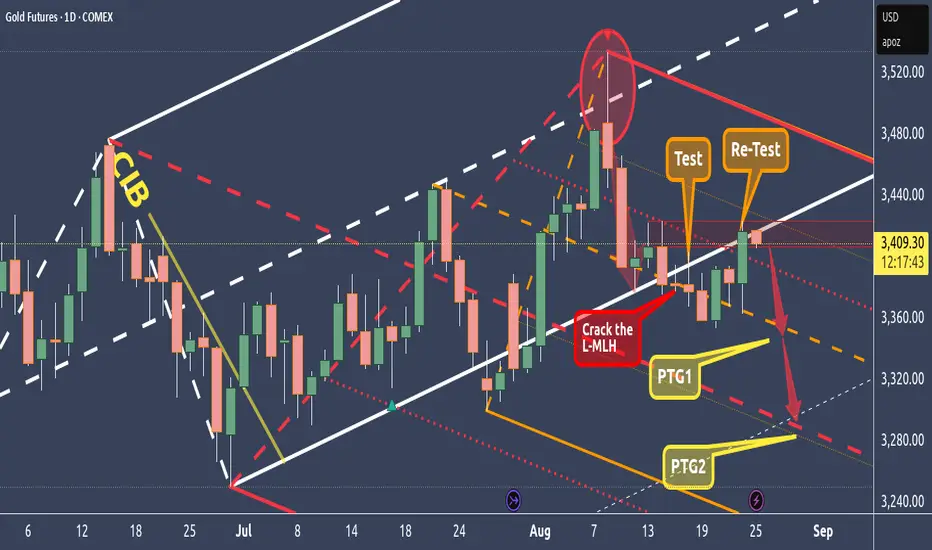
GC - Gold Re-Testing The L-MLH - Short AheadFirst we crack the L-MLH.
Then we got a test and now the re-test.
On a close outside the fork it's a present to short wit stops above somewhere the wicks high.
Profit at the orange Centerline (PTG1) and at the Red Centerline. All in all a wonderful trade with a decent risk/reward.
And if the train leaves without us, NO FOMO please §8-)
Who Has Bought the Most GoldSince the inflation hit a high at 9% in 2022, China, Turkey and Poland have been the top 3 buyers of Gold, including in the first two quarters of this year.
It’s not just these countries; many other central banks have been stockpiling gold since (iii) July 2022. Then gold prices were at around US$1,800.
Are central banks still buying as much gold today?
Micro Gold Futures and Options
Ticker: MGC
Minimum fluctuation:
0.10 per troy ounce = $1.00
Disclaimer:
• What presented here is not a recommendation, please consult your licensed broker.
• Our mission is to create lateral thinking skills for every investor and trader, knowing when to take a calculated risk with market uncertainty and a bolder risk when opportunity arises.
CME Real-time Market Data help identify trading set-ups in real-time and express my market views. If you have futures in your trading portfolio, you can check out on CME Group data plans available that suit your trading needs www.tradingview.com

A-Book vs B-Book: What Every Retail Trader Needs to Know█ A-Book vs B-Book: What Every Retail Trader Needs to Know
Most retail CFD traders have never even heard the terms “A-Book” and “B-Book,” yet almost all of them are directly affected by how these models work. Your broker’s choice between the two can change the prices you see, how your orders are filled, and even whether your stop loss gets hit. Let’s break it down so you know exactly what’s going on behind the scenes.
█ What is A-Book?
An A-Book broker routes your orders straight to external liquidity providers, such as banks, market makers, or directly to an exchange in the case of futures or spot markets. Your broker is essentially the middleman, passing your trade along and matching it with a real counterparty.
⚪ How they make money:
Spreads (the difference between the bid and ask prices).
Commissions on each trade.
Occasionally a small markup on the feed.
Because they don’t profit when you lose, an A-Book broker’s ideal client is a trader who trades frequently and consistently, your activity is their revenue stream.
█ What is B-Book?
A B-Book broker keeps your trades “in-house,” meaning they take the other side of your position. If you buy, they sell; if you sell, they buy, but all within their own system. Your trades don’t reach the real market at all.
⚪ How they make money:
Your losses are their profits.
They may still earn on spreads and commissions, but the main income is the net loss of their client base.
Because the broker profits from losing clients, there’s an inherent conflict of interest. It’s not that every B-Book broker is out to get you, but the incentive structure is very different from A-Book.
█ Hybrid Models – The Modern Reality
Today, many CFD brokers use a hybrid model. This means small accounts or “unprofitable” clients might be B-Booked, while larger or riskier trades are hedged via A-Book routing. This approach balances their risk and maximizes profits.
█ The Stop Loss Mystery – Why It Sometimes Gets Hit When It “Shouldn’t”
A common complaint among retail traders is this:
“My stop loss was triggered on my CFD broker’s chart, but the real market price never touched it.”
⚪ Here’s why this happens:
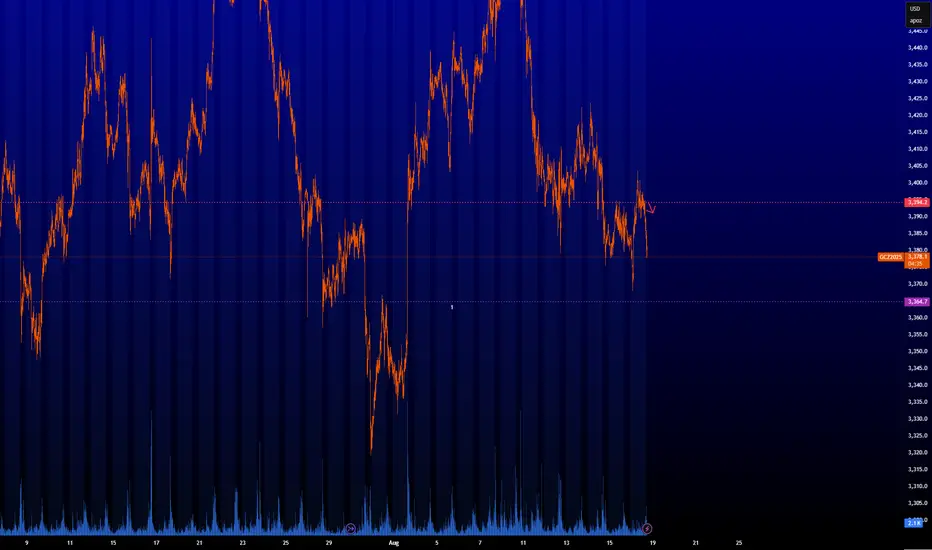
B-Book influence: If your trade is kept in-house, the price you see is the broker’s internal feed, not the pure exchange price. Minor spikes or wicks can appear that don’t exist on the actual CME or underlying market.
Different price feeds: Even A-Book brokers often aggregate liquidity from multiple sources, leading to small discrepancies from the official exchange price.
Overnight sessions: Many CFD brokers price products nearly 24 hours a day, even when the underlying market is closed. This “synthetic” pricing can produce moves that never happened in the actual market.
The result? You might see your stop hit during quiet, low-volume hours when the real market was nowhere near that level.
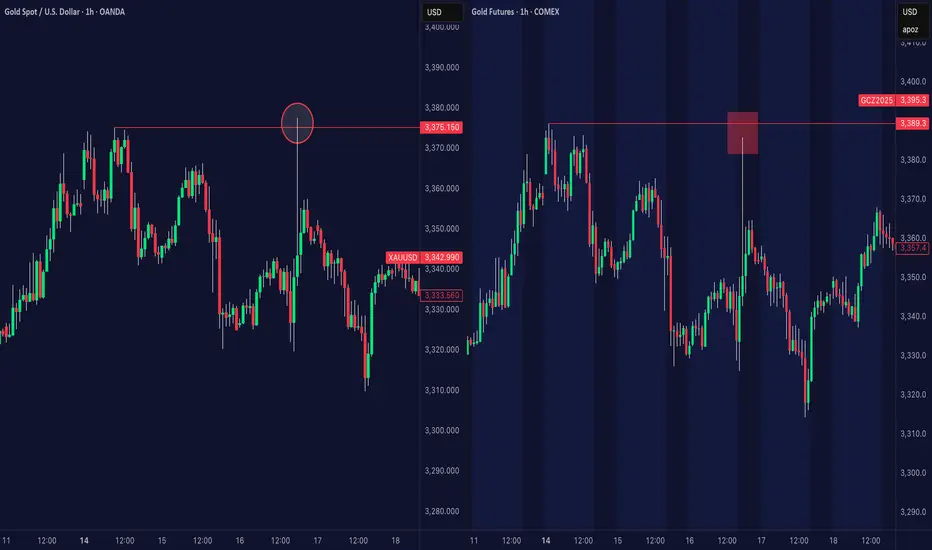
Side-by-side comparison showing a large wick on a CFD gold chart (left) that never occurred on the actual CME gold futures market (right). This kind of discrepancy can trigger stop losses on CFD platforms, even though the real market price never reached that level — a classic example of the Stop Loss Mystery.
█ Stop Hunting – When the Market Seems Out to Get You
Closely related to the stop-loss mystery is stop hunting, when price spikes just far enough to trigger a cluster of stops before reversing sharply.
In a pure B-Book setup, your broker isn’t just your counterparty, they can also see exactly where all their clients’ stops are placed. If they control the price feed, even the smallest manufactured move in their internal system can sweep through those levels. This can happen intentionally to lock in profits from client losses, or simply as a by-product of how their system reacts during thin liquidity.
From your perspective, it feels like the market was “out to get you,” touching your stop and then running in your direction. But often, that move never existed in the real underlying market at all, it was born inside the broker’s own pricing environment. And while low-volume hours are prime time for this, it can still happen in the middle of the busiest trading sessions.
Comparison of gold CFD pricing (left) and CME gold futures (right). The CFD chart shows a wick that sweeps above previous highs, potentially triggering stop losses, while the real futures market shows no such move, a classic example of suspected stop hunting on CFD feeds.
█ Why This Matters for Retail Traders
Understanding whether your broker uses A-Book, B-Book, or hybrid execution changes how you view price discrepancies, stop-loss triggers, and even your broker’s incentives.
A-Book: Broker earns from your trading volume, not your losses.
B-Book: Broker earns directly from your losses.
Hybrid: They can switch between models depending on the trade and client profile.
Knowing this doesn’t just help you choose a broker, it helps you understand the “market” you’re actually trading in.
-----------------
Disclaimer
The content provided in my scripts, indicators, ideas, algorithms, and systems is for educational and informational purposes only. It does not constitute financial advice, investment recommendations, or a solicitation to buy or sell any financial instruments. I will not accept liability for any loss or damage, including without limitation any loss of profit, which may arise directly or indirectly from the use of or reliance on such information.
All investments involve risk, and the past performance of a security, industry, sector, market, financial product, trading strategy, backtest, or individual's trading does not guarantee future results or returns. Investors are fully responsible for any investment decisions they make. Such decisions should be based solely on an evaluation of their financial circumstances, investment objectives, risk tolerance, and liquidity needs.
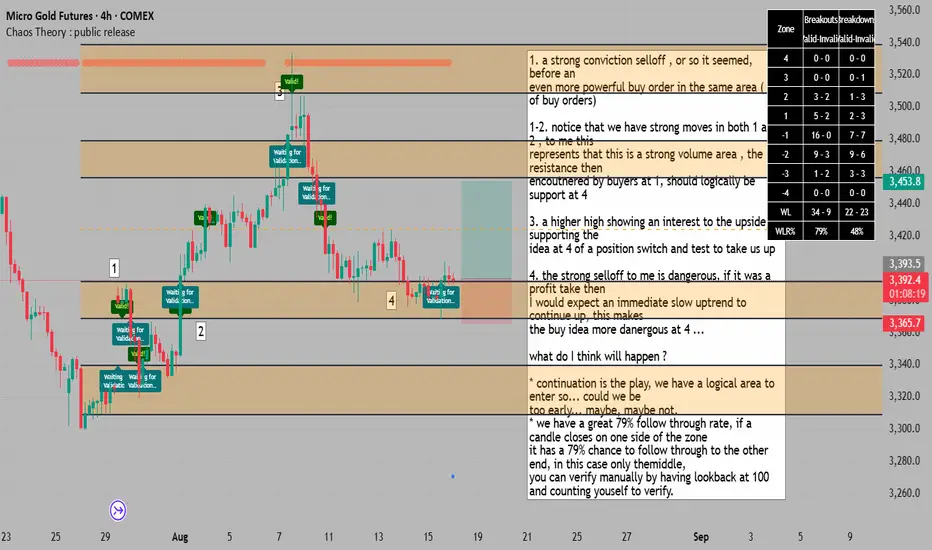
an uptrend returns to an area of strong action , continuation?1. a strong conviction selloff , or so it seemed, before an
even more powerful buy order in the same area ( set of buy orders)
1-2. notice that we have strong moves in both 1 and 2 , to me this
represents that this is a strong volume area , the resistance then
encoutnered by buyers at 1, should logically be support at 4
3. a higher high showing an interest to the upside, supporting the
idea at 4 of a position switch and test to take us up
4. the strong selloff to me is dangerous, if it was a profit take then
I would expect an immediate slow uptrend to continue up, this makes
the buy idea more danergous at 4 ...
what do I think will happen ?
* continuation is the play, we have a logical area to enter so... could we be
too early... maybe, maybe not.
* we have a great 79% follow through rate, if a candle closes on one side of the zone
it has a 79% chance to follow through to the other end, in this case only themiddle,
you can verify manually by having lookback at 100 and counting youself to verify.
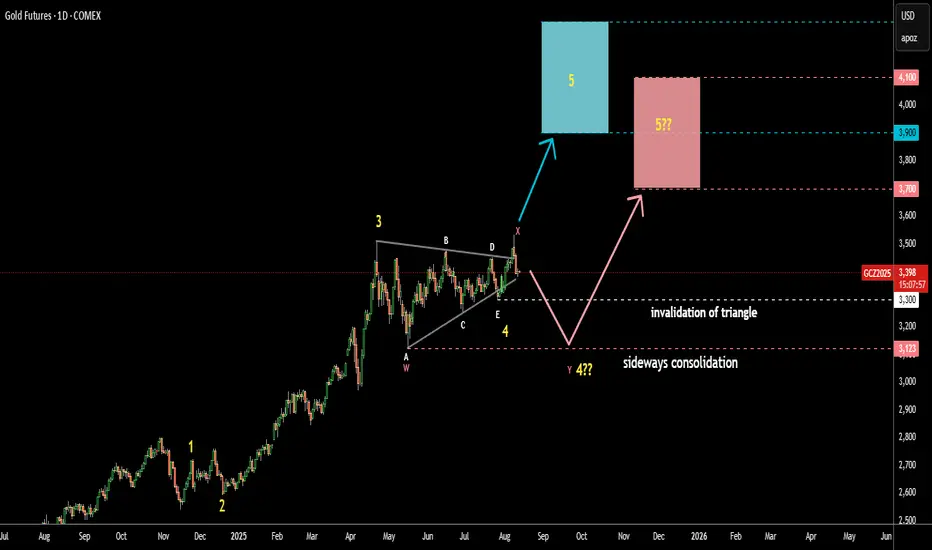
Gold Update 13AUG2025: Risk of Sideways Consolidation Last Friday, August 8, the price failed to progress above the April top as it closed underneath. Hence, there are two possible scenarios from here:
The price could have just completed the first wave up in a larger wave 5, and we may see a retracement. This setup remains valid as long as the price stays above the last wave E of the Triangle at $3,300.
The large sideways consolidation (WXY) might take shape, potentially retesting the bottom of wave A at $3,123. In this case, the target could drop lower, with potential support in the pink box area between $3,700 and $4,100.
Which one do you think plays out?
Gold Futures – Bearish Target Hit… But the H4 Gap Still WaitsYesterday’s sessions made their move for the higher bearish target, leaving the H4 & Daily FVG untouched below. This sets up an interesting scenario: will price roll over to fill the gap next, or keep hunting liquidity above?
Key levels and volume profile zones are adjusted for today.
Premium supply zone reached ✅
H4/Daily FVG still in play 📉
Watching London Killzone for impulsive confirmation
Patience is the edge — no clean setup, no trade.

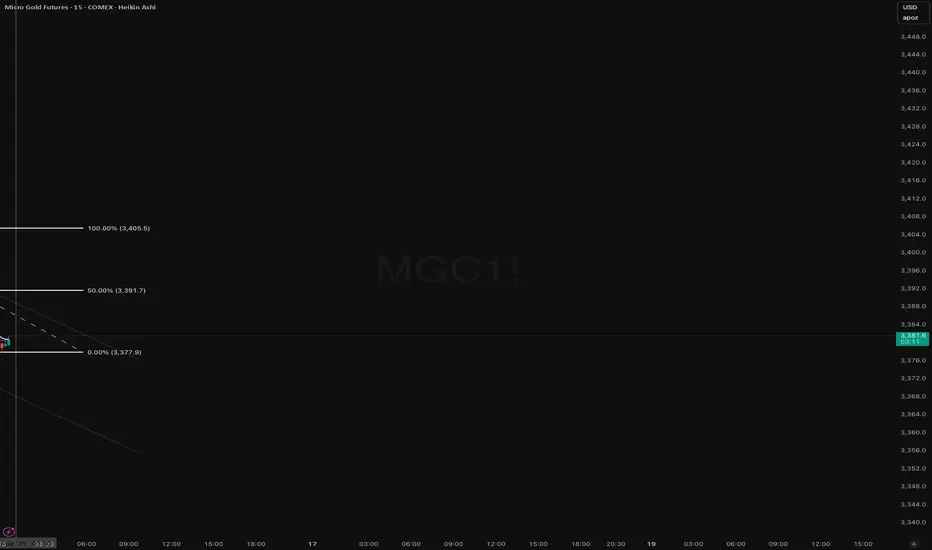
Will Gold Rip or Slip from Here?Heading into the Tokyo session, MGC sits in a critical decision zone. Price action on the 5-minute shows a clear double bottom structure forming near $3,778 a level that has already acted as a demand shelf twice today. From a quant perspective, we have a short-term oversold condition colliding with intraday support, which typically presents a mean-reversion probability spike in low-liquidity Asian hours.
Bullish scenario (42% probability):
- Confirmation trigger is a break and hold above $3,787 (micro neckline).
- Immediate resistance comes in at $3,790–$3,794 (local VWAP + micro EMA confluence).
- If liquidity builds, stretch target aligns with the 50% fib retrace of the last swing at $3,391.7 (highly dependent on overnight momentum continuation).
- Risk: Tight stop just below $3,776 to avoid chop whipsaws.
Bearish scenario (58% probability):
- Failure to reclaim $3,787 opens the door for liquidity sweep below $3,778.
- Initial target $3,770, with potential extension toward $3,765 if Asia volume remains one-sided.
- Downside bias is supported by the broader 1H downtrend, VWAP resistance slope, and previous session imbalance still unfilled.
Factors in play:
- VWAP slope: Bearish.
- EMA separation: Expanding to the downside, signalling trend continuation potential.
- Volume profile: Thin liquidity below $3,778 increases probability of a stop-hunt flush before any reversal.
Tokyo session game plan:
Wait for breakout confirmation either a micro double bottom neckline break for the long scalp, or a rejection for the short continuation. Execution discipline is key; Tokyo often gives one clean directional push before stalling into consolidation.
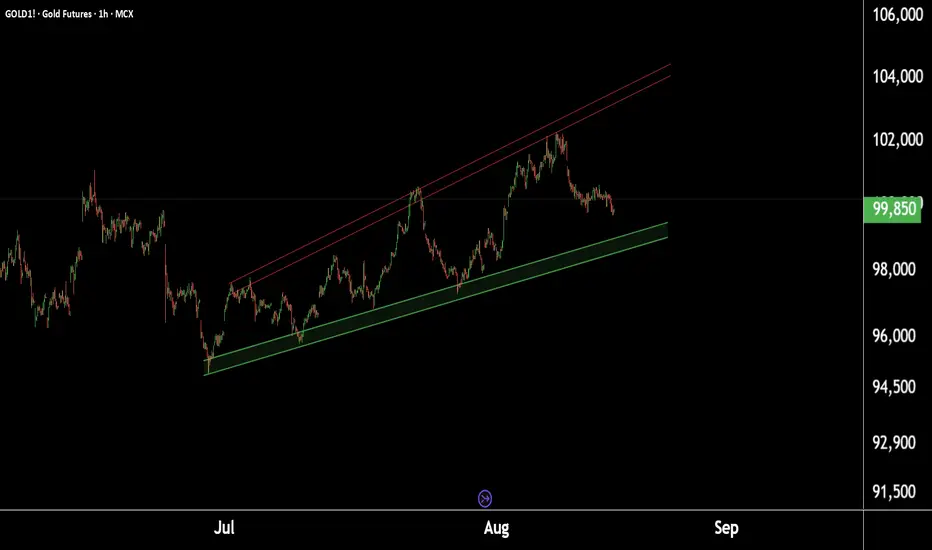
Gold at Crucial Levels – Buy or Sell? Watch These Key Price ZoneDaily Gold Update:
This is the daily timeframe chart of Gold1!.
Gold1! is forming an ascending broadening wedge pattern with support in the ₹98,500–₹98,800 range.
If this support holds, we may see higher prices.
However, if it breaks, Gold1! could decline towards its pattern target near ₹95,000.
Thank You !!
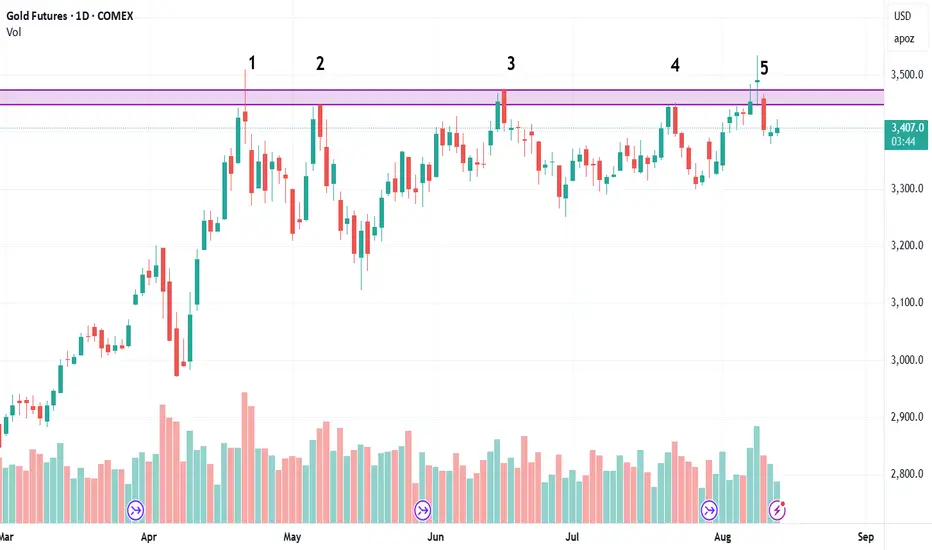
6th time is the charm for Gold ? COMEX:GC1! has been tried pushing through that ceiling near $3500, five separate times.
Soon it may try the 6th time. If it does push through convincingly, the upward move might be violent.
It is like having two cup and handles back to back. Can't wait to play it long when it happens. Will play TVC:SILVER as well.
Do you agree?
Gold Futures – Waiting for the Flush Before the Long (Asian KillMarket Context:
Gold is sitting right inside a confluence zone — overlapping Daily + H4 Fair Value Gaps at 3,375–3,380. This zone also aligns with the lower boundary of last week’s range (W-L at 3,397).
What I’m Watching:
Going into the Asian Killzone, I’m looking for an impulsive spike down into this FVG.
This move would ideally push below 3,375, tag liquidity, and create DOM excess — the kind of aggressive selling that often marks exhaustion before reversal.
ADX is above 25 and rising, signaling momentum is strong — but we’re at a potential pivot level.
Bullish Setup Criteria:
Flush down into 3,375 or slightly below.
DOM excess showing absorption (stuck sellers).
Strong rejection candle (M1/M5) followed by bullish follow-through.
Targets if Triggered:
T1: 3,397 (Weekly Low)
T2: 3,423 (Daily High)
Stretch: 3,451 (Monthly High)
Invalidation:
1H close below 3,375 without immediate reclaim.
Summary:
Patience is key. I want to see sellers press in during Asia, fail to break down with continuation, and then get run over on a squeeze higher. If we get the right reaction, this could be the start of a strong move into Weekend.
