GC | Wk 51T.A explained -
BackSide (BS)
FrontSide (FS)
Inverse BS (Inv.BS)
Inverse FS (Inv.FS)
BS & FS levels are expected support when dashed lines, tested when dotted and resistance when solid lines.
The inverse is true for the Inv. BS Inv. FS levels, they are resistance as dashed lines, tested as dotted and support as solid lines.
Monthly timeframe is color pink
weekly grey
daily is red
4hr is orange
1hr is yellow
15min is blue
5min is green if they are shown.
strength favors the higher timeframe.
2x dotted levels are origin levels where trends have or will originate. When trends break, price will target the origin of the trend. its math, when the trend breaks, the vertex breaks too so the higher timeframe level/trend that breaks, the more volatility there could be as strength in the orders flow in to fuel the move.
Gold Futures
No trades
Market insights

Gold Context: Strong Short Covering & The New Money TestFOREXCOM:XAUUSD COMEX_MINI:MGCG2026 COMEX:GC1!
Analysis
1. Market Context (Early US Session)
We are witnessing strong Short Covering in the early US session, continuing the momentum from yesterday where Gold traded above the previous multi-day range.
• The Driver: The vertical nature of the move confirms the exit of old shorts. However, for this to sustain, we must see this emotional energy transition into New Money Buying (Initiative) .
• Observation: If price can hold these higher levels without immediate rejection, it confirms that "New Money" is entering to defend the breakout.
2. Structure & Targets
• Bias: I remain on the Long side at this moment. The breakout above the recent balance suggests the path of least resistance is toward the higher area (ATH).
• Condition: We need to see acceptance, not just a "look and fail." Continued short covering will naturally pull the auction higher.
3. The Risk (Liquidation)
• Support Check: If the buying dries up and we see Long Liquidation , the auction will likely rotate back to test the 4300 support area. This would be a test of the breakout's validity.
Plan & Execution
• Focus: Monitoring for volume and time acceptance at these highs.
• Invalidation: Loss of momentum returning to 4300.
Talk to you for the next update. b]Analysis
1. Market Context (Early US Session)
We are witnessing strong Short Covering in the early US session, continuing the momentum from yesterday where Gold traded above the previous multi-day range.
• The Driver: The vertical nature of the move confirms the exit of old shorts. However, for this to sustain, we must see this emotional energy transition into New Money Buying (Initiative) .
• Observation: If price can hold these higher levels without immediate rejection, it confirms that "New Money" is entering to defend the breakout.
2. Structure & Targets
• Bias: I remain on the Long side at this moment. The breakout above the recent balance suggests the path of least resistance is toward the higher area (ATH).
• Condition: We need to see acceptance, not just a "look and fail." Continued short covering will naturally pull the auction higher.
3. The Risk (Liquidation)
• Support Check: If the buying dries up and we see Long Liquidation , the auction will likely rotate back to test the 4300 support area. This would be a test of the breakout's validity.
Plan & Execution
• Focus: Monitoring for volume and time acceptance at these highs.
• Invalidation: Loss of momentum returning to 4300.
Talk to you for the next update.

GC Short Trade IdeaGot levels of resistance here. If we get through the resistance we have a strong high above for a possible short there also.

Based on recent Elliott Wave analyses, the undertone for MCX GolBullish Outlook: The primary trend for gold on MCX is considered positive (bullish) from an Elliott Wave perspective.
Wave Structure: Gold has consolidated in a corrective wave 4 and is likely unfolding in wave 5 of a larger primary wave 5.
Support & Resistance: Key support is identified around ₹120,000, while a break above ₹124,600 is considered a positive reversal signal.

Gold Short Term Move (Less Than 12hr for TP/SL)Marking out .68 &.79 levels on 5min,15min,1hr charts. Once price respects zone we enter. Confirmations for respected zone are 5min fvg and ifvg respected, also closing and retesting of the zone.
Take Profit 1- Equilibrium of the move that goes down into the 15min GZ
Take Profit 2- Fibinocci extension .50
Take Profit 3- Any other Golden zone it can be going.
Take Profit 1** I take %99 of the time Take Profit 2** with strong momentum and volume i say i take %75 of the time and Take Profit 3** is a 50/50 split because it usually consolidates or retraces and could wick a stop loss.

Gold Context: Breakout from 4-Day Balance & Holiday ThinnessFOREXCOM:XAUUSD COMEX_MINI:MGCG2026 COMEX:GC1!
b]Analysis
1. Market Context (The Breakout)
We have observed Short Covering extending above the recent 4-day balance.
• Structure: Yesterday's push brought us nearly to the All-Time High (ATH). Today being Friday, the auction is positioned to test that extreme.
• The Driver: To sustain this breakout and reach the ATH, the initial short covering must transition into New Money buying (Initiative). Without this transition, the move risks being just an emotional inventory adjustment.
2. Scenario & Structure (The Tail)
• Bull Case: If short covering continues and attracts new buying interest, the ATH is the natural magnet.
• Bear Case (The Tail): Yesterday left a selling tail at the highs. If we see Liquidation (failure to hold gains), it confirms that the tail was a valid rejection by Higher Timeframe (OTF) Sellers defending the highs.
3. Holiday Caution (Thin Market)
We are approaching the Christmas and New Year holiday window.
• Risk: Trading volume is thinning out. Low volume markets can be erratic and lack structural integrity. Be careful of "false" moves driven by lack of liquidity rather than genuine value migration.
Plan & Execution
• Bias: Leaning toward the ATH test, but cautious of the "Tail" overhead.
• Invalidation: A drop back into the 4-day balance would negate the breakout and suggest the higher prices were rejected.
Talk to you for the next update.

Gold strong bullish momentumHere we can see my channel projection lines and how the bullish momentum just keep on getting stronger and stronger. Now here is the question. Will the bulls pick up more momentum pushing the price even higher to the projected channel line?
Love to hear your opinion, leave a reply.
#Gold

GOLDM (GOLD Mini Futures) - ABC correction done?I do mark my counts and analysis mostly on XAUUSD, because that is the tradable instrument and being used across the world.
Just for a change, I tried to plot my counts on INR GOLD Mini Futures today.
CMP: 133250
TF: 1 hour
As you can see, the corrective rise in ABC format seem to have ended at 133500 odd levels today.
The internals are marked for easy understanding.
Invalidation for this view lies at hourly close above 137500
Disclaimer: I am not a SEBI registered Analyst and this is not a trading advise. Views are personal and for educational purpose only. Please consult your Financial Advisor for any investment decisions. Please consider my views only to get a different perspective (FOR or AGAINST your views). Please don't trade FNO based on my views. If you like my analysis and learnt something from it, please give a BOOST. Feel free to express your thoughts and questions in the comments section.

Gold Context: The "Picket Fence" Highs & USD WeightCOMEX:GC1! COMEX_MINI:MGCG2026 FOREXCOM:XAUUSD
Analysis
1. Market Context (Lack of Acceptance) We are observing a classic "Picket Fence" at the highs. Gold has probed last Friday's high nearly every day, yet we see no acceptance (time + volume) above it.
The Structure: Repeatedly testing a level without breaking through often indicates that Short-Term Traders are dominating the auction. They are fading the extremes but lack the "New Money" power to expand the range.
The Risk: In Market Profile, "failure to facilitate trade" in one direction usually leads to a rotation in the opposite direction. If we cannot discover value higher, the auction will seek liquidity lower.
2. Fundamental Weight (USD Resilience) The upside is being capped by a resilient US Dollar (DXY).
The Driver: The divergence between a "Wait-and-See" Fed (Hawkish Cut) and a weak Europe is keeping a structural bid under the Dollar.
Correlation: As long as DXY holds its liquidation lows and yields remain firm, Gold lacks the macro fuel to break this mechanical resistance.
3. Scenario (Inventory Adjustment) The repeated failure at the highs increases the probability of Long Liquidation .
Target: A rotation back to the 4300 breakout level.
Rationale: This is not necessarily a trend change, but an inventory adjustment to flush out the "laggards" who bought the highs expecting an immediate breakout.
Plan & Execution
Bias: Cautious/Neutral.
Trigger: Watch for a "look above and fail" or a breakdown of the intraday lows to trigger the move to 4300.
Talk to you for the next update.

Gold Futures (GC) Technical Analysis at Key ResistanceGold futures are approaching a major higher-timeframe resistance between 4,414.4 and 4,399.4. This analysis focuses on price behaviour, volume reaction, and institutional participation rather than prediction. No trade is taken until price reaches the zone and confirms intent through volume and structure.

Approaching important fractal Hitting a very important fractal on gold, will we break though or mean revert?

GOLD 17.12.2025Today’s market was quite choppy, especially Gold. I let price develop during the first part of the session, and it became clear that institutions were seeking liquidity, which was found around the previous day’s POC. From that area, price reacted aggressively and pushed toward the upper zone, where it started trading into a non-fair value area formed two days ago.
This area had relatively strong volume, and during the second part of the session, price was met with aggressive sellers. On the CVD, we can see that during the pullback buyers remained active, forming an interesting accumulation within the downtrend.
With the confluence of the 0.618 Fibonacci level and the moving average, price reacted nicely, resulting in a clean and disciplined 3R trade.

How to Trade Breakouts in TradingViewBreakout trading is a strategy that aims to capture strong price movements when markets break through key support or resistance levels, often signaling the start of a new trend or continuation move.
What You'll Learn:
Understanding breakouts as price movements beyond established support or resistance levels
How breakouts can occur at horizontal levels, trendlines, or chart patterns like triangles, rectangles, and flags
Why consolidation patterns often precede strong breakout moves
Recognizing the difference between false breakouts and confirmed breakouts
How to use candle closes beyond key levels as confirmation rather than relying on quick spikes
The critical role of volume in validating breakouts and separating real moves from fakeouts
Why expanding ATR during a breakout confirms increasing volatility and momentum
Understanding the break and close entry method for conservative breakout trades
How to scale into positions by entering partially on the break and adding on continuation
Using the pullback entry strategy to trade retests of broken levels as new support or resistance
Setting stop losses using ATR-based methods or placing them beyond consolidation patterns
Calculating profit targets with measured move techniques by projecting pattern heights
How to mark key levels in TradingView using the horizontal line tool from the left toolbar
Drawing trendlines and connecting swing points for pattern recognition
Accessing built-in pattern recognition tools through the Indicators menu
Practical examples using futures charts across multiple timeframes
This tutorial is designed for futures traders, day traders, and swing traders who want to capitalize on momentum moves and volatility expansion using technical breakout strategies.
The methods discussed may help you identify high-probability breakout setups, manage entries with proper confirmation, and set risk-appropriate stops and targets across multiple markets and timeframes.
Learn more about futures trading with TradingView: optimusfutures.com
Disclaimer
There is a substantial risk of loss in futures trading. Past performance is not indicative of future results. Please trade only with risk capital. We are not responsible for any third-party links, comments, or content shared on TradingView. Any opinions, links, or messages posted by users on TradingView do not represent our views or recommendations. Please exercise your own judgment and due diligence when engaging with any external content or user commentary.
This video represents the opinion of Optimus Futures and is intended for educational purposes only. Chart interpretations are presented solely to illustrate objective technical concepts and should not be viewed as predictive of future market behavior. In our opinion, charts are analytical tools, not forecasting instruments.

FVG RejectionCaught this trade during the Tokyo session. An FVG was formed that took out a swing low. The FVG was retested and rejected. I entered at the fractal BOS and targeted Sell Side Liquidity (SSL). My SL was out above the FVG.

This is a follow up on yesterday's videoThis is December 17th and there have been changes in the market since that time that led to 2 bar reversals which are tools that tell us we can go long or short depending on the 2 bar reversal. We looked at it oil which I think has a good reversal here and we'll protect it with a small stop or we can wait if you don't like it don't take the trade but keep your eye on it because oil finished in ABCd pattern going lower so it may be time for it to reverse and go higher from here. And we looked at a few other markets as well.

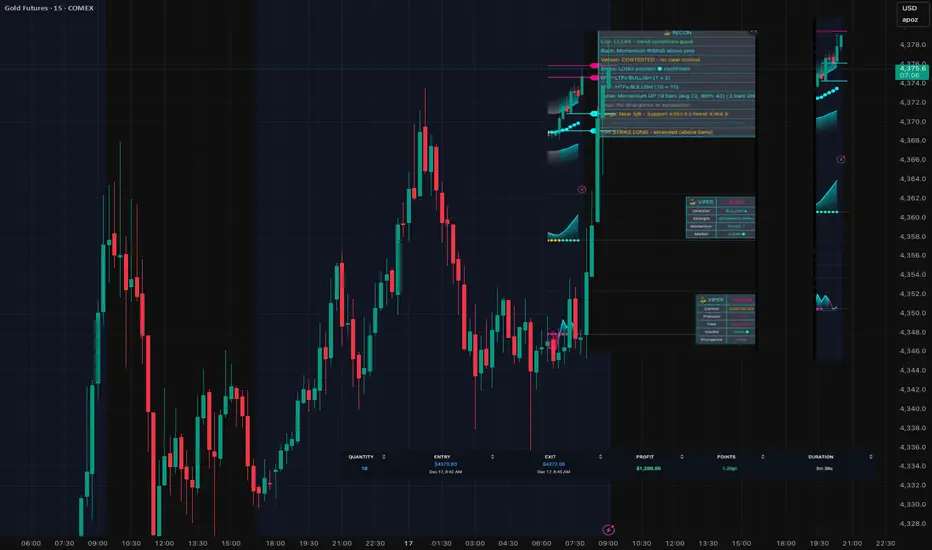
SignalViper Suite — Quick Scalp on Gold FuturesSignalViper Suite — Quick Scalp on Gold Futures (GC)
3-minute trade.
$1,200 profit.
Here's the setup:
RECON showed full alignment:
• Coil: CLEAR — no chop
• Strike: LONG confirmed
• Rush: Momentum RISING
• MTF: All timeframes bullish
• Fangs: Near key S/R levels
The missing piece? Venom was showing CONTESTED — buyers and sellers fighting for control.
I waited.
Next bar, Venom flipped to BUYERS.
That was my trigger. Entry: 4370.80 Exit: 4372.00 Duration: 3 minutes
Result: +1.20 pts on my Apex Trader Fund account. No guessing. No FOMO. Just waited for all 8 indicators to align, then executed. That's what confluence looks like.
Gold Context: Mechanical Balance & The Poor HighFOREXCOM:XAUUSD COMEX_MINI:MGCG2026 COMEX:GC1!
Analysis
1. Market Context (Mechanical Balance)
The auction has entered a phase of Mechanical Balance . By maintaining trade above 4300 for a week, the market is signaling acceptance of higher prices, but the momentum has paused.
* The Behavior: The test of yesterday’s Midpoint/POC and the "mild" activity confirms that Short-Term Timeframe traders are currently dominant. They are trading off visual references rather than creating new value.
2. Structure (The Poor High)
We have a structural anomaly at the 4380/90 area : a Poor High .
* Implication: A poor high lacks "excess" (a buying tail), which indicates the auction did not finish properly. Selling wasn't aggressive; buying simply dried up. This leaves "unfinished business" to the upside.
* The Nuance: While the destination is likely higher to repair this poor high, the market may lack the immediate energy to do so without an inventory adjustment first.
3. Short-Term Scenario (Liquidation)
The mild, mechanical trade increases the odds of Long Liquidation .
* The Flush: A rotation back toward the 4300 shelf would test the lower limits of this balance.
* The Opportunity: If we flush to 4300 and find responsive buying, it re-energizes the market to finally go up and repair the 4380/90 poor high.
Plan & Execution
* Bias: Neutral-to-Bullish (awaiting repair).
* Observation: Watch the 4300 test. Do we get a "look below and fail" (bullish) or acceptance lower? The poor high remains a magnet for the future.
Talk to you for the next update.

Gold Update 17DEC2025: Ending Diagonal Almost Done Market volatility dries up as price approaches the all-time high
Out of the three scenarios posted last time, the first one is playing out
Price is shaping an Ending Diagonal in the final wave up, which should at least retest the record high around $4,400 to complete a full five-wave sequence
Meanwhile, RSI did not build the same bullish momentum and is showing early signs of bearish divergence against price
This confirms that the current move is likely the final wave up and also warns of a possible reversal after price retests the record high
Minor support is located at the previous low around $3,901
Typically, the valley of the larger wave 4 contains the first drop in the event of a reversal
This major support is located near the $3,300 level
Let’s see how price behaves around the all-time high first

Buying GCGC closed bullish on 4H. Bearish 1H low was tagged as sweep of liquidityThere are 15M and 30M bullish engulfing candles. Going for 4H high which should provide 2,5R

MGC Bias: Bullish (price above EMA 20/50), but no fresh impulse.
Structure: Post-trend consolidation / rotation, not expansion.
Entry: Quality pullback buy inside value; stop is structural.
Expectation: Likely rotation to prior highs; limited follow-through.
R:R fit: 1:2.5–1:3 is realistic; 1:5 requires a breakout that is not yet present.
Action: Use fixed 1:3. No partials. Consider runners only after HTF breakout with acceptance and volume expansion.

FVG REjectionCaught this trade during the pre-market moves when a swing low was taken out by a Bearish FVG. The FVG was respected and then rejected. Showed entry after the fractal BOS. Trade Idea was profitable.

GOLD - 16.12.2025Today, price formed a bullish divergence between CVD and price. As expected, we saw a strong positive reaction, with price moving through the entire Value Area formed during the previous session.
However, once price reached the upper side, we witnessed an aggressive rejection from the area where the previous day’s VAH was located.

GC(XAU/USD) technical analysis and directional opinion*In this analysis I will not include macroecnomic analysis as we all know broad financial market is waiting for BoJ to create clear directional bias upcoming end of this week on Friday. However I will make a seperate post regarding "How to decode BoJ decision" on the day before the Japanese rate decision
Technical analysis on Gold futures/XAUUSD 8hour time frame
For better swing opportunity, I have done some analysis on 8hour time frame, as for me I prefer using 8hour on Gold for clearer directional evidence. As we can see in the chart, some people might ape in long position at this exact point, since it is pretty obvious Gold is trying for new ATH, yet my standpoint is a bit different. Remember the times before 2025 XAUUSD bullrun, the times when Gold was in years of indeicison phase, lots of XAUUSD traders have been forced to exit the market. Although the time frame is uncomparably smaller, considering BoJ meeting is just few days left, my opinion is to speculate the market before confirmation either macroecnomically or technically happens. So i have made two different set up on Gold one is long position and one is short position. The previous structure before recent 1.57% drop can be read in two different wave structure, one is ending diagonal(rising wedge) and one is accumulation for strong impulse(3) to the upside. As for me, I am eyeing on either side of structure to break via breakdown through the black trendline or breaking the previous liqudity point to ATH.
Some cautions
Even though we have standard of entry at this point, this is important to keep in mind, in this market where US monetary policy is not indicating clear direction but many people are awaiting for BoJ, the liquidity is extremely thin the structure can be manipulated so as for me I will wait until BoJ rate decision structure(at the moment) will break and retest either point. Also keep in mind for today's NFP, it might stimulate the liquidity temporarily and give us clear retest on either set up.
*This is not a trading advice. It is highly recommended for you to make your own decisions. God bless your account.
