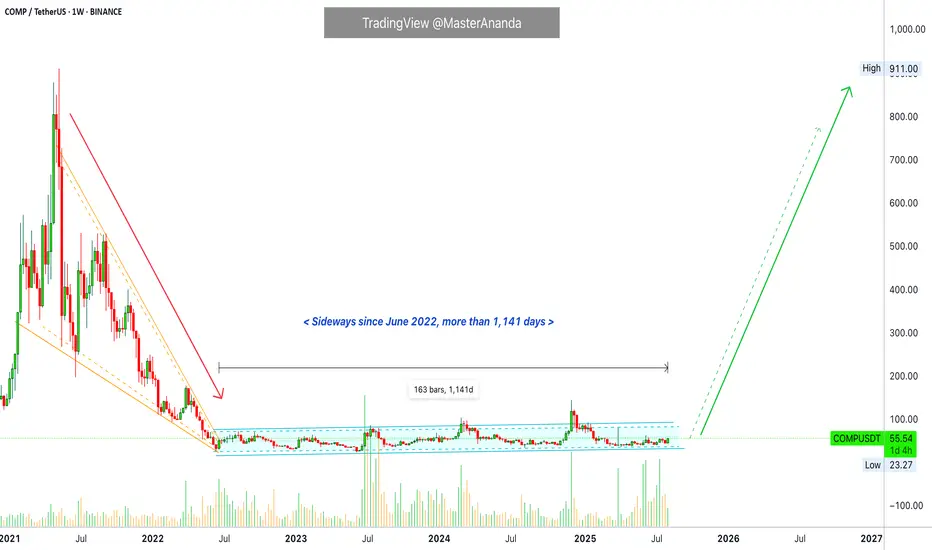
Compound 1,141 Days Long Consolidation EndsCompound is trading at true bottom prices. Compound has been sideways for 1,141 days, more than three years.
This is not a bear market. The market has been even rising slowly within the long-term accumulation and consolidation period.
Trading volume has been big on the buy-side for years. Major bu
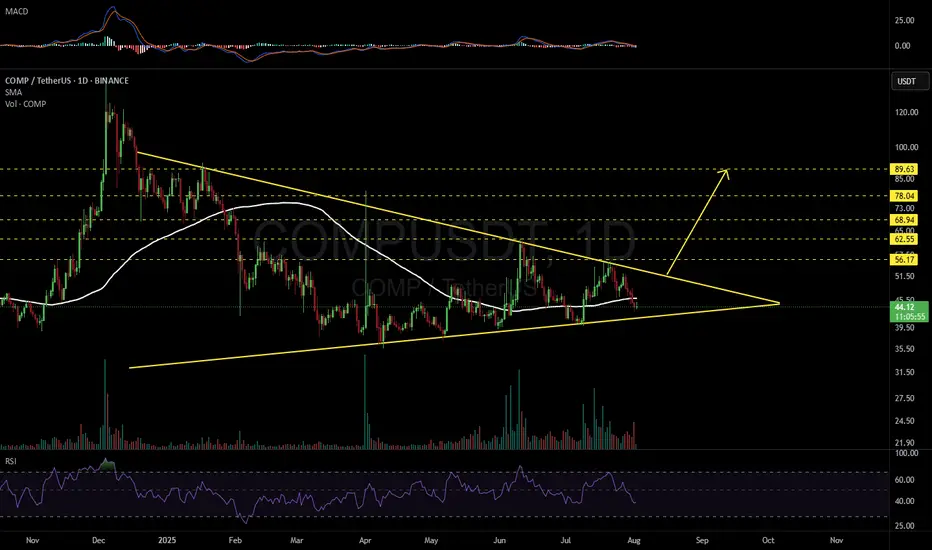
COMPUSDT 1DMany of you have been asking about #COMP.
It needs to hold the triangle’s support line and ideally reach above the daily SMA100 as soon as possible — only then can we expect a potential bullish move.
In any case, if a breakout occurs above the triangle resistance, the upside targets are:
🎯 $56.17
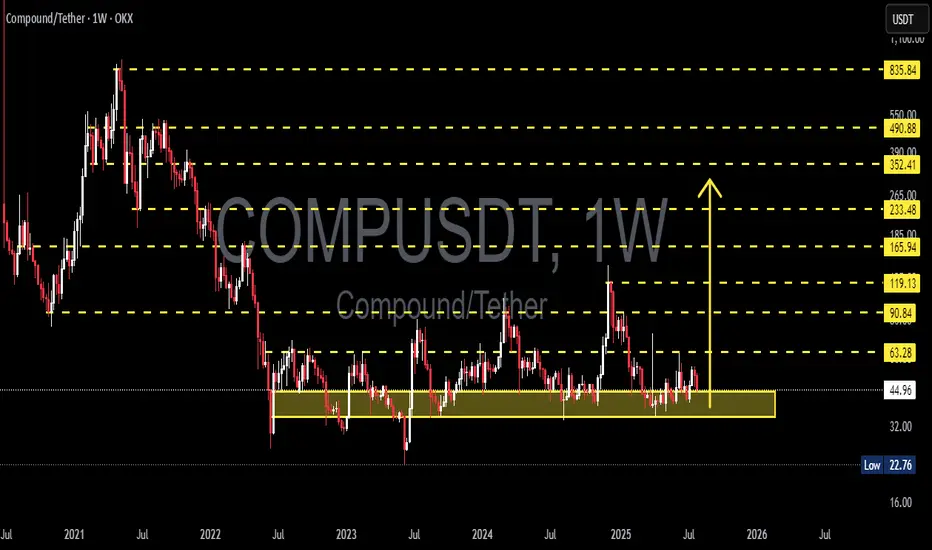
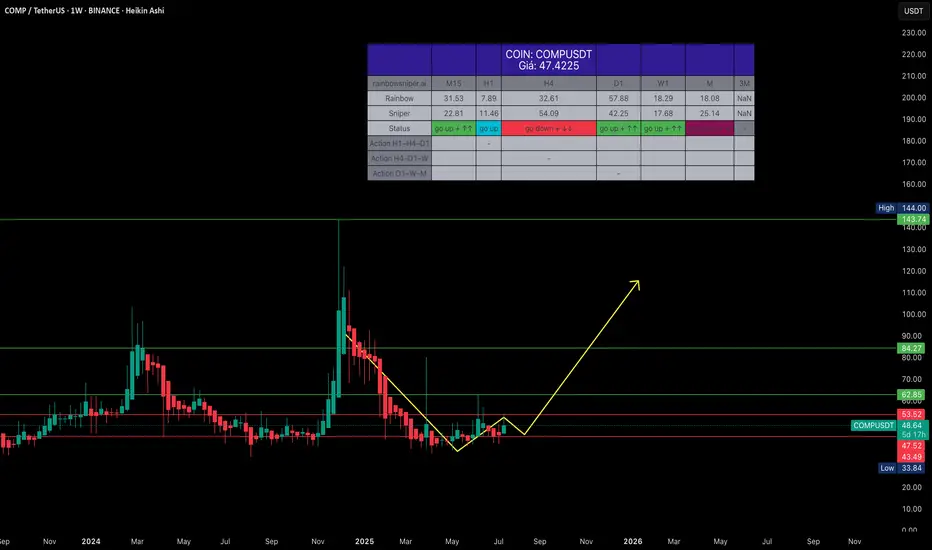
COMPUSDT in a Strong Demand Zone! Reversal Potential / Breakdown🔍 In-Depth Analysis (Timeframe: Weekly / 1W)
The COMP/USDT pair is currently hovering above a long-term demand zone that has held strong since mid-2022. Price is sitting around $44.90, just above the key support area of $32 – $45 (highlighted in yellow), which has acted as a major accumulation zone
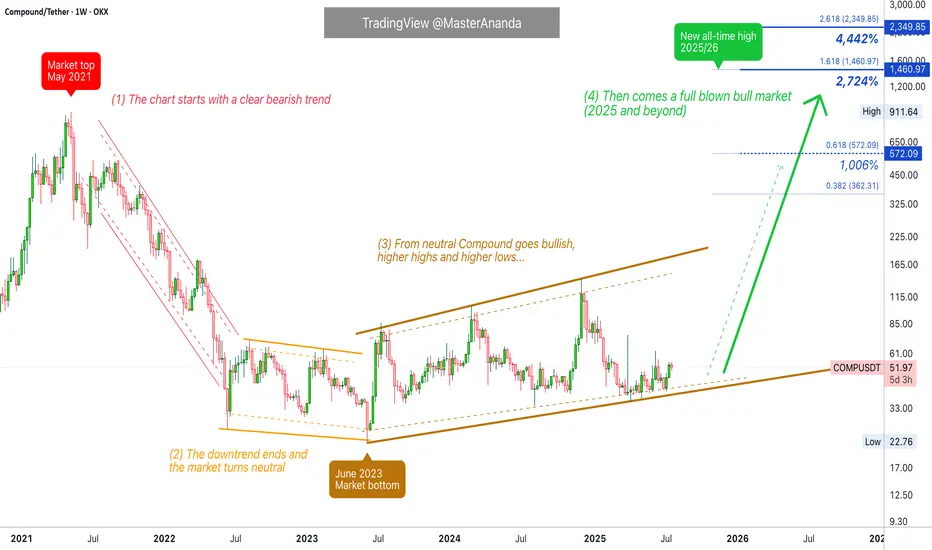
Compound Full Market Cycle · 1, 2, 3 & 4 (PP: 2,700% - 4,442%)This is the full long-term Compound (COMPUSDT) chart.
1) The market top happened May 2021. Notice how the bull market in 2021 ended early compared to 2025. While May signaled the start of a bear market, in 2025 we are already in July while trading at bottom prices.
High prices, a new all-time high
COMPUSDT – Long-term Spot Buy RecommendationCOMPUSDT – Long-term Spot Buy Recommendation
Hello,
In a market flooded with thousands of tokens, manually scanning for trending coins is exhausting and often ineffective. If that resonates with you, COMPUSDT is a worthy candidate to consider.
Current Outlook: COMPUSDT is in an accumulation phas
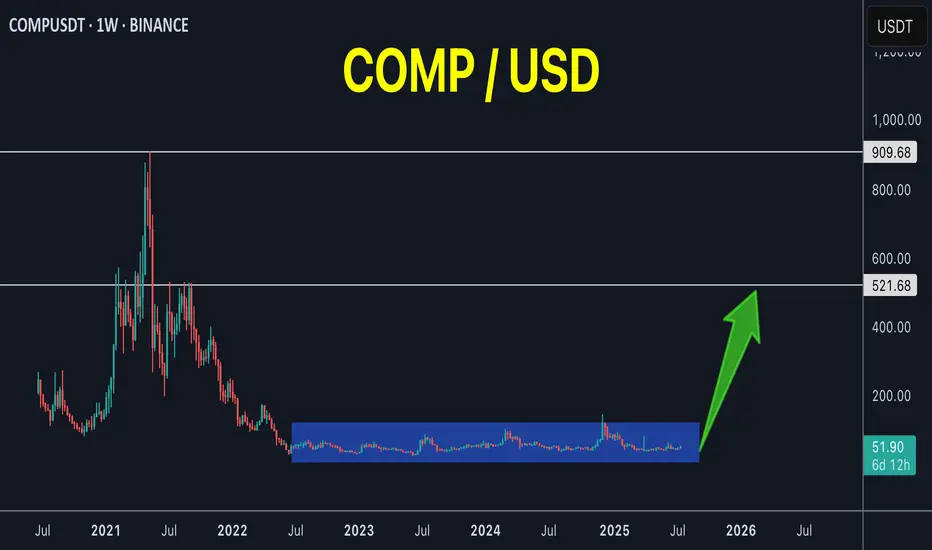
COMP 3 years of accumulation!COMP / USDT
3 years of accumulation and volume start to enter again
Just imagine if it breaks out from this long accumulation, the target will be very high but first we must breakout this accumulation box
Best of wishes
COMPUSDT longHi Traders
Today we are analysing COMP/USDT (BINANCE) on 4-hour timeframe.
The price has been consolidating heavily around $40 support level, showing multiple rejections and signs of potential exhaustion.
I recommend waiting for a slight dip below this support zone ($40) to trap late sellers and

COMPUSDT Accumulation Ending? Massive Bullish Reversal Ahead!
🧠 Weekly Analysis
After peaking near $911 in 2021, COMPUSDT experienced a prolonged downtrend, followed by a wide sideways accumulation phase around the $33–$41 range.
📉 This consolidation has formed a classic Wyckoff Accumulation structure, often seen before strong bullish reversals.
🟨 Key Sup

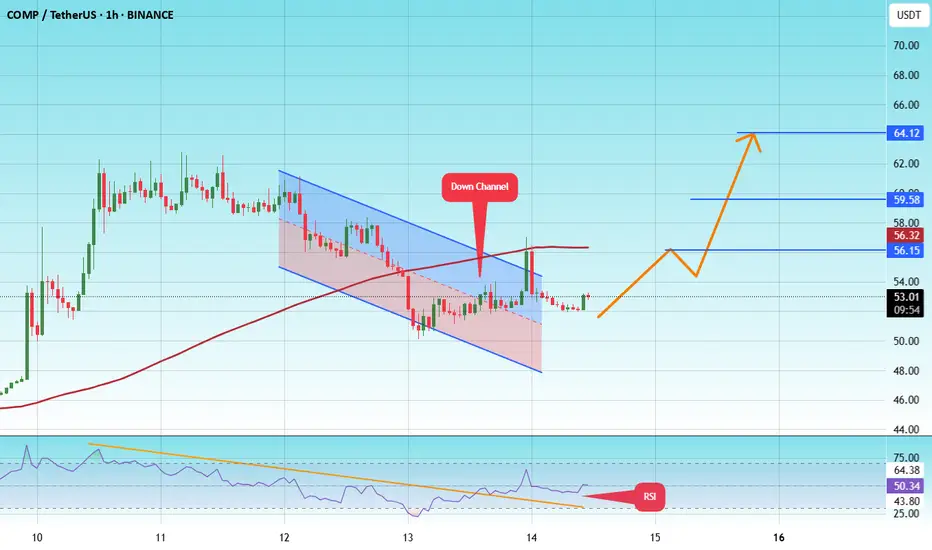
#COMP/USDT#COMP
The price is moving within a descending channel on the 1-hour frame and is expected to break and continue upward.
We have a trend to stabilize above the 100 moving average once again.
We have a downtrend on the RSI indicator that supports the upward move by breaking it upward.
We have a su
Compound 4X Lev. Full PREMIUM Trade-Numbers (PP: 2428%)This is a very, very easy set of targets that I am setting up here for Compound (COMPUSDT). And this trade setup with 4X leverage is low risk, very low risk. High potential for reward (more than 2,000%).
After June 2023, the dynamics changed from lower highs and lower lows, to higher highs and high

See all ideas
Summarizing what the indicators are suggesting.
Oscillators
Neutral
SellBuy
Strong sellStrong buy
Strong sellSellNeutralBuyStrong buy
Oscillators
Neutral
SellBuy
Strong sellStrong buy
Strong sellSellNeutralBuyStrong buy
Summary
Neutral
SellBuy
Strong sellStrong buy
Strong sellSellNeutralBuyStrong buy
Summary
Neutral
SellBuy
Strong sellStrong buy
Strong sellSellNeutralBuyStrong buy
Summary
Neutral
SellBuy
Strong sellStrong buy
Strong sellSellNeutralBuyStrong buy
Moving Averages
Neutral
SellBuy
Strong sellStrong buy
Strong sellSellNeutralBuyStrong buy
Moving Averages
Neutral
SellBuy
Strong sellStrong buy
Strong sellSellNeutralBuyStrong buy
Displays a symbol's price movements over previous years to identify recurring trends.