Will the triangle break on the upside?In the chart, we see the formation of a triangle pattern, and if there is a successful failure with good volume, we expect an increase or fall as much as the base of the triangle. The reason for the formation of an upward trend in the higher time frame is the expectation of the triangle breaking in the upward direction. I have important support on the price of 0.9185 and resistances on the way of the trend at 0.9971 and 1.0115 and I expect growth up to the price of 1.1001.
Market insights

CRV Breakout Target $we have only one resistant lift to confirm a huge momentum and breakout above the 1$, and going towards to test the strong resistant for this month 1.88$.

long CRV$CRV is breaking through the resistance level. Bullish movement to resistance at 1.14$ is likely to happen.

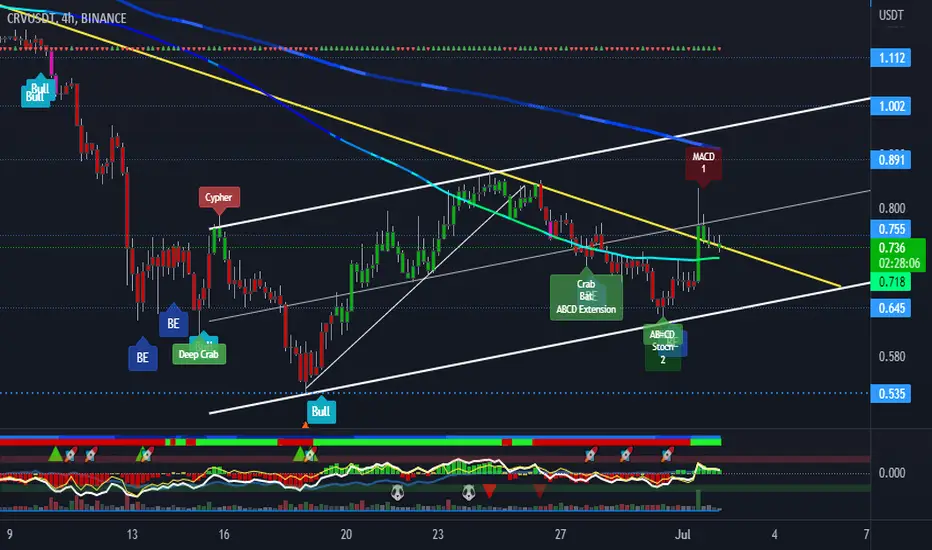
CRV 1H BUYCRV 1H support is at ~$0.8
Enter 50% at the current price
and try to set some buy orders near the support zone
If CRV holds above the trendline,
the Take-Profit target would be 5%, 10%, and 15% from your entry
Cheers


CRVUSDT | KEY AREACRVUSDT is trending near horizontal resistance zone. The price action shows that earlier price get rejected from same area.
The rejection from resistance zone will bring bears and can approach to risisng trendline. While the break above mentioned zone will bring bulls in complete control.

CRV - Buying SignalBYBIT:CRVUSDT
4 Hours chart
-
CRV is approaching the neckline of the potential double bottom.
We can gain a good risk to reward ratio(2.04) if long it here, targets and stop level as below.
-
Targets:
1) 0.963~1.0
2) 1.080
3) 1.209
Stop loss:
1) 0.809-----red horizontal ray

CRVUSDTPERPConsidering that the price is close to the resistance zone in the daily time frame and observing the weakness in the upward trend, we can expect the price to be rejected from the 0.86 area and corrected to around 0.7.

CRV shortCRV us in a rising wedge formation and also very close to the developing POC and previous high. Targets are based on high value areas . the only sub optimal "feature" of this trade is the RR, because the stop loss should be placed just above the previous VAH.


CRVThe price has broken the downtrend line. 200 MA is resistance, 100 MA is support. The price may move within the rising channel
CRVUSDT | OPEN UPSIDE TARGETS CRVUSDT has finally managed to break the trendline. Targets for the upside are open if the markets sentiments remain positive.
Keep protection for the downside intact.

CRV/USDTCRV / USDT
It is located in a downtrend channel where channel support is lost.
On the other hand, it has lost the support of one dollar and if it can not keep the level of 35 cents, it can fall to lower levels.
We expect to lose 35 cents.
#CRV #CRVUSDT #BTC #BTCUSD #LUNA #LUNC #UST

CRVUSD (Daily) Bearish Wave We2Hi Traders
CRVUSD (Daily Timeframe)
A High probability, entry signal to go SHORT will be given with the downward break of 0.678 after the market found resistance at 0.878. Only the upward break of 0.878 would cancel the bearish scenario.
Trade details
Entry: 0.678
Stop loss: 0.878
Take profit 1: 0.340
Take profit 2: 0.116
Score: 8
Strategy: Bearish Wave We2

CRV is moving to where it startedBINANCE:CRVUSDT price has been falling since the begging of 2022. It dropped by around 90% from its top of $6.9.
The price is still under 21 and 30 day EMAs. So, there is no need to change the strategy. It is still a bear trend. I expect the price will test November-December 2021 lows, and even lower in the next term.
After this sell-off, there will eventually be a consolidation. But this is another story.
This may mean that there will be a bearish + consolidation period in the next couple of months. To recap, a bearish trend is the main scenario.
This is not a financial advice. Trade wisely.

CRV ShortBig bearish divergence along with BTC looking weak, high vol. on last two candles so expecting a move back up to the high before downside.
Should wait for NYSE open as it may scam pump up but could also go down, would wait if more money was on the line.
