#CTSI to 0,30$?Hello dear Traders,
Here is my idea for #CTSI
Price closed above yellow line (previous month high)
Price closed (15min Chart) above purple trigger line to enter trade.
Targets marked in the chart (black lines)
Invalidation level marked with red line
Good luck!
❤️Please feel free to ask any question in comments. I will try to answer all! Thank you.
Please, support my work with like, thank you!❤️
Market insights

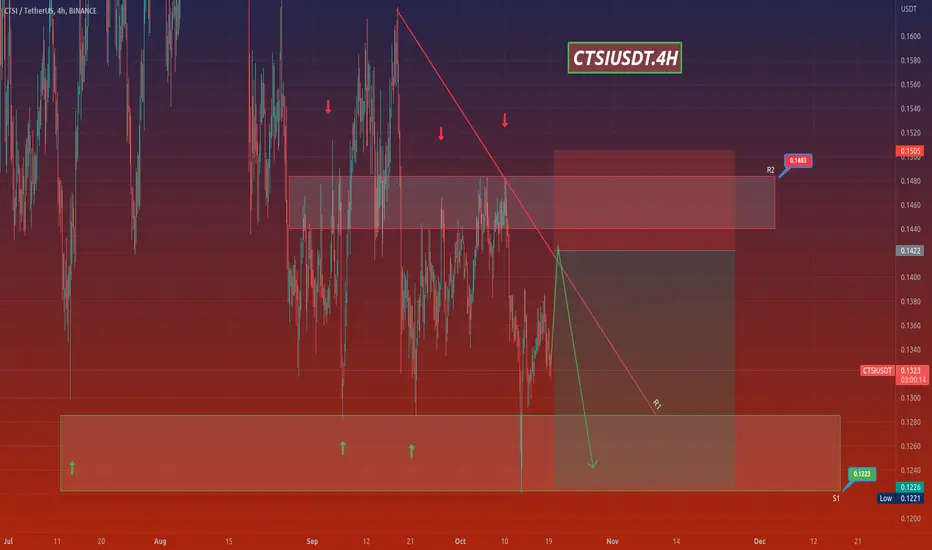
CTSIUSDTHello Crypto Lovers,
Mars Signals team wishes you high profits.
This is a 4-hour-time frame analysis for CTSIUSDT
You see that R2 and R1 are the resistance areas which express the disability of the price to rise. And S1 is our support area that includes the well support of price since the past. Hence, we have the fluctuation of price over S1 and we believe it will continue its rising trend toward R1. There we must wait for some falling signs and via receiving them, the short position of our chart is activated and a fall will be expected to happen down to S1. Let's wait and see what future will reveal for us. Please consider the confirmation candles in your trades for more logical actions.
Warning: This is just a suggestion and we do not guarantee profits. We advise you to analyze the chart before opening any positions.
Wish you luck
CTSI DAILY 101822Expecting a leg lower to finish wave C of 2 from this descending wave B correction. Not financial advice.

CTSI TA training chart
This is my Outlook for CTSI, two possible outcomes, orange option includes broadening the trend

CTSIUSDT Descending Triangle on Daily Chart.Setup for Long on CTSIUSDT using Descending Triangle Pattern.
There's a 5x Tested Support Holding at 0.12940, I see a rejection at 0.14600 taking place, Pushing Price downward to liquidate All the Longs at the 0.12940 Level. After Support Breaks we can 1. Long Lower low or 2. Wait for Confirmation from a Higher Low. Overall it's highly unlikely that we won't break the 5x repeated support imo.
Tp's at past major Resistances. Min R = 2R, Max R = 13R. (10% Initial Risk)


CTSIUSDT wants the breakout?The price had a clear breakout from the daily resistance and retest the Fibonacci level (0.618) as new support.
Now the price is trying to accumulate long position in order to have a clear breakout from the descending channel
How to approach it?
IF the price is going to have a breakout and retest the resistance as new support, According to Plancton's strategy , we can set a nice order
–––––
Keep in mind.
🟣 Purple structure -> Monthly structure.
🔴 Red structure -> Weekly structure.
🔵 Blue structure -> Daily structure.
🟡 Yellow structure -> 4h structure.
–––––
Follow the Shrimp 🦐

CTSIUSDTHello Crypto Lovers,
Mars Signals team wishes you high profits.
This is a 4-hour-time frame analysis for CTSIUSDT
Here we have R1 are the resistance line which shows the unsuccessful triumphs of the price in order to rise. S1 used to be a resistance line and S2 is our support line that represents the support of price. Currently, we see the fluctuation of price below R1 and we expect it will have a decline and then by receiving some confirmation candles to rise, an increase is there for it to R1 (which is good point for saving profits). Even the price may lose the support when it reaches S1 and surely more fall will happen to it toward S2.
Warning: This is just a suggestion and we do not guarantee profits. We advise you to analyze the chart before opening any positions.
Wish you luck

CTSIUSDT Price Reversing From Its Major Support ZoneCTSIUSDT Technical Analysis Update.
CTSI price revering from its major support zone.
Buy zone : $0.142- $0.149
Stop loss : $0.125
Target 1 : $0.165
Target 2 : $0.190
Target 3 : $0.246
Always keep stop loss
Thanks
Hexa

ctsictsi may take all liquidity before some bullish movemnt .It will be at the support of wedge and if breaks out then it may reach the targets

ctsictsi is moving in a descending broadning wedge which is a bullish pattern .we may hit demand or support area one more time before ctsi can give a good move towards upside
NFA DYOR


CTSIUSDT - Short by Supertrend, Pivot & ADX 8/23/20221. HIGH/LOW PIVOT:
- Pivot Left: 10 | Pivot Right: 10
Short trend identification:
- Lower Low occurs after Lower High.
2. ADX INDICATOR: 1h & 4h timeframe have a strong strength for open trade.
- ADX smoothing: 14.
- DI length: 14.
- ADX STRONG > 25.
3. SUPERTREND INDICATOR:
- Short trend when closes candle is below the red line.
4. OPEN POSITION RULE:
- SELL/SHORT: reject to Supertrend at current timeframe.
\

CTSIYou are the one who decide to buy or sale of your own profit
Its not an advice for buying or selling
Its just an analytic pattern

CTSIUSDT - Long by Supertrend, Pivot & ADX 8/1/20221. HIGH/LOW PIVOT:
- Pivot Left: 10 | Pivot Right: 10
Long trend identification:
- Higher High occurs after Higher Low.
2. ADX INDICATOR: 1h & 4h timeframe have a strong strength for open trade.
- ADX smoothing: 14.
- DI length: 14.
- ADX STRONG > 25.
3. SUPERTREND INDICATOR:
- Long trend when closes candle is above the green line.
4. OPEN POSITION RULE:
- BUY/LONG: reject to Supertrend at current timeframe.

CTSIUSDT - Short by Supertrend, Pivot & ADX 7/27/20221. HIGH/LOW PIVOT:
- Pivot Left: 10 | Pivot Right: 10
Short trend identification:
- Lower Low occurs after Lower High.
2. ADX INDICATOR: 1h & 4h timeframe have a strong strength for open trade.
- ADX smoothing: 14.
- DI length: 14.
- ADX STRONG > 25.
3. SUPERTREND INDICATOR:
- Short trend when closes candle is below the red line.
4. OPEN POSITION RULE:
- SELL/SHORT: reject to Supertrend at current timeframe.

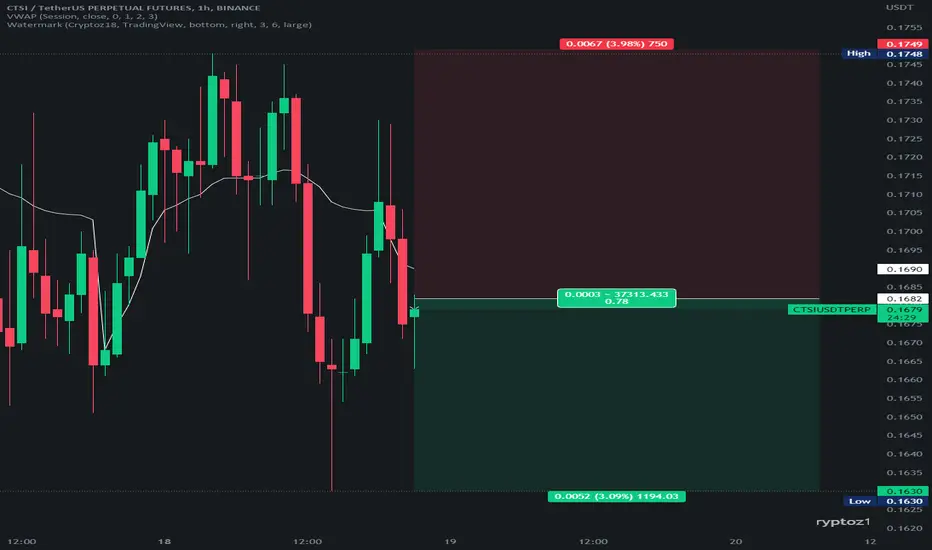
CTSI could have a little setback - Cryptoz18❶ Warning
Operations in the Blockchain or FX market represent a high risk. Cryptoz18 is a content creator who posts his ideas for viewers however he never provides an investment recommendation. I recommend to the reader a good risk management and knowledge regarding the environment. Thank you very much.
❷ Tutorials
➤ Here you can find a brief explanation of how the operations work in case you are interested in following them.
➤ Here you can find an explanation of how to track our ideas:
✔️ Our operations are taken with StopLoss and Take Profit of 15 minutes. However, we are looking to try and catch a 4H trend. So, once we touch the TPM according to your own analysis you should consider whether to close the trade or move StopLoss to entry.
❸ Operational Information
• Entry price: 0.1690
• StopLoss: 0.1749 (Loss 3.98%)
• TakeProfit Minimum: 0.1630 (Win 3.09%)
• Recommended margin: 5% of the Futures account
• Recommended leverage: 1x.
• Temporality: 15Min - 4H
CTSIUSDT - Long by Supertrend, Pivot & ADX 7/19/20221. HIGH/LOW PIVOT:
- Pivot Left: 10 | Pivot Right: 10
Long trend identification:
- Higher High occurs after Higher Low.
2. ADX INDICATOR: 1h & 4h timeframe have a strong strength for open trade.
- ADX smoothing: 14.
- DI length: 14.
- ADX STRONG > 25.
3. SUPERTREND INDICATOR:
- Long trend when closes candle is above the green line.
4. OPEN POSITION RULE:
- BUY/LONG: reject to Supertrend at current timeframe.

$CTSI- quickie puntanother coin we should scam pump , buying a small bag on a pull back
at range low just needs a little volume to get it going.

$CTSI/USDT 12h(#BinanceFutures)Falling broadening wedge breakoutCartesi regained 50MA support and seems ready for bullish continuation, after a last pull-back if we are lucky enough!
Current Price= 0.2394
Buy Entry= 0.2173 - 0.1965
Take Profit= 0.2626 | 0.3118 | 0.3520
Stop Loss= 0.1622
Risk/Reward= 1:1.25 | 1:2.35 | 1:3.25
Expected Profit= +26.92% | +50.70% | +70.14%
Possible Loss= -21.61%
Fib. Retracement= 0.5 | 0.618 | 0.702
Margin Leverage= 1x
Estimated Gain-time= 1.5 months
Tags: #CTSI #CTSIUSDT #PoS #Staking #L2 #Scaling #SC #Rollup #DApp #DeFi #BSC
Website: cartesi.io
Contracts:
#ERC20 0x491604c0fdf08347dd1fa4ee062a822a5dd06b5d
#BEP20 0x8da443f84fea710266c8eb6bc34b71702d033ef2
#AVAXC 0x6b289cceaa8639e3831095d75a3e43520fabf552
#Polygon 0x2727Ab1c2D22170ABc9b595177B2D5C6E1Ab7B7B
#Arbitrum 0x319f865b287fCC10b30d8cE6144e8b6D1b476999


#CTSI/USDT 30M CHART UPDATE. !!As we can see in the above-mentioned chart that CTSI/USDT broke the triangle pattern and moved upward.
Here CTSI /USDT looks promising, so we can long at :
ENTRY: BUY AT CMP AND ADD MORE TO $0.23
TARGET : 10% TO 15%
LEVERAGE : USE LEVERAGE 10X - 20X
STOP LOSS : $0.2218
Hello, dear traders welcome you to this BNB/USDT chart analysis.
Hello dear traders, we here new so we ask you to support our ideas with your LIKE and COMMENT, also be free to ask any question in the comments, and we will try to answer for all, thank you, guys.
Remember:-This is not a piece of financial advice. All investment made by me is at my own risk and I am held responsible for my own profit and losses. So, do your own research before investing in this trade.
Thanks for your time, we hope our work is good for you, and you are satisfied, we wish you a good day and big profits.
THANK YOU.

#CTSI/USDT TRADE SETUP Hi guys, This is CryptoMojo, One of the most active trading view authors and fastest-growing communities.
Do consider following me for the latest updates and Long /Short calls on almost every exchange.
I post short mid and long-term trade setups too.
Let’s get to the chart!
I have tried my best to bring the best possible outcome in this chart, Do not consider it as financial advice.
CTSI/USDT TRADE SETUP:- CTSI is Breaking out from the triangle and currently retesting it. Long now and add more in the dip.
Entry range:- $0.23-$0.235
Target:- 15-20%
SL:- $0.2232
Lev:- 10x-20x
This chart is likely to help you in making better trade decisions if it did consider upvoting this chart.
Would also love to know your charts and views in the comment section.
Thank you
