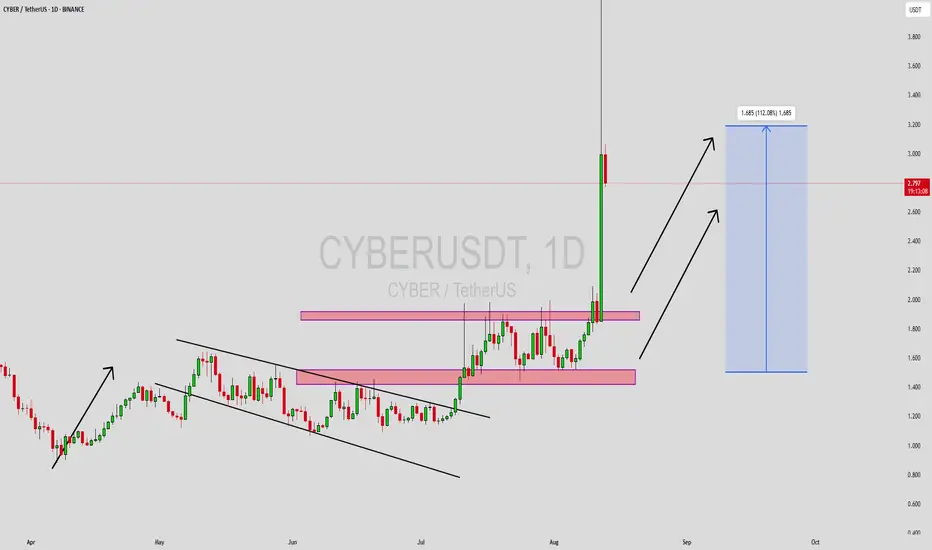
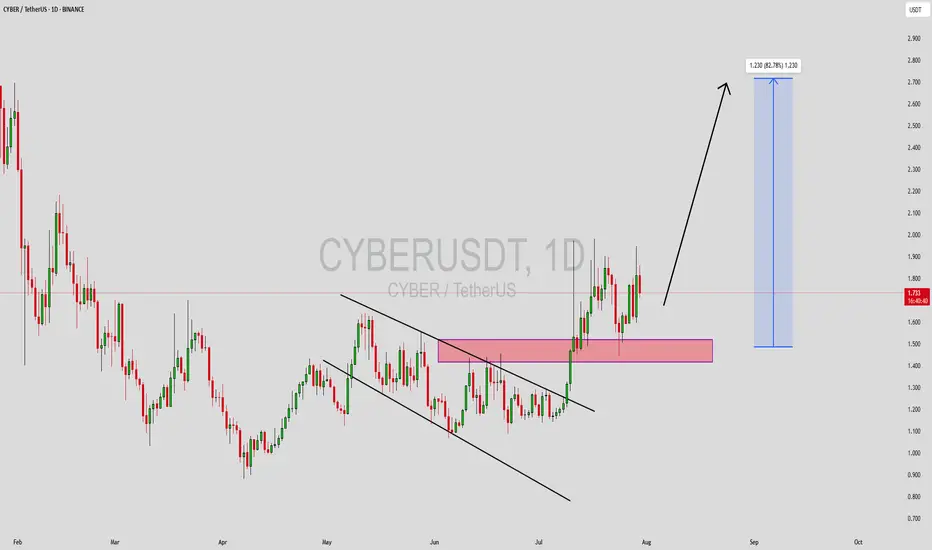
CYBERUSDT Forming Bullish ContinuationCYBERUSDT is currently displaying a strong bullish continuation pattern, suggesting that the recent upward momentum is far from over. After an impressive rally, the price has entered a healthy consolidation phase, forming a technical structure that typically signals continuation rather than reversal. This setup, combined with sustained buying volume, points toward a potential breakout to the upside. Traders looking for high-probability entries may find CYBERUSDT positioned perfectly for the next leg higher.
The continuation pattern indicates that the bulls are still in control, taking a brief pause before pushing the price further. The market structure is clean, with higher lows being maintained and no signs of exhaustion. Volume remains steady and supportive, which is critical in confirming the pattern’s reliability. If price breaks above the consolidation range with increased volume, we could see a rapid move toward the projected target — potentially a 90% to 100% gain from current levels.
Investor sentiment around the CYBER project has noticeably strengthened, driven by rising interest in its fundamentals and use-case within the broader blockchain ecosystem. The growing community and technical resilience of the asset are drawing in both retail and institutional participants. This alignment between price action, volume, and sentiment makes CYBERUSDT a compelling asset for bullish continuation trades.
✅ Show your support by hitting the like button and
✅ Leaving a comment below! (What is You opinion about this Coin)
Your feedback and engagement keep me inspired to share more insightful market analysis with you!
CYBERUSDT trade ideas

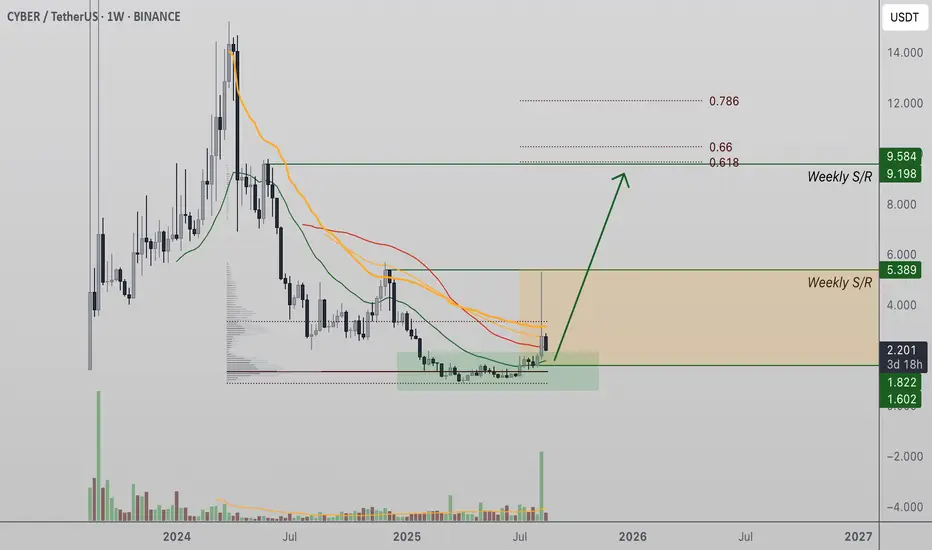
Cyber Pulls Back to Accumulation Zone After $5.38 RejectionCyber (CYBER) recently faced rejection at daily resistance of $5.38, leading to a corrective move. Price has now returned to its accumulation zone, where holding support could fuel a rally toward $9.19.
Cyber’s recent rally met stiff resistance at the $5.38 level, producing a rejection candle with a selling wick. This rejection has shifted short-term sentiment, causing price to pull back into the accumulation zone that served as the foundation of the last bullish expansion. While momentum has cooled, the corrective move is not inherently bearish. Instead, it represents a retest of structural support that could sustain the broader bullish trajectory if defended successfully.
The accumulation zone holds additional weight because it overlaps with the point of control (POC) on the volume profile. This region represents the area where the most trading activity has taken place, making it a high-volume node. Such areas often act as magnets for price and are frequently retested during corrective phases before continuation occurs. Cyber’s current retest of this zone therefore carries significant implications for its next directional move.
Key Technical Points:
- $5.38 Daily Resistance: A sharp rejection at this level triggered the corrective pullback.
- Accumulation Zone + POC: Price has returned to this high-volume support region, critical for maintaining bullish structure.
- Upside Target at $9.19: Holding support increases the probability of a rotation back toward the previous high.
From a structural perspective, Cyber remains in a bullish framework. The weekly chart still shows a pattern of higher highs and higher lows, meaning the broader trend has not been invalidated. The current corrective move should therefore be viewed as a retest rather than a breakdown. What matters now is whether bulls can maintain control of the accumulation zone in the coming days and weeks.
Volume analysis remains key to confirming the next move. While the recent pullback has not yet been accompanied by strong bullish inflows, this is not uncommon during early stages of a retest. Traders will want to see volume begin to pick up at support, as this would signal renewed demand and strengthen the probability of continuation higher.
If buying pressure emerges and price begins to rotate out of the accumulation zone, the path toward $9.19 becomes viable once again. This level marks a major resistance target and would represent a significant continuation of Cyber’s prior bullish expansion.
What to Expect in the Coming Price Action
Cyber remains in a consolidation phase following its rejection at $5.38. As long as the accumulation zone and point of control hold, the broader market structure will stay bullish. A decisive defense of this region increases the likelihood of another bullish rotation, with $9.19 as the next major upside target.
CYBER/USDT - Continuation Unfortunately, the first wave was missed as yesterday’s setup was ready to publish but somehow I ignore it , but the structure still offers room for continuation. Current momentum remains strong, and price action suggests further upside potential from the present levels toward the $6–$7 zone. Any intraday pullbacks into support could offer fresh entries to join the ongoing bullish leg.

CYBER is ready to move higherAfter big dump, bottoming pattern formed succesfully and CYBER can go easily to the upside.
Expecting targets 40-110% in the mid term.
THIS IS NOT A FINANCIAL ADVICE
MANAGE YOUR RISK AND SET STOPLOSS ALWAYS

CYBER to ALL-TIME HIGHCyber broke the resistance line in weekly with massive trading volume. It can be very bullish for the rest of the year

CYBERUSDT Forming Falling WedgeCYBERUSDT is showing one of the most explosive technical setups in the market right now, with a well-formed falling wedge pattern signaling a potential major bullish breakout. Falling wedges are historically known for their strong reversal potential, and with CYBERUSDT’s good trading volume supporting this structure, the conditions are aligning for a massive price surge. Based on technical projections, the upside potential ranges from an impressive 290% to 300%+, making this a highly attractive watch for aggressive traders and swing investors.
The current price action shows a gradual compression within the wedge, with each new low being less aggressive than the previous, suggesting that sellers are losing strength while buyers are quietly accumulating. A breakout above the wedge resistance, accompanied by a volume spike, would confirm the bullish reversal and could send CYBERUSDT into a rapid upward trend. Given the magnitude of the projected move, this could become one of the strongest performing crypto pairs in the coming weeks.
Investor interest is steadily building, as such large breakout potentials tend to attract both retail traders and larger market participants. If momentum builds post-breakout, CYBERUSDT could rally toward its multi-hundred-percent targets in a relatively short period, potentially creating a powerful opportunity for those positioned early. Traders are closely watching for confirmation signals to capitalize on this rare high-reward technical formation.
✅ Show your support by hitting the like button and
✅ Leaving a comment below! (What is You opinion about this Coin)
Your feedback and engagement keep me inspired to share more insightful market analysis with you!
CYBERUSDT Forming Bullish PennantCYBERUSDT is forming a textbook bullish pennant pattern, a classic continuation structure that often leads to sharp upside moves. The pattern typically emerges after a significant price surge—known as the flagpole—and consolidates into converging trendlines before breaking upward. In the context of crypto, volume usually rises during the initial rally, tapers during consolidation, and then spikes again at breakout—confirming the pattern's validity
In CYBER’s case, this pattern aligns with the recent strong move higher and tightening price action. Supported by healthy trading volume, the setup points to a continuation of the bullish move. If volume confirms a breakout, we could see the pairing surge by 90% to 100%+, making this one of the most compelling setups on the chart.
On-chain activity and market attention for CYBER are also picking up—the asset has started forming higher highs and higher lows, indicating renewed bullish momentum. With broader investor interest rising and technical structure aligning, the conditions are ripe for a powerful breakout.
If you're scanning for continuation setups with strong technical and sentiment confluence, CYBERUSDT deserves serious attention. A clean breakout from the pennant on rising volume could pave the way for an explosive rally.
✅ Show your support by hitting the like button and
✅ Leaving a comment below! (What is your opinion about this Coin)
Your feedback and engagement keep me inspired to share more insightful market analysis with you!

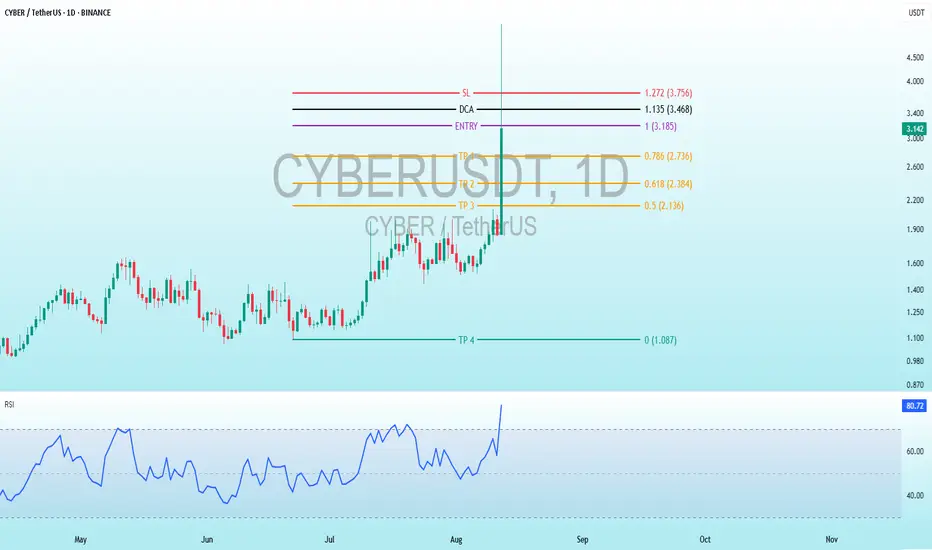
Comprehensive Technical Breakdown for CYBER TradingBINANCE:CYBERUSDT
Trade Setup:
Target 1: 2.736 (0.786 Fibonnaci Golden Zone).
Target 2: 2.384 (0.618 Fibonnaci Golden Zone).
Target 3: 2.136 (0.5 Fibonnaci Golden Zone).
Target 4: 1.087 (0 Fibonnaci).
DCA : 3.468 (1.135 Fibonacci)
Stop Loss: 3.756 (1.272 Fibonacci).
Current Value: 81.00, which is above the 70 level, suggesting an overbought condition. This could indicate a potential correction or price drop in the near future.
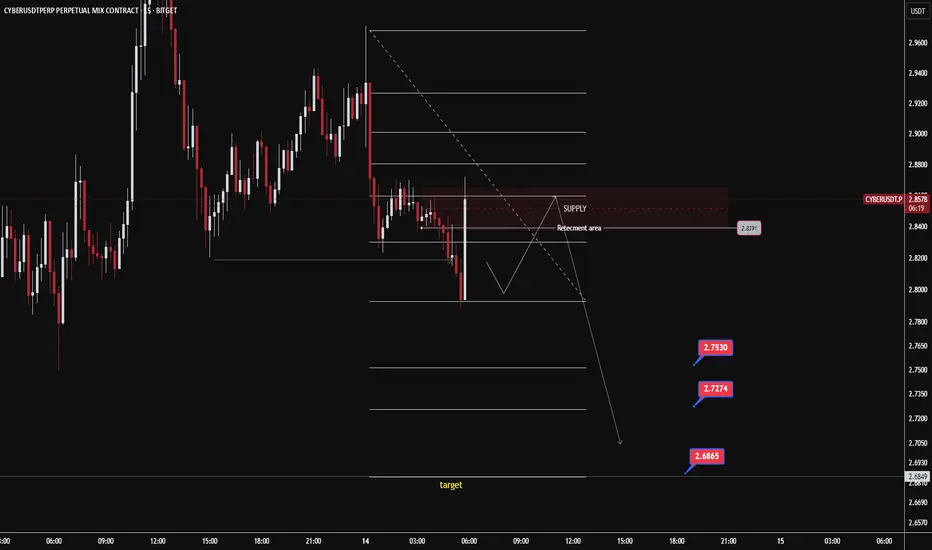
CYBER POTENTIAL DOWN 1. Market Condition
The market is currently in a downtrend on the 15-minute timeframe. Price has just broken below a minor support level and is moving toward a temporary demand area before a potential retest of the supply zone (around 2.8391). The structure is still forming lower highs and lower lows, indicating seller dominance.
2. Decision-Making Approach
Primary Scenario: Wait for price to retrace toward the supply/retracement zone (around 2.83–2.84) to look for sell opportunities in line with the prevailing trend.
Confirmation: Look for rejection or reversal candlestick patterns in the supply zone before entering.
Targets: As marked on the chart, potential take-profit levels are around 2.7530, 2.7274, and 2.6865.
Stop Loss: Place just above the supply zone to manage risk effectively.
3. Chart Explanation
Fibonacci Retracement & Extension: Used to measure potential pullback levels and the next downside targets.
Supply Zone: The red area above indicates a potential seller re-entry zone.
Arrows & Price Path: Illustrates the expected movement — pullback to supply followed by a drop toward the targets.
Price Labels: 2.7530, 2.7274, and 2.6865 are projected downside targets based on technical analysis.
CYBERUSDT Forming Descending ChannelCYBERUSDT is currently displaying a bullish setup, forming a textbook descending wedge pattern on the chart. This technical formation is typically a strong reversal signal, often preceding a breakout to the upside. With price action narrowing within the wedge and maintaining solid support, the probability of an impulsive move upwards increases. Volume remains consistent, indicating that accumulation may already be underway by informed participants.
The descending wedge pattern converges toward a breakout zone, and CYBERUSDT is now nearing that critical point. Historically, such patterns lead to a price surge once the resistance line is breached with conviction. The expected potential gain of 70% to 80% aligns with the measured move from the height of the wedge, making this pair an attractive setup for breakout traders and mid-term holders. Momentum indicators are also starting to tilt bullish, providing further confluence for upside movement.
Investor interest appears to be growing around CYBER, not only from technical traders but also from market sentiment indicators. This suggests that the coin is gaining traction across multiple fronts, which could act as a catalyst for further price appreciation. The wedge breakout, if confirmed with strong volume, could result in a swift and aggressive rally, especially in a supportive broader market environment.
If CYBERUSDT breaks out with strength and retests the upper boundary successfully, it could mark the beginning of a sustained bullish phase. Traders should watch for confirmation with a daily candle close above the wedge resistance. With significant upside potential and a bullish pattern structure, CYBERUSDT is one of the coins to watch closely this week.
✅ Show your support by hitting the like button and
✅ Leaving a comment below! (What is You opinion about this Coin)
Your feedback and engagement keep me inspired to share more insightful market analysis with you!
$CYBERUSDT Trade Setup.$CYBER/USDT – Swing Trade Setup•
Entry: CMP
• Stop Loss: $1.601
• Target 1: $1.995
• Target 2: $2.206
• Target 3: $2.448
Not financial advice. DYOR.

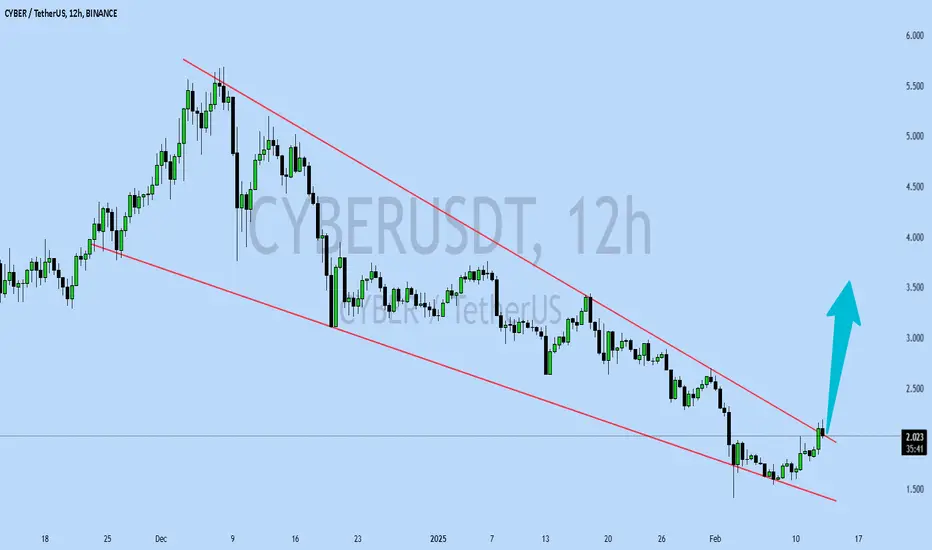
CYBER/USDT – Re-Accumulation Near CompletionCYBER/USDT is nearing the end of a clear re-accumulation phase, marked by steady consolidation and higher low formations. The structure suggests that smart money has been loading in, preparing for the next major leg upward.
Price action is tightening, and momentum is shifting—indicating a potential breakout from the range. Given the current setup and market context, there is high potential for a move that could double from current levels, especially if volume confirms the breakout.

CYBER/USDTKey Level Zone: 1.300 - 1.320
LMT v2.0 detected.
The setup looks promising—price previously trended upward with rising volume and momentum, then retested this zone cleanly. This presents an excellent reward-to-risk opportunity if momentum continues to align.
Introducing LMT (Levels & Momentum Trading)
- Over the past 3 years, I’ve refined my approach to focus more sharply on the single most important element in any trade: the KEY LEVEL.
- While HMT (High Momentum Trading) served me well—combining trend, momentum, volume, and structure across multiple timeframes—I realized that consistently identifying and respecting these critical price zones is what truly separates good trades from great ones.
- That insight led to the evolution of HMT into LMT – Levels & Momentum Trading.
Why the Change? (From HMT to LMT)
Switching from High Momentum Trading (HMT) to Levels & Momentum Trading (LMT) improves precision, risk control, and confidence by:
- Clearer Entries & Stops: Defined key levels make it easier to plan entries, stop-losses, and position sizing—no more guesswork.
- Better Signal Quality: Momentum is now always checked against a support or resistance zone—if it aligns, it's a stronger setup.
- Improved Reward-to-Risk: All trades are anchored to key levels, making it easier to calculate and manage risk effectively.
- Stronger Confidence: With clear invalidation points beyond key levels, it's easier to trust the plan and stay disciplined—even in tough markets.
Whenever I share a signal, it’s because:
- A high‐probability key level has been identified on a higher timeframe.
- Lower‐timeframe momentum, market structure and volume suggest continuation or reversal is imminent.
- The reward‐to‐risk (based on that key level) meets my criteria for a disciplined entry.
***Please note that conducting a comprehensive analysis on a single timeframe chart can be quite challenging and sometimes confusing. I appreciate your understanding of the effort involved.
Important Note: The Role of Key Levels
- Holding a key level zone: If price respects the key level zone, momentum often carries the trend in the expected direction. That’s when we look to enter, with stop-loss placed just beyond the zone with some buffer.
- Breaking a key level zone: A definitive break signals a potential stop‐out for trend traders. For reversal traders, it’s a cue to consider switching direction—price often retests broken zones as new support or resistance.
My Trading Rules (Unchanged)
Risk Management
- Maximum risk per trade: 2.5%
- Leverage: 5x
Exit Strategy / Profit Taking
- Sell at least 70% on the 3rd wave up (LTF Wave 5).
- Typically sell 50% during a high‐volume spike.
- Move stop‐loss to breakeven once the trade achieves a 1.5:1 R:R.
- Exit at breakeven if momentum fades or divergence appears.
The market is highly dynamic and constantly changing. LMT signals and target profit (TP) levels are based on the current price and movement, but market conditions can shift instantly, so it is crucial to remain adaptable and follow the market's movement.
If you find this signal/analysis meaningful, kindly like and share it.
Thank you for your support~
Sharing this with love!
From HMT to LMT: A Brief Version History
HM Signal :
Date: 17/08/2023
- Early concept identifying high momentum pullbacks within strong uptrends
- Triggered after a prior wave up with rising volume and momentum
- Focused on healthy retracements into support for optimal reward-to-risk setups
HMT v1.0:
Date: 18/10/2024
- Initial release of the High Momentum Trading framework
- Combined multi-timeframe trend, volume, and momentum analysis.
- Focused on identifying strong trending moves high momentum
HMT v2.0:
Date: 17/12/2024
- Major update to the Momentum indicator
- Reduced false signals from inaccurate momentum detection
- New screener with improved accuracy and fewer signals
HMT v3.0:
Date: 23/12/2024
- Added liquidity factor to enhance trend continuation
- Improved potential for momentum-based plays
- Increased winning probability by reducing entries during peaks
HMT v3.1:
Date: 31/12/2024
- Enhanced entry confirmation for improved reward-to-risk ratios
HMT v4.0:
Date: 05/01/2025
- Incorporated buying and selling pressure in lower timeframes to enhance the probability of trending moves while optimizing entry timing and scaling
HMT v4.1:
Date: 06/01/2025
- Enhanced take-profit (TP) target by incorporating market structure analysis
HMT v5 :
Date: 23/01/2025
- Refined wave analysis for trending conditions
- Incorporated lower timeframe (LTF) momentum to strengthen trend reliability
- Re-aligned and re-balanced entry conditions for improved accuracy
HMT v6 :
Date : 15/02/2025
- Integrated strong accumulation activity into in-depth wave analysis
HMT v7 :
Date : 20/03/2025
- Refined wave analysis along with accumulation and market sentiment
HMT v8 :
Date : 16/04/2025
- Fully restructured strategy logic
HMT v8.1 :
Date : 18/04/2025
- Refined Take Profit (TP) logic to be more conservative for improved win consistency
LMT v1.0 :
Date : 06/06/2025
- Rebranded to emphasize key levels + momentum as the core framework
LMT v2.0
Date: 11/06/2025
- Fully restructured lower timeframe (LTF) momentum logic

$CYBERUSDT 6H chart Setup$CYBER/USDT Trade Setup
Breakout Retest on 6H chart
Entry: $1.362–$1.384
SL: $1.275
TP 1:- $1.753
TP 2:- $1.995
Hold above $1.362 for bullish continuation.
Watch for confirmation before entry.
DYRO, NFA

CYBERUSDT 1D#CYBER — Breakout & Retest in Play 🚀
#CYBER has broken above the descending resistance and the MA50 on the daily chart, showing strong bullish momentum.
It is now retesting the broken trendline, which could act as a new support. If the retest holds, the next targets are:
🎯 $1.669
🎯 $2.014
🎯 $2.299
🎯 $2.680
🎯 $3.218
⚠️ Always use a tight stop-loss to manage risk and protect your capital.

Cyber is cookingCyber has completed A-B-C correction and now it's ready to reach point B. If point B becomes support then uptrend continues.
NFA - not financial advice.

CYBER ANALYSIS🚀#CYBER Analysis : Pattern Formation
🔮As we can see in the chart of #CYBER that there is a formation Inverse Head And Shoulder Pattern and it's a bullish pattern. If the candle breaks and sustain above the neckline then a bullish move could be confirmed✅
🔰Current Price: $1.290
⚡️What to do ?
👀Keep an eye on #CYBER price action. We can trade according to the chart and make some profits⚡️⚡️
#CYBER #Cryptocurrency #TechnicalAnalysis #DYOR

HiMonacci Strike | Long | CYBERUSDT | 3m🔹 Signal Type: HiMonacci Strike
🔹 Direction: LONG
🔹 Symbol: CYBERUSDT.P (BINANCE)
🔹 Timeframe: 3m
🔹 Entry Price: AT LEAST 0.96 (lower is okay in case of drawdown)
🔹 Close Price: 0.981
🔹 Leverage: 4.97x (Calculated based on liquidation at 0.778)
💥 RISK MANAGEMENT NOTE:
THIS SYSTEM DOES NOT USE STOPLOSS.
CAPITAL IS DIVIDED INTO 24 PARTS.
A CALCULATED LEVERAGE IS USED TO SET A SAFE LIQUIDATION LEVEL.
YOU CAN ENTER BELOW THE ENTRY PRICE IN CASE OF DRAWDOWN.
LIQUIDATION = SIGNAL FAILURE.
📈 How to Use:
This signal is part of the HiMonacci system.
Use the leverage provided to align your liquidation near the system’s calculated risk point.
Entering below the entry price is allowed (and often better) if there's a drawdown.
📬 Want to Automate It?
We offer FULL AUTOMATION on Binance, using your own account, 100% secure.
This system can generate 40-55% monthly on average.
Let the candles work for you! 🕯️📊
#HiMonacci

#CYBER/USDT#CYBER
The price is moving within a descending channel on the 1-hour frame, adhering well to it, and is heading for a strong breakout and retest.
We are seeing a bounce from the lower boundary of the descending channel, which is support at 1.46.
We have a downtrend on the RSI indicator that is about to break and retest, supporting the upward trend.
We are looking for stability above the 100 moving average.
Entry price: 1.52
First target: 1.587
Second target: 1.67
Third target: 1.67

CYBERUSDT 1DCYBER ~ 1D Analysis
#CYBER High risk trading. Buy after successfully penetrating this resistant line with a short -term target of at least 10+.

CYBERUSDT UPDATECYBERUSDT is a cryptocurrency trading at $2.026. Its target price is $3.500, indicating a potential 70%+ gain. The pattern is a Bullish Falling Wedge, a reversal pattern signaling a trend change. This pattern suggests the downward trend may be ending. A breakout from the wedge could lead to a strong upward move. The Bullish Falling Wedge is a positive signal, indicating a potential price surge. Investors are optimistic about CYBERUSDT's future performance. The current price may be a buying opportunity. Reaching the target price would result in significant returns. CYBERUSDT is poised for a potential breakout and substantial gains.
Cyber IAP model. What next?BINANCE:CYBERUSDT
Recommend you check education idea about IAP model, how to analyse coins after listing
Possible Targets and explanation idea
➡️After IAP model on 4H we can see correction
➡️Correction will be to first target is Buy line on Take profit indicator
➡️This level also will be a test of D imb zone
➡️Correction can be even under fundamental price (last line) 2.99 / 2.30
Hope you enjoyed the content I created, You can support with your likes and comments this idea so more people can watch!
✅Disclaimer: Please be aware of the risks involved in trading. This idea was made for educational purposes only not for financial Investment Purposes.
---
• Look at my ideas about interesting altcoins in the related section down below ↓
• For more ideas please hit "Like" and "Follow"!

#CYBER (SPOT) IN ( 2.600- 3.100) T.(12.000) SL(2.557)BINANCE:CYBERUSDT
#CYBER/ USDT
Entry( 2.600- 3.100)
SL 1D close below 2.557
T1 5.200
T2 6.800
T3 9.000
T4 12.000
______________________________________________________________
Golden Advices.
********************
* collect the coin slowly in the entry range.
* Please calculate your losses before the entry.
* Do not enter any trade you find it not suitable for you.
* No FOMO - No Rush , it is a long journey.
Useful Tags.
****************
My total posts
www.tradingview.com
**********************************************************************************************
#Manta #OMNI #DYM #AI #IO #XAI #ACE #NFP #RAD #WLD #ORDI #BLUR #SUI #VOXEL #AEVO #VITE #APE #RDNT #FLUX #NMR #VANRY #TRB #HBAR #DGB #XEC #ERN #ALT #IO #ACA #HIVE #ASTR #ARDR #PIXEL #LTO #AERGO #SCRT #ATA #HOOK #FLOW #KSM #HFT #MINA #DATA #SC #JOE #RDNT #IQ #CFX #BICO #CTSI #KMD #FXS #DEGO #FORTH #AST #PORTAL #CYBER #RIF #ENJ #ZIL #APT #GALA #STEEM #ONE #LINK #NTRN #COTI #RENDER #ICX #IMX #ALICE #PYR #PORTAL #GRT #GMT #IDEX #NEAR #ICP #ETH #QTUM #VET #QNT #API3 #BURGER #MOVR #SKL #BAND #ETHFI #SAND #IOTX #T #GTC #PDA #GMX #REZ #DUSK #BNX #SPELL #POWR #JOE #TIA #TFUEL #HOT #AVAX #WAXP #OGN #AXS #GALA #ONE #SYS #SCRT #DGB #LIT #QI #FIL #GLMR #ATOM #LTC #MANA #ONT #TLM #SLP #ROSE #NEO #EGLD
