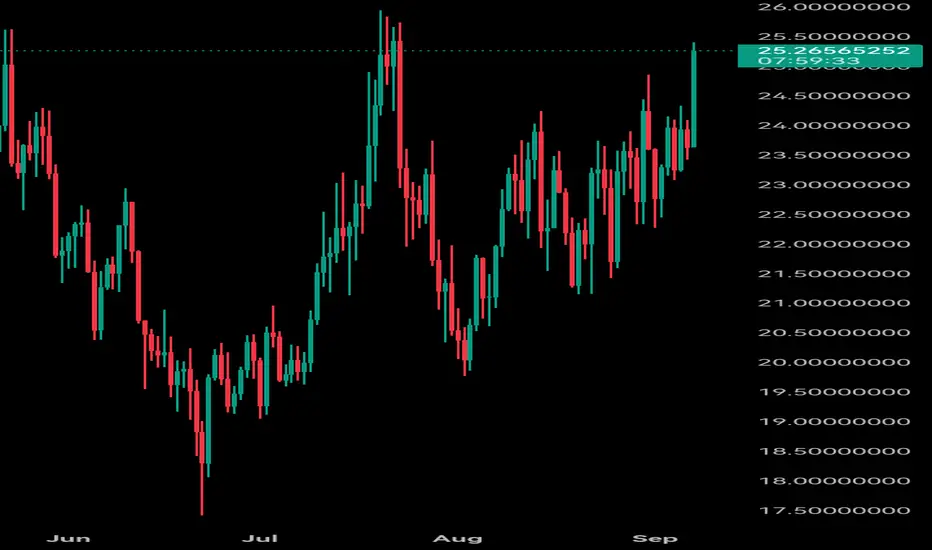
Bulls Spring the Bear Trap at $23 SupportThe Market Participant Battle:
Bulls have successfully trapped aggressive bears at the $23 support level, creating a powerful spring formation after sellers exhausted themselves pushing price down from $26. With bears now caught offside after failing to break critical support despite multiple attempts, price is coiling for a reversal back toward $26-27 as trapped shorts are forced to cover their positions.
Confluences:
Confluence 1: Channel Support Spring with Hidden Bullish Divergence
The 8-hour chart shows a textbook spring pattern where price touched the lower channel boundary at point 4 ($23.39), creating a false breakdown that trapped late sellers. The RSI and MFI both show hidden bullish divergence at this level - price made a higher low while oscillators made lower lows, confirming internal strength. The fact that price immediately rejected this level and closed back inside the channel signals bears have lost control. Additionally, both OBV and CDV maintain uptrends while breaking their own downtrend lines, showing accumulation despite the price pullback.
Confluence 2: Major Pitchfork and Deviation Band Rejection
Multiple technical tools converge at the $23.39 level: Andrews Pitchfork outer median line provided perfect support, VWAP 2nd deviation acted as a floor before price snapped back above the 1st deviation, and the linear regression channel shows price bouncing from its 2nd standard deviation. This triple confluence of dynamic support levels creates an extremely high-probability reversal zone. The numbered pattern (1-3 progression with 4 as the spring) confirms that when price closes above point 1, point 2 becomes validated as a major low.
Web Research Findings:
- Technical Analysis: TradingView analysis shows DASH technical ratings as "strong buy" today , with oscillators showing neutral and moving averages showing strong sell
- Recent News/Earnings: DASH faces regulatory challenges with Bybit delisting in March 2025 , but community sentiment remains bullish despite 6.7% weekly decline
- Analyst Sentiment: Multiple analysts noting support between $20-21 USD with safe entry above $21
- Data Releases & Economic Calendar: Fed decision today at September 17, 2025 with 93% chance of 25 basis point cut according to CME FedWatch
- Interest Rate Impact: Lower fed funds rate makes it easier for money to flow through economy, helping boost markets with declining interest rates typically resulting in higher crypto prices
Layman's Summary:
Think of this trade like a rubber band that's been stretched too far - bears pushed price down hard but couldn't break the critical $23 level. Now they're trapped because they bet on further downside that isn't coming. Today's likely Fed rate cut could be the catalyst that sends trapped bears scrambling to exit, pushing price higher. The technical setup shows multiple reliable indicators all pointing to the same reversal zone, like having three different GPS systems all confirming you've reached your destination.
Machine Derived Information:
- Image 1: 8H chart showing numbered wave pattern with RSI/MFI divergences - Significance: Confirms spring pattern completion at point 4 with hidden bullish divergence across multiple oscillators - AGREES ✔
- Image 2: Clean 8H chart highlighting channel structure - Significance: Shows clear respect of ascending channel boundaries with point 4 touching lower support - AGREES ✔
- Image 3: Volume footprint analysis with POC levels - Significance: Reveals bullish POCs providing support and potential upside targets if price closes above horizontally stacked levels - AGREES ✔
Actionable Machine Summary:
All three charts confirm the same story: bears pushed too hard into a major support confluence and are now trapped. The volume footprint shows buyers defending key POC levels, the channel structure remains intact despite the test, and momentum indicators flash reversal signals. When multiple independent analysis methods reach the same conclusion, probability shifts heavily in favor of the predicted move. Action: Enter longs at current levels with stops below $22.78.
Conclusion:
Trade Prediction: SUCCESS
Confidence: High
The convergence of trapped bears at major support, hidden bullish divergence, intact channel structure, bullish volume POCs, and potential Fed rate cut catalyst creates an exceptionally high-probability reversal setup. Risk/reward favors aggressive long entries with tight stops below the spring low.
Market insights

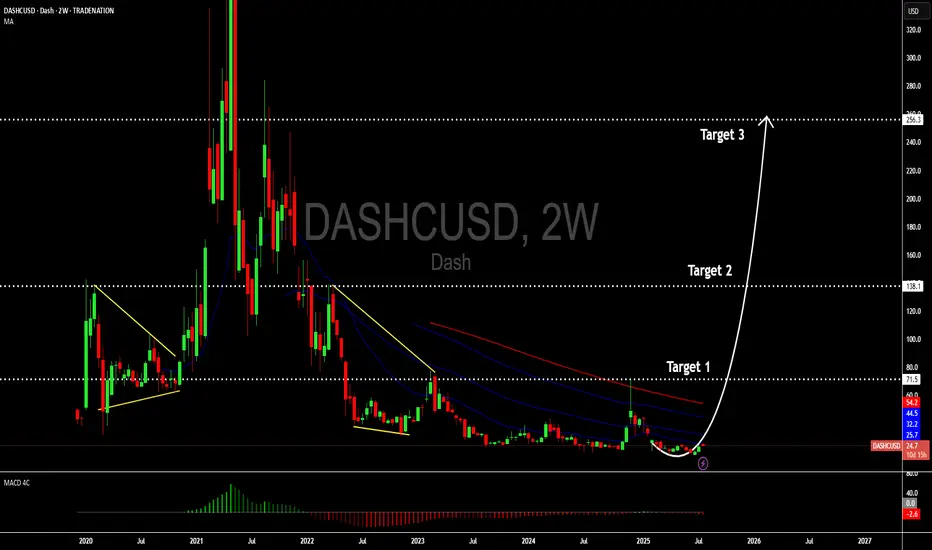
Dash re-entering a major long-term uptrendSeems Dash is re-entering a major long-term uptrend, aligned with historical cyclicality of crypto.
Dash has Fixed supply and scarcity that can work in bull markets, and was among the first to pioneer fast payments, governance treasury, masternodes — features that newer projects have rebranded.
According to Dash, the Annual inflation is ~3.5% in 2025. It started much higher (~10%+ in early years) and it declines automatically every year by ~7.14%.
If Dash reclaims a role in payments or privacy niches, a move into the multi-billion market cap range is possible (comparable to Solana-sized cap at extreme levels).
Fib retracements provide clear target zones:
- First milestones: $142 → $301 → $460
- Breakout targets: $718 → $1,550
- Ultimate extension long-term: $11,000 - $15,100
Dash today is niche, with weaker adoption compared to Solana, or ETH. But if “payments coins” narrative revives (or Dash pivots with new adoption), the upside is indeed asymmetric.
Potential Risks:
Adoption: Stablecoins + fast L1s (Solana, Tron) already dominate payments.
Liquidity: Market cap is tiny and whales can move price sharply.
Regulatory: Dash’s privacy features sometimes face exchange delistings.
Published for informational and educational purposes only, not financial advice, investment advice, or tax advice.

DASHUSD Double Top - Further evidenceThe Fib 3.618 extension on the log scale aligns with the double top target
GL ALL
Not financial advice
Just subsets of a more intricate system that we we do not have the tools to map fully

DASH is currently testing the $30.5 support level after breakingDASH is currently testing the $30.5 support level after breaking below the 50-day moving average. Trading volume remains subdued, indicating weak buying interest. The next critical support lies at the $28.7 former swing low.
RSI readings hover near 40, reflecting bearish momentum without reaching oversold conditions. MACD shows bearish crossover below zero line, though the histogram shows slight convergence, suggesting potential slowing selling pressure.
The $32.8 level now serves as immediate resistance, with stronger resistance at the $35.2 Fibonacci retracement level. Given current market sentiment and technical structure, DASH appears vulnerable to further downside unless reclaiming the $32.8 resistance. Monitor Bitcoin's movement for directional cues.
Dash Can Be BottomingDash Can Be Bottoming, as we see it recovering out of a downward channel, which indicates for a bullish reversal by Elliott wave theory.
Cryptocurrency Dash with ticker DSHUSD is recovering from June lows out of the downtrend channel, which suggests that the impulsive decline from the 2024 highs is bottoming, as shown on the daily chart. Currently we can see it forming a bullish setup formation with waves A/1 and B/2 that can send the price higher within wave C or wave 3 of a five-wave bullish impulse. Wave C has room up to 26-30 area, but if if breaks above 31 bullish confirmation level, then we can start tracking wave 3 of a five-wave bullish impulse.
Dash is a cryptocurrency launched in 2014 that focuses on fast, low-cost payments and privacy. It uses a two-tier network with miners and “masternodes” to enable features like InstantSend (near-instant transactions) and PrivateSend (optional privacy). It started as a fork of Bitcoin.

Dash RocketDash has been in a bearish trend for some time now, but it has stood the test of time being one of the OG coins of the market with this double bottom within this descending channel on the daily and a retest of demand I believe this coin will see $50 soon.
It’s master node runners and minors have kept the chain going, and we should be breaking its bearishness very soon.

Investing in Cryptocurrencies in the current environmentDear Investors,
The cryptocurrency market has experienced significant activity over the past week, with major cryptocurrencies such as Bitcoin and Ethereum reaching all-time highs. However, many alternative coins (altcoins) have yet to follow suit, presenting potential opportunities for strategic investors. This divergence is partly attributed to recent developments in U.S. regulatory efforts, particularly discussions around stablecoin legislation. The signed regulatory framework (Genius act) for stablecoins is viewed as a positive step for the broader crypto industry, as it could foster greater institutional adoption and market stability. Notably, President Trump’s administration has signaled a crypto-friendly stance, which has bolstered market sentiment and contributed to the bullish momentum.
While the surge in top-tier cryptocurrencies is exciting, we caution investors against succumbing to FOMO (Fear of Missing Out) by chasing assets that have already seen significant price increases. Instead, consider reallocating capital toward undervalued altcoins with strong fundamentals, such as Dashcoin, which may offer attractive risk-reward profiles in the current market cycle.
Disclosure: I am part of Trade Nation's Influencer program and receive a monthly fee for using their TradingView charts in my analysis.
70,000% Hit on 1.618fib?DASH is repeating a breakout of a massive pennant and WAVE 1 has NOT even formed.
DASH has a 70,000% upside from these levels
Will DASH hit the 1.618fib at $17,000 in 2026 maybe 2025?

DASH - Invert to remove BIASDouble top (or bottom on inverse chart) is due, then off to zero
Not financial advice. Can be negated but just a potential path if this is the finalé

DASHUSD: A buy opportunity for patient investorsHello,
This crypto is also trading close to its all-time low levels. We see this as a perfect area for long term/medium term investors to enter their positions since we are now close to zero in terms of price for this crypto.
Additionally, there is also a bullish zero crossover on the MACD indicator telling us that the long consolidation may be coming to a close as more investors seek opportunities in alternative coins.
Dash is an open source blockchain and cryptocurrency focused on offering a fast, cheap global payments network that is decentralized in nature. According to the project's white paper, Dash seeks to improve upon Bitcoin (BTC) by providing stronger privacy and faster transactions.
Disclosure: I am part of Trade Nation's Influencer program and receive a monthly fee for using their TradingView charts in my analysis.

DASH - Insane upsideI expect new ATHs to be reached at minimum
Not financial advice.
Double top potential

DASH Long-term perspectives in three potential bullish cycles. How much does a full day today so we will be home tomorrow and then we will go home tomorrow morning I can tomorrow

DASHCUSD: A good coin to buy at the bottom.Hello,
Dash is designed to be the most user-friendly and scalable cryptocurrency for payments. It offers instant transactions, enhanced privacy options, and a self-governing, decentralized model powered by masternodes.
Key features include:
InstantSend – Near-instant transactions for seamless payments.
CoinJoin – Advanced privacy features to keep transactions confidential.
ChainLocks – Robust security against 51% attacks, ensuring network integrity.
From a technical perspective, Dash is currently trading at historical lows, presenting a strong opportunity for investors with a higher risk tolerance. With a medium-term target of $70, Dash holds significant upside potential for long-term growth.
Now might be an opportune moment to position yourself before momentum shifts upward.
Disclosure: I am part of Trade Nation's Influencer program and receive a monthly fee for using their TradingView charts in my analysis.

DASH Stock Chart Fibonacci Analysis 021925Trading Idea
1) Find a FIBO slingshot
2) Check FIBO 61.80% level
3) Entry Point > 26.3/61.80%
Chart time frame: B
A) 15 min(1W-3M)
B) 1 hr(3M-6M)
C) 4 hr(6M-1year)
D) 1 day(1-3years)
Stock progress: A
A) Keep rising over 61.80% resistance
B) 61.80% resistance
C) 61.80% support
D) Hit the bottom
E) Hit the top
Stocks rise as they rise from support and fall from resistance. Our goal is to find a low support point and enter. It can be referred to as buying at the pullback point. The pullback point can be found with a Fibonacci extension of 61.80%. This is a step to find entry level. 1) Find a triangle (Fibonacci Speed Fan Line) that connects the high (resistance) and low (support) points of the stock in progress, where it is continuously expressed as a Slingshot, 2) and create a Fibonacci extension level for the first rising wave from the start point of slingshot pattern.
When the current price goes over 61.80% level , that can be a good entry point, especially if the SMA 100 and 200 curves are gathered together at 61.80%, it is a very good entry point.
As a great help, tradingview provides these Fibonacci speed fan lines and extension levels with ease. So if you use the Fibonacci fan line, the extension level, and the SMA 100/200 curve well, you can find an entry point for the stock market. At least you have to enter at this low point to avoid trading failure, and if you are skilled at entering this low point, with fibonacci6180 technique, your reading skill to chart will be greatly improved.
If you want to do day trading, please set the time frame to 5 minutes or 15 minutes, and you will see many of the low point of rising stocks.
If want to prefer long term range trading, you can set the time frame to 1 hr or 1 day.

DASH - Keeping it simpleI am not even going to put any projected moves on my 1D Chart. This token has been one of the trickiest I have ever traded. I am just keeping it simple and hopefully it has finally broken out of this recent descending wedge pattern. Maybe a retrace to 20.00 zone before the very long awaited breakout? Love the technology of the coin and low max supply. Maybe capital will flow back into DASH if/when BTC corrects. Comments and help please on this one!

This looks aightAm i missing something here. Looks ripe. I'd rather buy 1k of this than toss 1k to trash.

Has Dash's 7-Year Correction Come to an End? (+5000% Potential)It has been a very long and arduous journey for Dash holders, however, it may be time for a reversal. According to this specific Elliott Wave count, Dash may experience a fruitful time ahead with a growth potential of 5000%.
Let's see how it goes.
Good luck.

The DASH train has ALREADY LEFT the station!I'm going to link to my previous DASH idea where I was patiently awaiting DASH to leave the bullish falling wedge, re-test it from the top, and then fly off. But it turns out I was WRONG. DASH has already left the station for its next parabolic move.
Here's a slightly different way of charting the falling wedge. It's valid too! The difference is that the B wave has a price action overthrow. Why is it an overthrow? B typically retraces to 50% of wave A but here it's retraced to more than 65%. That's where I concluded there's an overthrow. It means the top of the wedge needs to come slightly down towards the real price action. What does this all mean?!? It means that right now we're not dealing with a rejection at the top of A re-test from the top down. In other words, we're well past the construct of the falling wedge and DASH is about to go parabolic starting this month!

DASHUSDTRisk warning, disclaimer: the above is a personal market judgment based on published information and historical chart data on Tradingview, all analysis is only subjective. Hope investors consider, that I am not responsible for your investment decision.
Thank you.
Good luck

DASHUSD Sentiment: Neutral with Bullish BiasHello,
The current sentiment around COINBASE:DASHUSD is mixed as it is hovering just below the 1-year pivot point. If it fails to establish itself above this level, there could be a downside movement again. As of now, the trend remains bullish, making the likelihood of bullish momentum higher than bearish. We're awaiting confirmation for either an upward or downward move.
No Nonsense. Just Really Good Market Insights. Leave a Boost
TradeWithTheTrend3344

DASHUSD: Bearish Outlook Below 1M PPHello,
COINBASE:DASHUSD has encountered support at the 1M PP and recently faced rejection at the 1Y PP. If the price breaks below the 1M PP and sustains below it, a further downside movement is likely.
No Nonsense. Just Really Good Market Insights. Leave a Boost
TradeWithTheTrend3344

DASH After 7 Years of Stagnation: Powerful C Wave Breakout BeginHi guys! 🌟
Today, we have an exciting analysis of DASH. After a long and exhausting 7-year correction, it seems that DASH is beginning a powerful upward movement in the form of Wave C.
🔑 Wave A started in 2014 at $0.20 and reached its all-time high of $1625 in December 2017. Then, Wave B began a correction, with the price dropping to $19, which occurred in August 2024. This 7-year correction is a 50% retracement from the all-time high, making it a golden opportunity for a discounted entry at this level. This correction indicates a return to half of the all-time high, providing a perfect entry point.
📊 At the end of Wave B, a descending wedge pattern formed, signaling the end of the correction and the beginning of a new upward trend. After breaking the $40 level and pulling back to this level, a confirmation for market entry was made.
🚀 Wave C is now starting from the $19 low in August 2024 and has the potential to push DASH to new heights. Two major resistances are in front of us:
Resistance at $75: A break above this level could start a risky entry into the market.
Descending trendline resistance: This line is formed from the all-time highs of $1625 in December 2017 and $477 in May 2021. A break of this trendline provides a stronger confirmation for entry and more upward movement.
🔮 Targets:
🎯 $400 (430% profit)
🎯 $1700 (2100% profit)
DASH is on the verge of a massive breakout! 🚀

DASHUSD Testing 1Y Pivot: Bullish or Bearish?Hello,
COINBASE:DASHUSD is currently testing the 1-year pivot point (PP). Whether this level acts as support or resistance will determine if we see a bullish continuation or further bearish movement. While most market sentiment leans toward a bearish continuation, the price has found significant support around the 1-year PP so far.
No Nonsense. Just Really Good Market Insights. Leave a Boost
TradeWithTheTrend3344
