US30 Testing the Pivot Before Next MoveUS30 – Technical Overview
The Dow Jones (US30) gained 1.1% after the Fed’s rate cut, pushing the index within 200 points of a new all-time high. Futures later turned slightly positive, with US30 outperforming Nasdaq and S&P 500 despite weakness in tech.
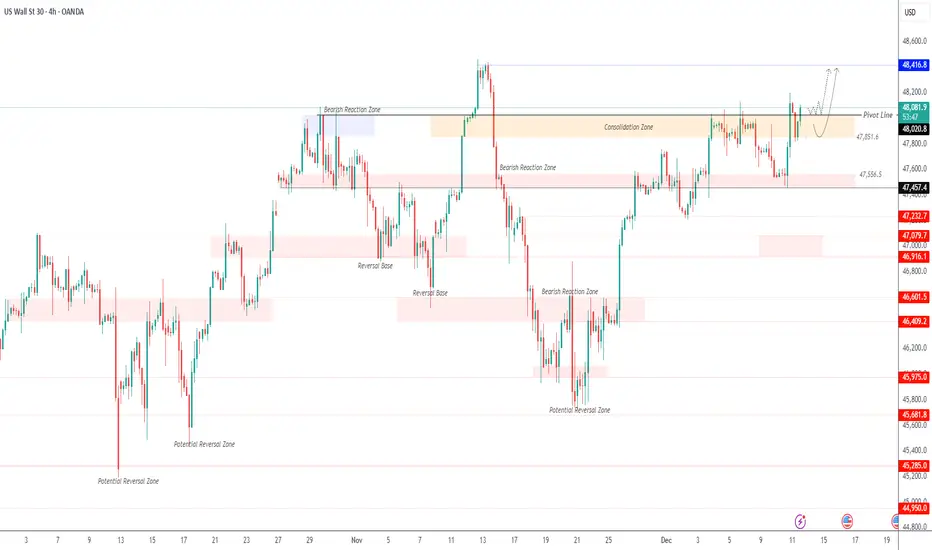
US30 is attempting to stabilize above the 48020 pivot line. A breakout above this level on a 4H close would support a move toward the previous all-time high at 48415.
A correction remains possible toward the pivot or slightly below it, with 47850 acting as a key pullback level before any renewed bullish momentum.
A 4H break below 47850 would confirm bearish pressure toward 47560 and 47460.
Pivot: 48020
Resistance: 48415 · 48690
Support: 47850 · 47560 · 47460
Dow Jones Industrial Average Index
No trades
Market insights
Could we see a drop from here?US30 is reacting off the resistance level, which is a pullback resistance, and could drop from this level to our take-profit.
Entry: 48,501.17
Why we like it:
There is a pullback resistance level.
Stop loss: 48,912.89
Why we like it:
There is a swing high resistance level.
Take profit: 47,943.36
Why we like it:
There is an overlap support level
Enjoying your TradingView experience? Review us!
Please be advised that the information presented on TradingView is provided to Vantage (‘Vantage Global Limited’, ‘we’) by a third-party provider (‘Everest Fortune Group’). Please be reminded that you are solely responsible for the trading decisions on your account. There is a very high degree of risk involved in trading. Any information and/or content is intended entirely for research, educational and informational purposes only and does not constitute investment or consultation advice or investment strategy. The information is not tailored to the investment needs of any specific person and therefore does not involve a consideration of any of the investment objectives, financial situation or needs of any viewer that may receive it. Kindly also note that past performance is not a reliable indicator of future results. Actual results may differ materially from those anticipated in forward-looking or past performance statements. We assume no liability as to the accuracy or completeness of any of the information and/or content provided herein and the Company cannot be held responsible for any omission, mistake nor for any loss or damage including without limitation to any loss of profit which may arise from reliance on any information supplied by Everest Fortune Group.

DOW/US30 - OVER BOUGHT Team, I hope you recall the trade last 3 days ago about OPPORTUNITY OF BEAUTIFUL CHART
Since then, it has been running up over 1400 points in 3 days.
Now I find myself in a good time to SHORT, with 3-4 confluences to make that decision.
1- 1400 points up in 3 days, (2 days up because of RATE cut)
2 - Daily chart indicates overbought
3 - NEW ATH
Therefore, we expect a small retracement.
SHORT range at 48787 - 48850 - STOP LOSS above 50050
Target 1 at 48715-48650
Target 2 at 48600-48550
Target 3 at 48412-48350
LETS GO

US30 | Markets Brace for Fed Rate Cut DecisionUS30 – Technical Overview
Wall Street futures edged higher on Monday as traders prepared for one of the most closely watched—and divisive—Federal Reserve meetings in recent years.
Markets widely expect the Fed to deliver its long-awaited interest rate cut this week.
Last week’s delayed data showed moderate growth in consumer spending late in Q3, further boosting confidence that policymakers may prioritize supporting the labor market and reducing borrowing costs.
Technical Analysis
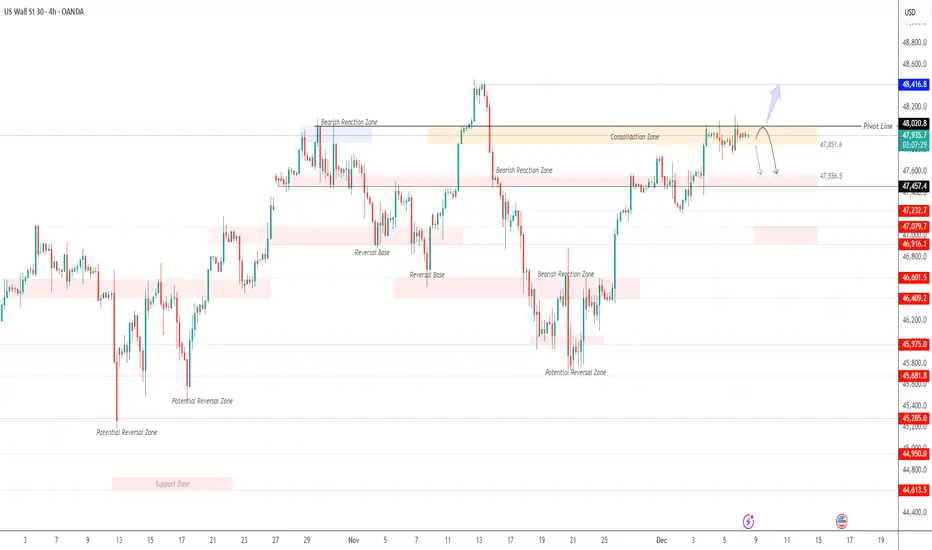
US30 continues to trade below 48020, indicating that bearish momentum remains in control.
As long as price stays under this level, the index is expected to move toward 47770 and 47460, with 47560 acting as an intermediate support.
A bullish reversal requires a 1H candle close above 48020, which would confirm a shift in momentum and open the way toward 48410 and potentially the ATH region.
Key Levels
Pivot Line: 48020
Support: 47770 · 47560 · 47460
Resistance: 48300 · 48410
US30 Technical Breakdown – 12/11/2025📍 US30 Technical Breakdown – 12/11/2025
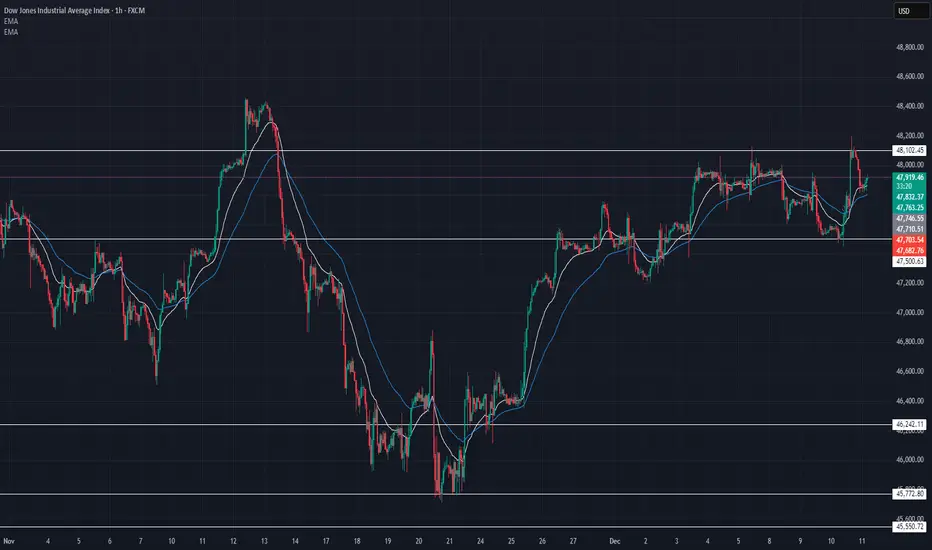
US30 rejected sharply from the 48,100–48,200 resistance zone, creating a clean wick rejection before pulling back into the mid-range. Despite the selloff, the broader structure remains bullish as long as price holds above 47,700, but momentum has clearly cooled with EMAs flattening out 🔍📉.
📊 Market Behavior:
🔹 Strong rejection from 48,150 — sellers defending heavy supply
🔹 EMAs tightening → momentum slowing after the push
🔹 Price stuck in a wide consolidation between 47,700–48,150
🔹 Bulls still defending higher-timeframe structure
📌 Key Levels:
🔹 Resistance:
48,150 → major supply / rejection zone
48,000 → intraday reaction level
47,930 → current retest zone
🔹 Support:
47,700 → immediate support (key for trend continuation)
47,500 → deeper intraday demand
46,960 → strong structural support if market breaks down
🧠 Bias:
Neutral-to-bullish above 47,700 📈
📈 Break & close above 48,150 → opens path to 48,300 → 48,500
📉 Lose 47,700 → downside opens toward 47,500 → 47,000
💡 Trade Ideas:
🔹 Bullish Setup:
Entry: 48,020 (break + retest above resistance)
TP1: 48,180
TP2: 48,320
SL: 47,820
🔹 Bearish Setup:
Entry: 47,680 (loss of support)
TP1: 47,500
TP2: 47,300
SL: 47,850
🎯 Summary:
US30 rejected the 48,100 resistance zone and is now rotating back toward support. Bulls remain in control on the higher timeframe, but short-term momentum has slowed. Watch 47,700 closely — hold = continuation, break = correction 🔥📊
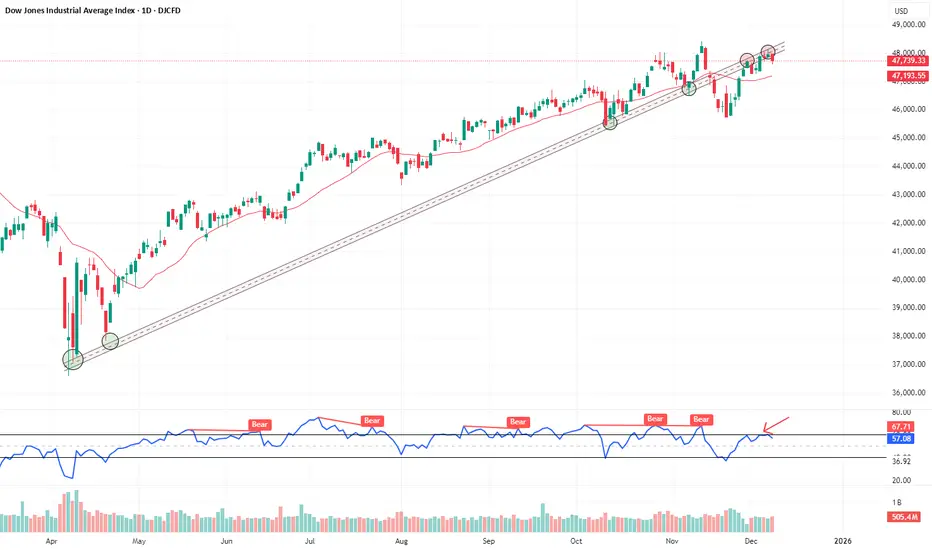
DOW JONES DAILY CHART ANALYSISClear trendline role reversal in play — previous support now acting as strong resistance📉
Price rejection seen near:
🔹 Trendline resistance
🔹 RSI bearish range shift (marked by repeated failures to cross 60)
🔹 Fib 0.786 retracement zone (not shown in chart)
All confluences suggest a potential pause or short-term pullback unless price breaks out with strong volume.
SELLS ON US30SELLS on us30. we're currently at all time high. i saw a shift in momentum from buy to sell as indicated by the sell H2 time frame candle in black . i dont expect this short to work though as we are on all time highs
US30

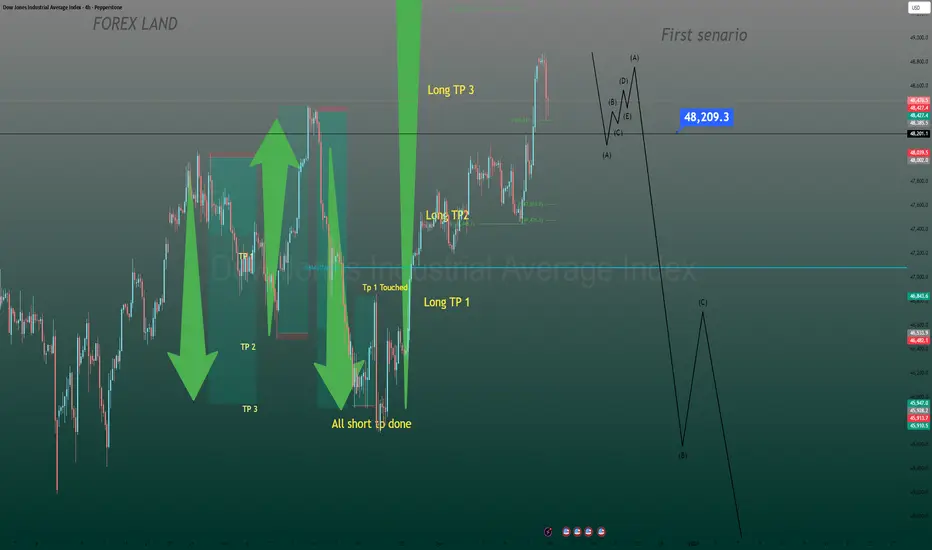
Dow Jones Is About to Show Its Hand This WeekIn my view, the market is about to show its hand this week, and this could open the door for another round of strong, high-quality trades.
The 48,209 level is extremely important for me.
If price moves below this level, the scenario becomes very clear — from that point on, I’ll be focused only on short positions.
For now, I’m closely monitoring how the market reacts around this zone.
I’ll share the second scenario in the next post.
US30 UPDATE📈 US30 UPDATE — Levels on Watch!
Price is reacting around an important zone, and this setup could get interesting from here 👀🔥
🔓 Entry Level: 48,467
❌ Stop Loss: 48,174
🎯 Target: 48,727
Market reaction at this level will be key. If momentum builds, price may extend toward the target zone, while risk remains defined below the stop.
What’s your take on US30 from here?
Bullish or bearish?
Share your thoughts below — let’s get a discussion going! ⬇️💬🔥
Your like/support helps this reach more traders 👍
Disclaimer: This is not financial advice; it reflects only my personal market analysis. Please do your own research before trading.

Dow Jones at the Top: It's Time to Return!Like any upward movement, this one is about to end. Potentially, we are at the top or we are near the top.

US30 Trade Set Up Dec 11 2025Price is making HH/HL so now in a bullish trend but it currently at a supply and approaching PDH so if it sweeps it i will look for internal IFVG/CISD to target Asia lows before continuing a bullish trend but if price closes above PDH price can go higher to BSL and higher supply

Dow Jones Rebound Ahead! Buy!
Hello,Traders!
US30 has reacted strongly from a well-defined horizontal demand area, confirming smart money accumulation. Bullish displacement broke prior structure, leaving inefficiencies below. Continuation toward resting buy-side liquidity and higher targets is favored. Time Frame 5H.
Buy!
Comment and subscribe to help us grow!
Check out other forecasts below too!
Disclosure: I am part of Trade Nation's Influencer program and receive a monthly fee for using their TradingView charts in my analysis.

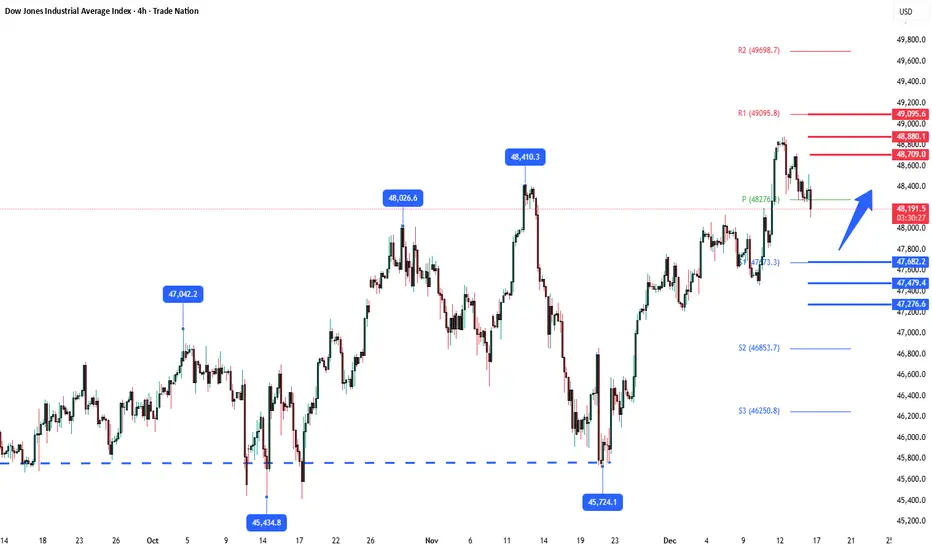
DowJones Key Trading LevelsKey Support and Resistance Levels
Resistance Level 1: 48710
Resistance Level 2: 48880
Resistance Level 3: 49100
Support Level 1: 47680
Support Level 2: 47480
Support Level 3: 47280
This communication is for informational purposes only and should not be viewed as any form of recommendation as to a particular course of action or as investment advice. It is not intended as an offer or solicitation for the purchase or sale of any financial instrument or as an official confirmation of any transaction. Opinions, estimates and assumptions expressed herein are made as of the date of this communication and are subject to change without notice. This communication has been prepared based upon information, including market prices, data and other information, believed to be reliable; however, Trade Nation does not warrant its completeness or accuracy. All market prices and market data contained in or attached to this communication are indicative and subject to change without notice.
US30 | ANALYSIS📊 US30 Update — Key Structure Levels Active
US30 is trading around an important structure zone where buyers have shown strength before. As long as price holds above support, bullish momentum remains valid, with potential continuation toward the next resistance area.
🔓 Entry: 48,395
❌ Stop Loss: 48,192
🎯 Target: 48,627
Price action around these levels will be crucial for confirmation.
Do you expect continuation or a short-term pullback from here? Drop your bias below 👇
Your like/support helps this idea reach more traders 🚀
⚠️ Disclaimer: This post reflects personal market analysis and is not financial advice.

US30 Trade Set Up Dec 15 2025Price made a new ATH last week and has left a daily gap below which i will expect price to fill this week before continuing higher. So for now price is trading within a bearish 4h FVG, approaching 1h supply and has swept both Asia and London highs so i will wait and see if price makes internal 1m-5m CISD/IFVG to reverse down to Asia lows and PDL

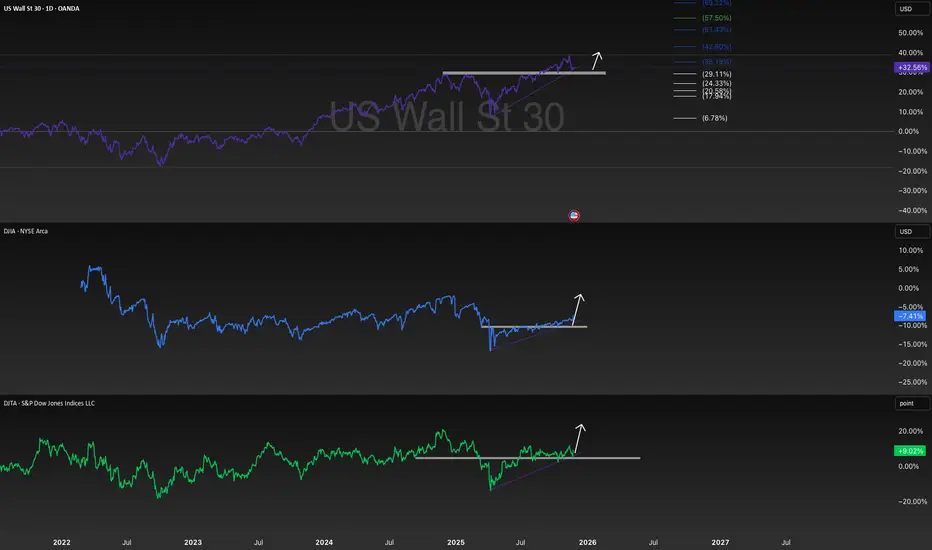
Technical Analysis: US Indices Continuation PatternsTechnical Analysis: US Indices Continuation Patterns 📈
Based on the provided chart, which displays the US Wall St 30 (Dow Jones Industrial Average CFD), the DJI (Dow Jones Industrial Average), and the DJTA (Dow Jones Transportation Average), a clear technical pattern suggests a continuation of the bullish trend across all three indices.
1. Pattern Identification: Ascending Triangles
The dominant chart pattern observed across the US Wall St 30, the DJI, and the DJTA is the Ascending Triangle formation.
Structure: This is a bullish continuation pattern characterized by a relatively flat horizontal resistance line (the highs) and a rising lower trendline (the lows).
Interpretation: The horizontal resistance indicates a level where selling pressure is persistent. The rising lower trendline, connecting progressively higher lows, demonstrates that buyers are becoming more aggressive over time, consistently stepping in to buy at higher prices. This indicates a buildup of buying pressure (accumulation) beneath the resistance level.
Resolution: The pattern is confirmed upon a decisive breakout above the horizontal resistance line, signaling that the buyers have finally overwhelmed the sellers and the prior uptrend is set to continue. The chart illustrates a potential breakout phase for all three indices, indicated by the upward arrows extending from the apex of the triangles.
2. Validation of Dow Theory Conditions
The relationship between the Dow Jones Industrial Average (DJI) and the Dow Jones Transportation Average (DJTA) is a key component of Dow Theory. The theory posits that for a major trend to be confirmed, both the Industrial and Transportation averages must move in the same direction.
Condition: An advance in the Industrial Average must be accompanied by a corresponding advance in the Transportation Average.
Chart Evidence:
DJI (Dow Jones Industrial Average): Shows the formation of a clear ascending triangle pattern, indicating an expected move to the upside (continuation of the uptrend).
DJTA (Dow Jones Transportation Average): Displays a very similar and concurrent ascending triangle pattern, also forecasting a move to the upside.
Conclusion: Since both the DJI and DJTA are exhibiting simultaneous, strong bullish continuation patterns (Ascending Triangles) and are currently posturing for a coordinated upward breakout, the charts provide a powerful confirmation of the primary bullish trend as per the requirements of Dow Theory. The technical setup across the major averages is congruent, strengthening the bullish thesis for the broader US market.
3. Price Targets and Confluence
The traditional method for setting a price target following an ascending triangle breakout is to measure the height of the back of the triangle (the widest part) and project that distance vertically from the point of the breakout.
US Wall St 30 (Top Panel):
The recent consolidation phase (Ascending Triangle) is preceded by a strong multi-year uptrend.
Fibonacci extension levels are marked above the resistance, which act as potential price targets following a breakout: 15.72% and 19.34% are visible targets, indicating a significant expected price movement upon confirmation.
The consolidation is occurring near recent all-time highs, suggesting a period of accumulation before the next leg higher.
Summary and Outlook
The technical analysis strongly supports a bullish continuation outlook for the indices. The presence of the Ascending Triangle continuation pattern on all three major US averages, coupled with the alignment of the DJI and DJTA, provides robust confirmation of the overall primary uptrend as per Dow Theory. A definitive breakout above the horizontal resistance lines would trigger the next major move higher, with price targets set by the measured move of the pattern and confirmed by the visible Fibonacci extension levels.
Disclaimer: This analysis is based solely on the provided chart and established technical analysis principles. It is for informational and educational purposes only and does not constitute investment advice. Trading involves substantial risk, and professional advice should be sought before making any investment decisions.
DowJones (DJI) IntraSwing Level for 11th - 12th Dec '25(2:30 amFED Rate Cut impact in Indian Financial Market:
Trading approach in NSE BSE
For an Indian trader, Fed cuts with a dovish or balanced guidance usually support:
Short‑term long bias in Nifty/Sensex and high‑quality large caps as flows and sentiment improve.
Overweight stance on IT, financials, autos, and select cyclicals, while closely tracking FPI flow data, dollar index, and USDINR for confirmation
The US Federal Reserve has just delivered its third consecutive rate cut, taking the federal funds target range down to about 3.5%–3.75%, the lowest since 2022. It is also signaling that the pace of further cuts will likely slow, with only very limited easing projected over the next couple of years.
Latest Fed move
The Fed reduced rates by 25 basis points at its December 2025 meeting, following similar cuts in September and October. This “hawkish cut” pattern reflects concern about a softer labor market while still being cautious because inflation is only gradually moving toward the 2% target.
Future cut expectations
Fed projections currently point to only one additional cut in 2026 and another in 2027, implying a very shallow easing path compared with what markets had been pricing in. Officials have stressed that further moves will depend heavily on incoming data on inflation and employment, so the path is explicitly data‑dependent rather than pre‑committed.
Market and global impact
US equities initially rallied on the latest cut, as investors welcomed lower discount rates and a still‑decent growth outlook for 2026. For emerging markets like India, the lower Fed rate tends to ease pressure on the dollar, supports currencies, and can give local central banks more room to consider their own rate cuts if domestic inflation allows
[ Level Interpretation / description:
L#1: If the candle crossed & stays above the “Buy Gen”, it is treated / considered as Bullish bias.
L#2: Possibility / Probability of REVERSAL near RLB#1 & UBTgt
L#3: If the candle stays above “Sell Gen” but below “Buy Gen”, it is treated / considered as Sidewise. Aggressive Traders can take Long position near “Sell Gen” either retesting or crossed from Below & vice-versa i.e. can take Short position near “Buy Gen” either retesting or crossed downward from Above.
L#4: If the candle crossed & stays below the “Sell Gen”, it is treated / considered a Bearish bias.
L#5: Possibility / Probability of REVERSAL near RLS#1 & USTgt
HZB (Buy side) & HZS (Sell side) => Hurdle Zone,
*** Specialty of “HZB#1, HZB#2 HZS#1 & HZS#2” is Sidewise (behaviour in Nature)
Rest Plotted and Mentioned on Chart
Color code Used:
Green =. Positive bias.
Red =. Negative bias.
RED in Between Green means Trend Finder / Momentum Change
/ CYCLE Change and Vice Versa.
Notice One thing: HOW LEVELS are Working.
Use any Momentum Indicator / Oscillator or as you "USED to" to Take entry.
⚠️ DISCLAIMER:
The information, views, and ideas shared here are purely for educational and informational purposes only. They are not intended as investment advice or a recommendation to buy, sell, or hold any financial instruments. I am not a SEBI-registered financial adviser.
Trading and investing in the stock market involves risk, and you should do your own research and analysis. You are solely responsible for any decisions made based on this research.
"As HARD EARNED MONEY IS YOUR's, So DECISION SHOULD HAVE TO BE YOUR's".
Do comment if Helpful .
Do Comment for In depth Analysis.
Follow notification about periodical View

Bullish Setup for US30
We have bullish order flow on the 1M and 1W timeframes.
On the daily chart, we have a bullish high-probability leg with a clean FVG.
We took 4H $$ from the range, so we can potentially take sell-side liquidity before moving higher.
Stop: 4H SP(swing point) body
TP: ATH
RR: 1:2

DowJones key trading levelsKey Support and Resistance Levels
Resistance Level 1: 49000
Resistance Level 2: 49253
Resistance Level 3: 49600
Support Level 1: 48100
Support Level 2: 47870
Support Level 3: 47520
This communication is for informational purposes only and should not be viewed as any form of recommendation as to a particular course of action or as investment advice. It is not intended as an offer or solicitation for the purchase or sale of any financial instrument or as an official confirmation of any transaction. Opinions, estimates and assumptions expressed herein are made as of the date of this communication and are subject to change without notice. This communication has been prepared based upon information, including market prices, data and other information, believed to be reliable; however, Trade Nation does not warrant its completeness or accuracy. All market prices and market data contained in or attached to this communication are indicative and subject to change without notice.

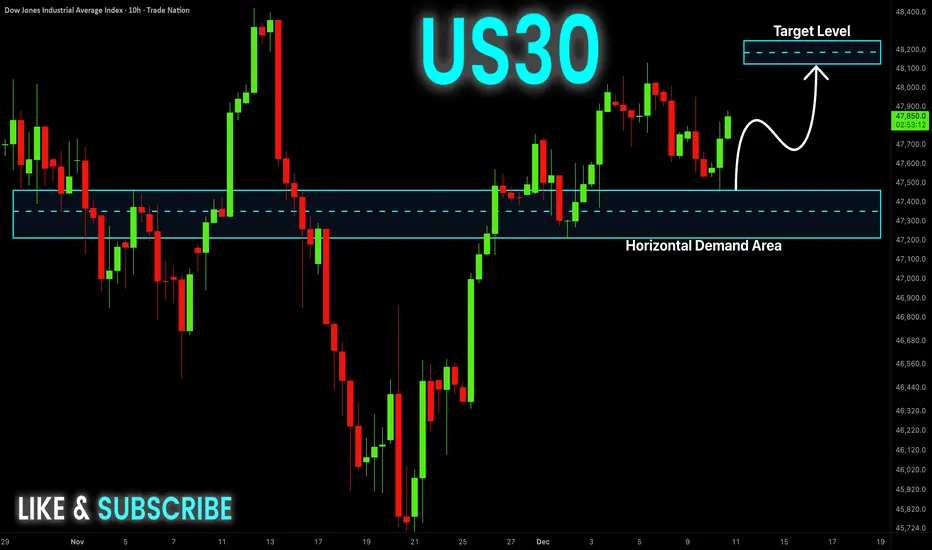
US30 Will Go UP! Buy!
Hello,Traders!
US30 has rebounded cleanly from the horizontal demand area after sweeping sell-side liquidity, confirming an SMC accumulation reaction that shifts order-flow bullish and draws price toward the next buy-side target above. Time Frame 10H.
Buy!
Comment and subscribe to help us grow!
Check out other forecasts below too!
Disclosure: I am part of Trade Nation's Influencer program and receive a monthly fee for using their TradingView charts in my analysis.
SHORT ON US30Us30 has created a head and shoulder pattern at a major supply area/zone.
FOMC is coming out in a few minutes and this could be a major catalyst to US30 falling.
Strictly going off technical's with the chart. Looking to make 1k-2k points.

US30 Trade Set Up Dec 17 2025Price is making LL/LH on the 1h and has swept Asia highs and filled 4h FVG so i will wait for internal 1m-5m IFVG/CISD to target PDL

US30 Consolidates Below Key Resistance as Bearish Pressure BuildUS30 – Technical Overview
The price reached our target at 48020 exactly and is now consolidating within the 48020–48420 range.
For now, the structure remains bearish while price trades below 48420 and 48270.
As long as the market stays under these levels, downside movement toward 48020 remains likely.
A deeper bearish continuation requires a 1H candle close below 47860, which would open the path toward: → 47560
On the other hand, a break and stabilization above 48420 would shift momentum to bullish, targeting: → 48700
Key Levels
Pivot Line: 48270
Support: 48020 · 47860 · 47560
Resistance: 48420 · 48700
