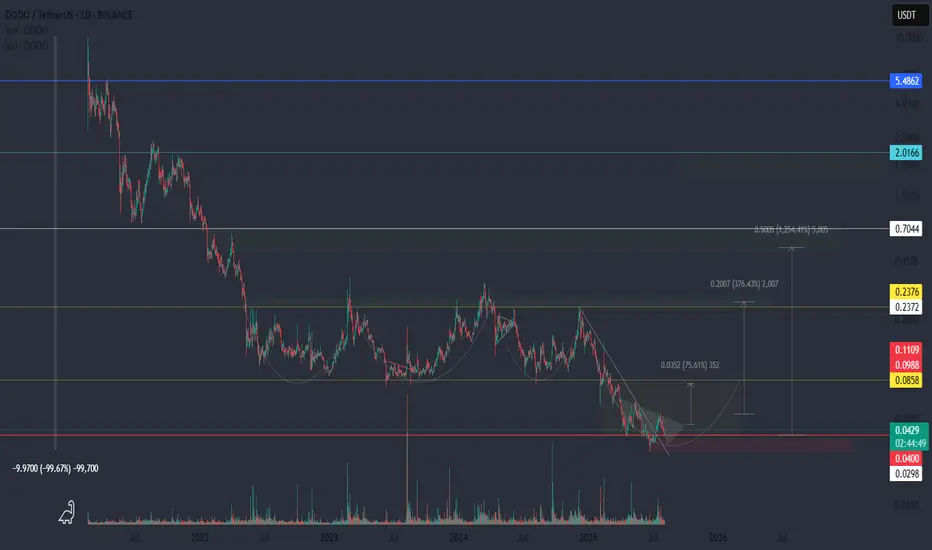
High-Risk Crypto Bet – DODO AnalysisDODO is a decentralized finance (#DeFi) protocol that has seen a brutal 99% drawdown from its peak — making it one of the most devalued tokens in the market.
📉 Structure:
The chart shows a “channel within a channel” structure — a signal of prolonged capitulation. DODO is currently in a range where
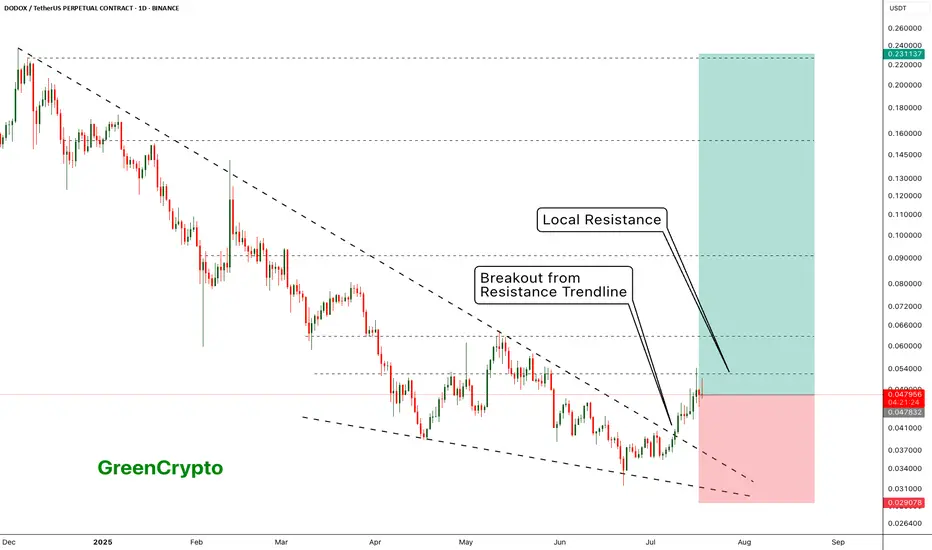
DODOX - Resistance is holding it back - Huge Potential- DODOX has successfully broken out from the resistance trendline
- Now its being pushed back back the weak local resistances
- I see a huge upward potential here.
Entry Price: 0.048271 ( Or you can wait for it breakout from the local resistance of 0.063051)
Stop Loss: 0.029078
TP1: 0.062621
TP2
Dodousdt decline continuesDODOUSDT has continued its downtrend, breaking below the key rectangular consolidation zone. With this breakdown confirmed, price is now heading toward the projected bearish box target.
The plan is to monitor this lower zone for potential accumulation, anticipating a recovery move back toward the up

DODO/USDT Approaching Major Breakout? End of a Long Downtrend?📊 In-Depth Analysis of DODO/USDT (1D Chart)
The DODO/USDT pair remains in a medium-to-long-term downtrend since late 2024. However, the current price action shows early signs of a potential reversal.
📐 Pattern and Structure
Downtrend Resistance Line: The descending yellow trendline from the Decem
Dodo usdtBuy 0.0395 - 0.0405
Sell: 0.042 - 0.043
STOP 0.0388
it's above on his resistance box.
taking support also.
Spot trade

dodo usdtBuy current price 0.0398
can sell in parts till 0.064
current prices are very less. it was even less since 2022
have some unlocking too from tomorrow but still in very cheap prices.

DODOUSDT 1D UpdateDODO ~ 1D Update
#DODO Buy gradually from here if you still have confidence in this coin with a short term target of at least 15%+ from here.

DODOUSDT 1D Analysis DODO ~ 1D Analysis
#DODO Buy after successfully breaking through this resistance line with a short-term target of at least 10%+.

Your Turn!DODO is deserved much more than this! Coins like DODO have doubled, so it may be its turn to pump hard. It is struggling with a descending trendline, which is really strong and has suppressed the price for about 5 months. If it could break it, ~$0.078 is an easy-peazy target!

DODO, Bitcoin, The Altcoins Market & Luxury BrandsI have a feeling that DODO will make a strong move soon. This is just a feeling, and somehow whenever I have this feeling the pair in question doesn't move but instead stalls... Well, it moves, they tend to move they just don't do so immediately. If one waits patiently results are awesome. Think lo

See all ideas
Summarizing what the indicators are suggesting.
Oscillators
Neutral
SellBuy
Strong sellStrong buy
Strong sellSellNeutralBuyStrong buy
Oscillators
Neutral
SellBuy
Strong sellStrong buy
Strong sellSellNeutralBuyStrong buy
Summary
Neutral
SellBuy
Strong sellStrong buy
Strong sellSellNeutralBuyStrong buy
Summary
Neutral
SellBuy
Strong sellStrong buy
Strong sellSellNeutralBuyStrong buy
Summary
Neutral
SellBuy
Strong sellStrong buy
Strong sellSellNeutralBuyStrong buy
Moving Averages
Neutral
SellBuy
Strong sellStrong buy
Strong sellSellNeutralBuyStrong buy
Moving Averages
Neutral
SellBuy
Strong sellStrong buy
Strong sellSellNeutralBuyStrong buy
Displays a symbol's price movements over previous years to identify recurring trends.