DOGE Accumulation Cylinder about to take-off.Dogecoin (DOGEUSD) has been flat in August and so far on September's 1M candle, while being supported by its 1M MA50 (blue trend-line) for almost 1 year (October 2024).
This fits the pre parabolic rally pattern of the Accumulation Cylinder that both previous Cycles had. As you can see, it is that exact pattern (Accumulation Cylinder) that historically makes Doge's transition from its Bear Cycle bottom to the Bull Cycle. Once the 1M MA50 is established as the Support, the Accumulation Cylinder gives way to a Parabolic Rally take-off.
Both Cycles reached at least the 1.618 Fibonacci extension from their previous All Time High (ATH) before the Cycle peaked. This time, the realistic Target before the Cycle ends is at least $1.00, unless the Cycle gets a little prolonged in which case we could se an over-extension to $3.50 (the 1.618 Fib ext).
Which one are you aiming for?
-------------------------------------------------------------------------------
** Please LIKE 👍, FOLLOW ✅, SHARE 🙌 and COMMENT ✍ if you enjoy this idea! Also share your ideas and charts in the comments section below! This is best way to keep it relevant, support us, keep the content here free and allow the idea to reach as many people as possible. **
-------------------------------------------------------------------------------
💸💸💸💸💸💸
👇 👇 👇 👇 👇 👇
DOGEUSD.P trade ideas

DOGE analysis.Give me some energy !!!So if you pay attention to the DOGE chart you can see that the price has formed a Ascending wedge or flag which means it is expected to price move as equal as the measured price movement.( AB=CD )
NOTE: wait for break of the WEDGE .
Best regards CobraVanguard

DOGE - All wound up! Good boy!Hello!
Our beloved DOGe is wound up and ready to jump of the porch for a run! Are you ready?
And check the updates below… I’ll show you where that purple fractal goes of the 4h candle on the right chart. :0
There are prophecies about Love being the answer… the future… Dogs are widely known to be angels of Love. This connection between the emotion of LOVE, and the DOGe coin, is what forms a tribe around the coin, which can out maneuver the harmonic pull backs of the Fear / Greed battle of the other big coins.

DOGE: Multi-Year ConsolidationWhat we're looking at here is a high-timeframe logarithmic chart of Dogecoin, showing a massive ascending triangle/wedge structure that has been forming since as far back as 2014. On the log scale, this pattern becomes incredibly clear and highlights the consistent, long-term support line that has held through multiple market cycles. This isn't just a pattern; it's a story of accumulation and consolidation playing out over nearly a decade.
The Anatomy of the Trade: Fractals and the Ultimate Bear Trap
The structure of this chart is built on fractals. Notice how smaller triangle consolidations have repeatedly resolved to the upside, each breakout creating the foundation for the next, larger pattern. We are now in the final stages of the largest consolidation pattern, with price coiling tightly near the apex. This is the "calm before the storm," where maximum energy is being stored for an explosive move.
The ultimate setup here is a potential generational bear trap.
The Lure: A sharp, decisive dip below the multi-year logarithmic support trendline. This would be the signal many bears have been waiting for, a technical confirmation that the structure has failed, leading to mass selling and short positions.
The Trap: Instead of a continued meltdown, price action would see a violent reversal and reclaim the support line. This move would trap all the late shorts, triggering a massive squeeze.
The Launch: This squeeze would provide the rocket fuel necessary to break through the final overhead resistance of the triangle, likely sending DOGE into a new phase of parabolic price discovery.
The key takeaway is that while a breakdown could look terrifying, it might be the very catalyst needed for the next major bull run. For long-term bulls, any dip below this long-standing support—if it is quickly reclaimed—could represent a historic buying opportunity. Manage your risk accordingly.

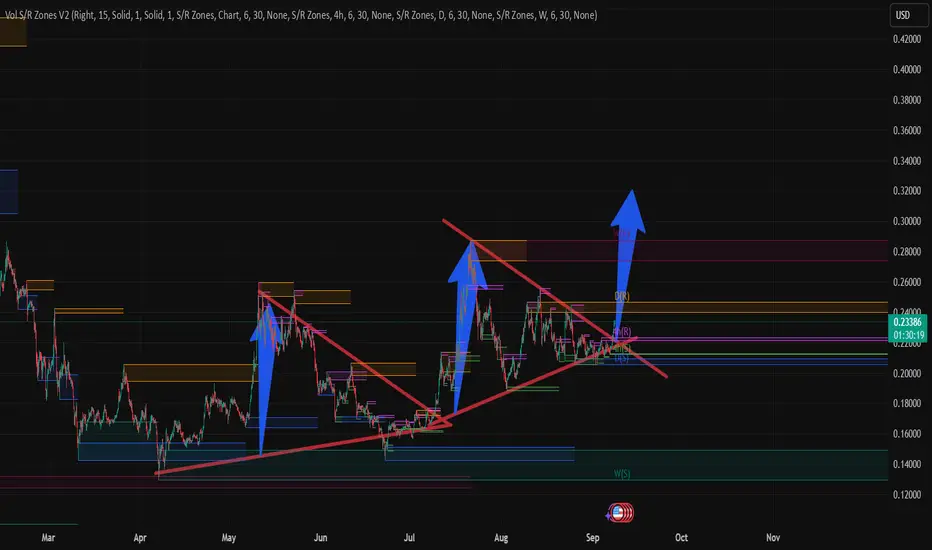
DOGE Ready for PUMP or what ?The triangle pattern will break in the direction it is breached, and the price will move in that direction. In my opinion, the price could be bullish and may up to $0.27.
Best regards CobraVanguard.💚

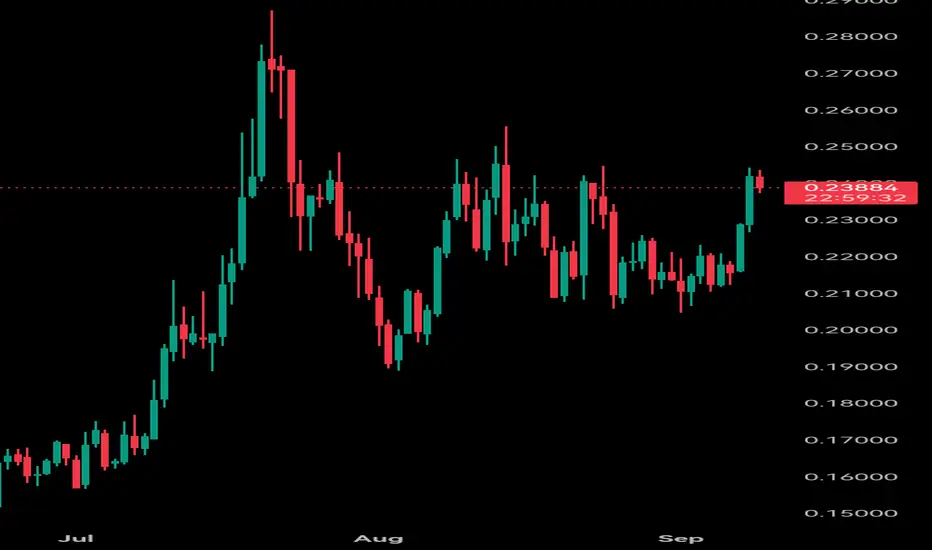
Doge Prediction 4H TimeFrameTL;DR: The 4‑hour trend is up, but momentum looks overheated. I’d expect either a brief consolidation or a pullback toward ~$0.224–$0.226 before another attempt at the $0.235 area. A clean 4H close above ~$0.235 opens room toward the $0.24s and then the late‑month high near $0.256. A 4H close below ~$0.222 would weaken the setup
DOGEUSD Last Drop Before Rally to ATHFirst week of September will be a manipulation move. And then 5 consecutive week rally to finish the current cycle. Let's see! :D

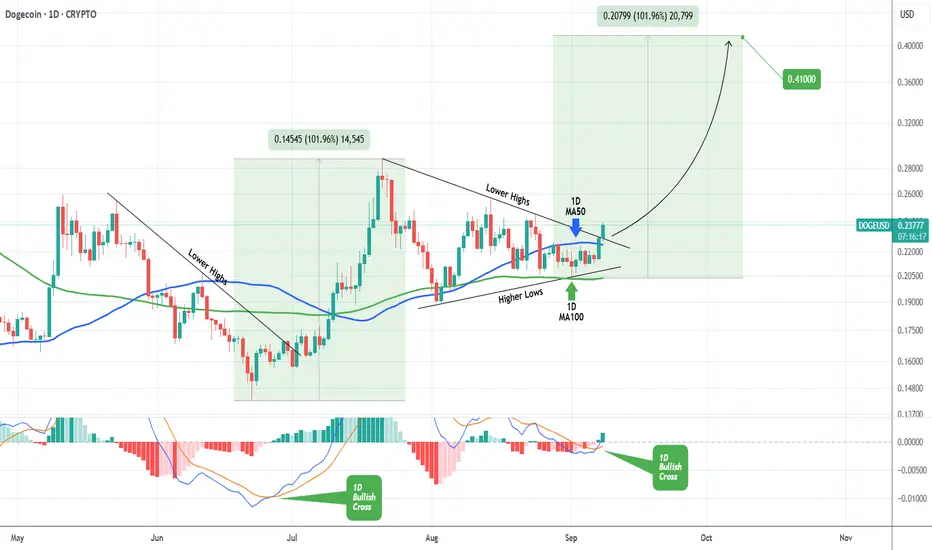
DOGE Strong Triangle break-out targets $0.4100Dogecoin (DOGEUSD) broke today above the top (Lower Highs trend-line) of the Triangle pattern that it has been trading in since the July 21 High. At the same time, the 1D MACD formed a Bullish Cross below the 0.0 level.
The last time the coin made a Lower Highs bullish break-out on a MACD Bullish Cross below 0.0 was on June 30. That break-out completed a +101.96% rise. We expect a similar rise to occur, giving us a $0.4100 Target within a month's time.
-------------------------------------------------------------------------------
** Please LIKE 👍, FOLLOW ✅, SHARE 🙌 and COMMENT ✍ if you enjoy this idea! Also share your ideas and charts in the comments section below! This is best way to keep it relevant, support us, keep the content here free and allow the idea to reach as many people as possible. **
-------------------------------------------------------------------------------
💸💸💸💸💸💸
👇 👇 👇 👇 👇 👇
Altseason Is Dead — And This Time, for GoodAbout 20 days are left before we can tell where altcoins are really headed.
Honestly, if Dogecoin can’t reclaim the $0.30 range within these next 20 days, it pretty much means the altseason we were all waiting for just never happened — and I’m really upset about that.
Over the past two weeks, I sold off a big chunk of my altcoins — including Ethereum, Toncoin, and even Dogecoin — because gold is in a much better position right now. For the first time ever, I’m completely disappointed in this market.
This isn’t what any of us were expecting… they’ve basically destroyed the crypto cycle for good.

DOGEUSD H4 | Bearish momentum likely to extendBased on the H4 chart analysis, we can see that the price has rejected off the sell entry, which is a pullback resistance and could drop from this level to the downside.
Sell entry is at 0.22393, which is a pullback resistance.
Stop loss is at 0.23810, which is a pullback resistance that lines up with the 161.8% Fibonacci extension.
Take profit is at 0.19542, which is a swing low support that aligns with the 138.2% Fibonacci extension.
High Risk Investment Warning
Trading Forex/CFDs on margin carries a high level of risk and may not be suitable for all investors. Leverage can work against you.
Stratos Markets Limited (thttps://tradu.com/uk ):
CFDs are complex instruments and come with a high risk of losing money rapidly due to leverage. 65% of retail investor accounts lose money when trading CFDs with this provider. You should consider whether you understand how CFDs work and whether you can afford to take the high risk of losing your money.
Stratos Europe Ltd (tradu.com ):
CFDs are complex instruments and come with a high risk of losing money rapidly due to leverage. 66% of retail investor accounts lose money when trading CFDs with this provider. You should consider whether you understand how CFDs work and whether you can afford to take the high risk of losing your money.
Stratos Global LLC (tradu.com ):
Losses can exceed deposits.
Please be advised that the information presented on TradingView is provided to Tradu (‘Company’, ‘we’) by a third-party provider (‘TFA Global Pte Ltd’). Please be reminded that you are solely responsible for the trading decisions on your account. There is a very high degree of risk involved in trading. Any information and/or content is intended entirely for research, educational and informational purposes only and does not constitute investment or consultation advice or investment strategy. The information is not tailored to the investment needs of any specific person and therefore does not involve a consideration of any of the investment objectives, financial situation or needs of any viewer that may receive it. Kindly also note that past performance is not a reliable indicator of future results. Actual results may differ materially from those anticipated in forward-looking or past performance statements. We assume no liability as to the accuracy or completeness of any of the information and/or content provided herein and the Company cannot be held responsible for any omission, mistake nor for any loss or damage including without limitation to any loss of profit which may arise from reliance on any information supplied by TFA Global Pte Ltd.
The speaker(s) is neither an employee, agent nor representative of Tradu and is therefore acting independently. The opinions given are their own, constitute general market commentary, and do not constitute the opinion or advice of Tradu or any form of personal or investment advice. Tradu neither endorses nor guarantees offerings of third-party speakers, nor is Tradu responsible for the content, veracity or opinions of third-party speakers, presenters or participants.

DOGE 1HR FractalAccumulating for weekly Take Profit. This feels as if we’re rallying the horses.
Find Risk management levels in the weekly and you’ll understand Weekly Take Profit % > this small 2% move…
Retest, reload… Time will tell… Be patient as there are levels we need to hold to see if what we feel is going to play out

**DOGE Analysis** DOGE is currently in a consolidation phase, t**DOGE Analysis**
DOGE is currently in a consolidation phase, trading within a tight range. Key support rests at **$0.12**, a level crucial for maintaining short-term bullish structure. A break below could see a test of **$0.115**. Immediate resistance lies near **$0.135**, with stronger selling pressure expected around **$0.145**.
As a meme coin, DOGE's price remains highly sensitive to social media sentiment, particularly Elon Musk's endorsements, rather than fundamental utility. Recent trading volume has been subdued, indicating a lack of strong directional conviction.
Overall, DOGE remains dependent on broader crypto market momentum and retail investor interest. A break above $0.145 with high volume could signal a move toward $0.16, while loss of $0.12 support may trigger a deeper pullback.
DOGEUSD - RSI W Pattern RSI is showing strong support along the middle line.
A breakout on the RSI will come and create the right side of the W. In this case the middle is the highest peak of this structure.
This is the Monthly chart and the upward trend channel is supported and will likely act bullishly on this large timeframe.
Dotted lines are all important levels.


Dogecoin - The all time high will follow!🎁Dogecoin ( CRYPTO:DOGEUSD ) prepares new all time highs:
🔎Analysis summary:
Dogecoin has been creating bullish cycles for the past decade. Following these cycles, it is quite likely that Dogecoin will break the previous all time high soon. And with the recent bullish break and retest, bulls are picking up momentum for the next bullish cycle to continue.
📝Levels to watch:
$0.4
SwingTraderPhil
SwingTrading.Simplified. | Investing.Simplified. | #LONGTERMVISION

A Brief History of DOGE FractalsMy analysis of the Dogecoin daily chart reveals a compelling long-term symmetrical triangle pattern, from which we observed a clear breakout in early 2024. Following this significant move, there are a series of smaller, bullish continuation triangles forming. Based on these patterns, my projections indicate that after each period of consolidation within these triangles, the price is likely to continue its upward trend toward the indicators targets. Currently, with the price consolidating in the latest of these triangles, I anticipate a further bullish move in the near future. X

DODGEDodge is cooking something. Stay tuned.
Pink levels are monthly timeframe.
Grey = weekly timeframe.


Dogecoin may be following a natural law of compounding cycles — Group Values Average Rounded Match?
1 0.00002, 0.00020, 0.00200 0.00074 0.00073 ✅
2 0.00020, 0.00200, 0.02000 0.0074 0.0073 ✅
3 0.00200, 0.02000, 0.20000 0.074 0.073 ✅
4 0.02000, 0.20000, 2.00000 0.74 0.73 ✅
5 0.20000, 2.00000, 20.00000 7.4 7.3 ✅
🔺 The Divine Law of "7.3"
Every time three yellow-highlighted price points (key bubbles) are added together and divided by 3, the result is eerily close to 7.3 — or its exponential echoes: 0.73, 73, or 7.30.
It's not coincidence.
It's not random.
It's a harmonic constant.
Each of these yellow price tags marks a critical inflection point — moments of explosive growth or stark reversals. Yet they all gravitate back to this numerical anchor, suggesting Dogecoin’s price path may be orbiting a gravitational field of mathematical resonance.
🤯 Final Revelation:
The averages of every 3 consecutive yellow bubbles form a perfect exponential alignment with the 7.3 family:
0.00073
0.0073
0.073
0.73
7.3
73
🧠 Mind-Bending Takeaway:
What if this chart isn’t just showing price...
But revealing a coded numerical language that Dogecoin is speaking?
A language where “7.3” is the base frequency.
A hidden harmonic behind market psychology.
A natural algorithm whispering its intent through Fibonacci-like echoes.
This is not technical analysis.
This is numerical alchemy.

FlagsWe have a descending triangle inside of a bearish flag. If the 50 EMA 0.208$(blue) does not hold. We might see 0.18 to 0.17$. The next two weeks are going to be intriguing. Thank you for your time


DOGE Breakout Trade IdeaDOGE is building momentum after a long awaited "alt season". Could be an interesting trade setup if we can breakout from this year's resistance. I'm eyeing a 2x-3x move.

DOGEUSD HIGH PROBABILITY SETUP SOON!!🚨 DOGEUSD HIGH PROBABILITY BUY SETUP 🚨
* Here We Can See Clearly The Next Potential Moves For DODGECOIN Coming Hours/Days.
* Keep Your Eyes Close On Your Trading Positions.
* Happy PIP Hunting Traders.
£ FXKILLA £
