Relief Rally Expected Before Next Leg Down on DOGEUSDTDOGEUSDT has initiated a clean corrective structure following the creation of a bearish flag. The breakdown from the flag triggered a strong downward leg, confirming the shift in momentum and validating the continuation pattern. At the moment, the market is trading below the breakout zone, and further price development is expected to unfold through a relief rally.
The immediate plan is to monitor a pullback toward the minimum bearish flag targets around the $0.12 region, which aligns with the former structure support and breakout zone. This area is likely to serve as supply on the retest, where rejection is anticipated to resume the broader corrective move.
The final downside target has been mapped on the chart, and the price action will remain bearish as long as market structure continues to respect the breakdown level.
Trade ideas
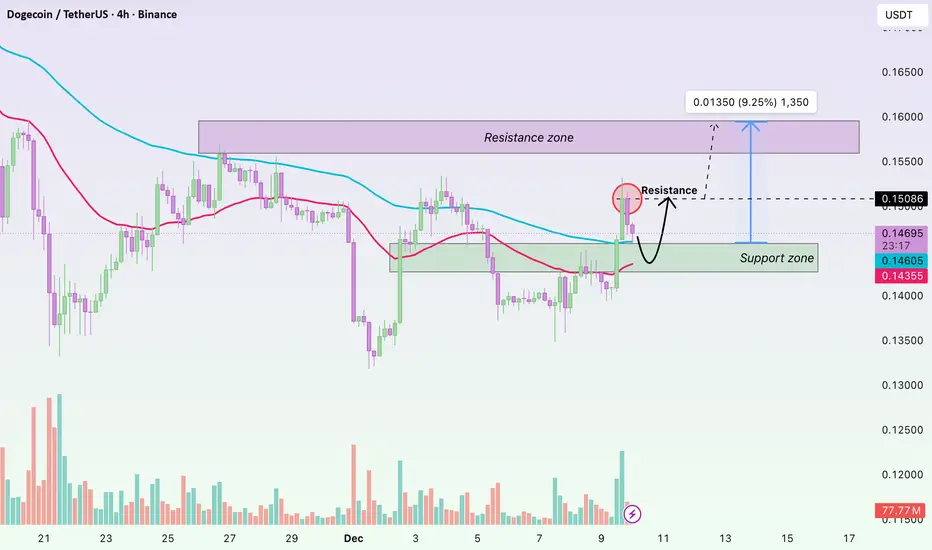
DOGE – Short-Term Breakout: EMA and Volume Support the UptrendHi everyone, Domic here. Dogecoin is showing a strong bullish move after breaking key EMA levels, accompanied by rising volume, indicating that buyers are in control. On the H4 chart, the 34 EMA (red) and 89 EMA (blue) serve as markers of the short-term trend. DOGE moving above both EMAs while forming higher lows suggests a high probability of continued short-term gains. Price is currently approaching the 89 EMA, a key technical resistance, and its reaction around this level will determine the next leg of the uptrend.
Trading volume on December 9 surged, reflecting active buying and support for the breakout from the accumulation zone around $0.146 to above $0.147. This signals that DOGE has the potential to extend its rally, but attention should be paid to its reaction near the $0.150 resistance level.
Currently, the market anticipates a clear breakout above $0.150. Positive sentiment from external factors — such as Elon Musk’s tweets, renewed interest in meme coins, DOGE adoption as a payment method, and expectations of a dovish Fed — is supporting inflows.
Wishing you all a successful trading day!
Dogecoin DOGE price analysis#Dogecoin ( CRYPTOCAP:DOGE ) shows a completed Cup & Handle structure on the OKX:DOGEUSDT chart.
Key observations:
• The memecoin sector is unwinding slower than it expanded
• CRYPTOCAP:DOGE represents more than 50% of total memecoin market cap
• The technical structure suggests two main scenarios:
1️⃣ Minimal target: ~$0.78 (mild breakout / local ATH retest)
2️⃣ Extended target: ~$1.55–1.60 (x10–11 from current levels)
A full move would imply a market cap close to $250B — aggressive, but not impossible under peak liquidity conditions.
Additionally, the same macro pattern may later appear on CRYPTOCAP:ETC and CRYPTOCAP:ADA , which structurally resemble earlier stages of Dogecoin’s formation.
❓ Which scenario do you consider more realistic for CRYPTOCAP:DOGE in the upcoming market phase?
______________
◆ Follow us ❤️ for daily crypto insights & updates!
🚀 Don’t miss out on important market moves
🧠 DYOR | This is not financial advice, just thinking out loud

DOGE soon will break 0.15$ and then again bull marketDOGE is currently consolidating within a defined range near the major support zone of $0.08 to $0.12. This range-bound action suggests a period of accumulation, and a breakout above the descending trendline—particularly with a decisive move past the $0.15 resistance—would signal the likely resumption of bullish momentum.
In such a scenario, measured upward projections point toward initial targets near $0.22, followed by a secondary objective around $0.29, contingent upon sustained buying pressure and volume confirmation following the breakout.
DISCLAIMER: ((trade based on your own decision))
<<press like👍 if you enjoy💚

DOGEUSDT → Lack of bullish potential BINANCE:DOGEUSDT.P failed to break the trend. Under pressure from resistance and a global downtrend, the coin is reversing and may decline...
Bitcoin is pausing after a news rally based on rumors. The trend remains bearish. Pressure on the crypto market is present...
DOGE faced pressure in the 0.1477 - 0.155 zone. A rebound from 0.1533 is forming and the price is closing below 0.1477, forming a pre-breakout base of 0.1464. The reaction to support is weakening, confirming the weakness of the buyer. A close below 0.1464 could trigger a further decline within the range.
Resistance levels: 0.1477, 0.15337
Support levels: 0.1464, 0.1366
A breakdown of support, closing below the level, and consolidation in the short zone will once again confirm buyer weakness, which in turn may trigger a further decline.
Best regards, R. Linda!

Weekly support zone can pump DOGE above 0.15$ soonAs observed on the chart, DOGE is consolidating within a range near two key weekly support levels: $0.13 and $0.09. The price is currently holding firmly at the higher support zone ($0.13), indicating potential accumulation.
The first confirmed signal for a bullish reversal would be a decisive breakout above the $0.15 resistance level, ideally accompanied by rising volume. Such a breakout would likely shift market structure in favor of the bulls and could initiate a new upward cycle. Based on the depth of the current range, measured move projections suggest a potential upside of 2x to 3x from the breakout zone, provided momentum and buying pressure are sustained.
DISCLAIMER: ((trade based on your own decision))
<<press like👍 if you enjoy💚

DOGE/USDT Daily Analysis: Strong Support Emerges, Exceptional RiTrading Pair: DOGE/USDT Timeframe: Daily (D)
Key Price Action and Technical Analysis
1. Strong Support Zone As shown in the chart, the price of DOGE has accurately pulled back to the marked Strong Support Zone (approximately the $0.12 - $0.15 range). This area has served multiple times in the past as a critical support and resistance flip level. This is the first major retest of this key area after breaking out of the consolidation zone in early 2024.
2. Prior Accumulation Zone If the $0.12 support level is decisively breached, DOGE has a high probability of reverting to the lower Accumulation Zone (approximately the $0.05 - $0.12 range). This would imply a need for a longer period of bottom consolidation and accumulation.
Core Trading Strategy: Balancing Risk and Reward
Our strategy is based on a simple, high-probability principle: positioning ourselves while key support holds, aiming for an extreme risk/reward ratio.
Entry Zone: The current price area, the best zone for scaling in ($0.13 - $0.15).
Stop-Loss: The critical point confirming support failure (Slightly below $0.12).
Target: Near the long-term ascending trendline resistance (Around $0.37).
Why is this the best time to add to a position?
Exceptional Risk/Reward: Compared to the potential $0.01 - $0.02 stop-loss range, the potential profit of $0.20+ gives this trade a risk/reward ratio near 10. A high R/R is the core of long-term sustainable profitability.
Clear Invalidity Point: The $0.12 price is a clear and logically strong stop-loss level; a breach would signify a breakdown of the market structure, demanding an immediate exit.
Conclusion and Risk Disclaimer
Conclusion:
As long as the $0.12 critical support level is not decisively broken by a daily candlestick body, this represents the best opportunity for us to accumulate CRYPTOCAP:DOGE at a low price. If support fails, we will exit and patiently await the next cycle.
Risk Disclaimer: While the R/R is excellent, the cryptocurrency market is highly volatile. Please ensure you size your position appropriately according to your capital and strictly execute your stop-loss.

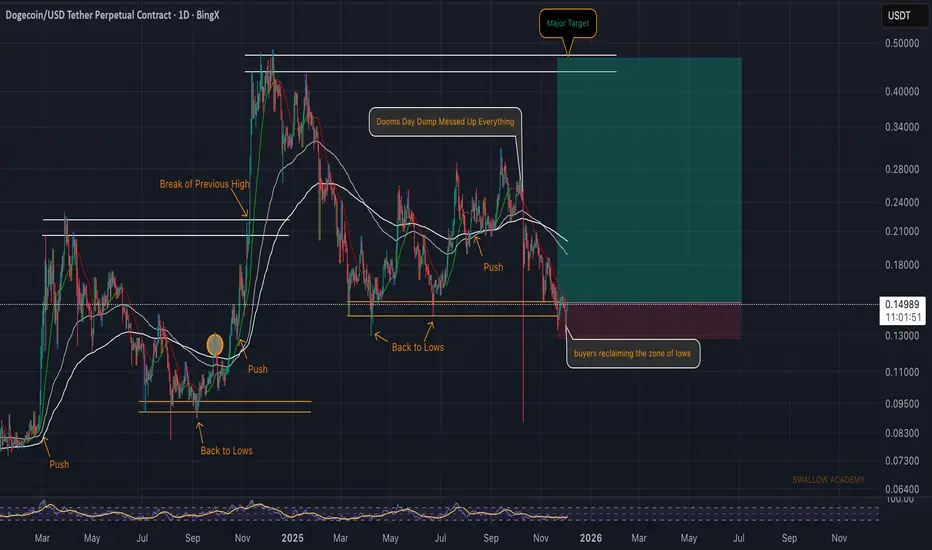
Dogecoin (DOGE): Looking For Push And Start of Bullish RallyDOGE is back inside the same demand zone that previously launched a massive rally, and buyers are already showing signs of reclaiming it again. This area has acted as a strong base multiple times in the past, creating those sharp “push → back to lows → push” sequences, so seeing price return here gives us an ideal buy opportunity.
If buyers manage to hold this zone and secure the EMAs, momentum should slowly shift back in their favor, opening the path toward the major target above. As long as this support holds, this remains one of the cleaner long setups on the chart.
Swallow Academy
DOGE/USD 3d TARGET +1.30$DOGE/USD 3d midterm chart
Mid Target: 1.3$ (parallel channel tops)
Doge is ready to go

DeGRAM | DOGEUSD aims to return to $0.15📊 Technical Analysis
● DOGE rebounded cleanly from the 0.1359 support line, forming a higher low and recovering back inside short-term structure.
● Price is aiming toward 0.1420 and the descending resistance near 0.1465, where the channel top may cap the move.
💡 Fundamental Analysis
● Sentiment improved as meme-assets reacted positively to broader crypto strength and rising risk appetite.
✨ Summary
● Long bias; targeting 0.1420 → 0.1465 as price lifts from support.
-------------------
Share your opinion in the comments and support the idea with a like. Thanks for your support!

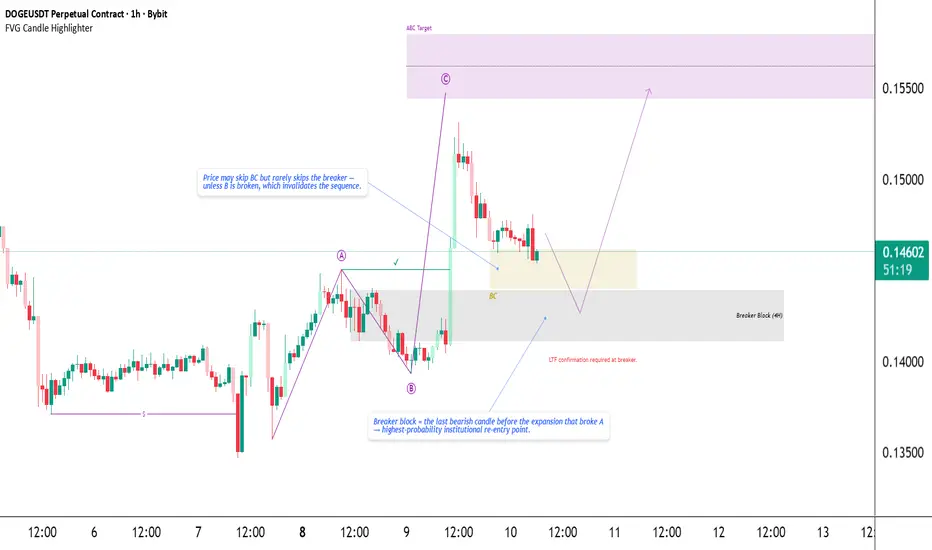
DOGE — SK Structure Breaker Block Re-Entry Toward C-TargetDOGE has completed a clean SK bullish sequence :
• A → B → C , with C breaking above A and confirming bullish intent.
• This expansion created two important reaction zones:
— BC zone → structural strength (broader discount area)
— Breaker Block → precision re-entry (highest probability)
From testing across assets, price may skip BC entirely, but it almost always respects the breaker block , as long as swing B remains protected.
➡️ If B breaks, the sequence is invalid.
Trade Plan
I’m waiting for price to retrace into the Breaker Block (4H) .
Inside that zone, I will look for LTF confirmation before entering — ideally a small BOS/MSS or shift in delivery.
Targets & Invalidation
• Target : The projected C-Target zone above
• Invalidation : ➡️ Any wick through B instantly invalidates the SK sequence — setup is dead.
This setup reflects my current blueprint:
Structure → Breaker → LTF confirmation → Ride back to C-Target.
Not financial advice.
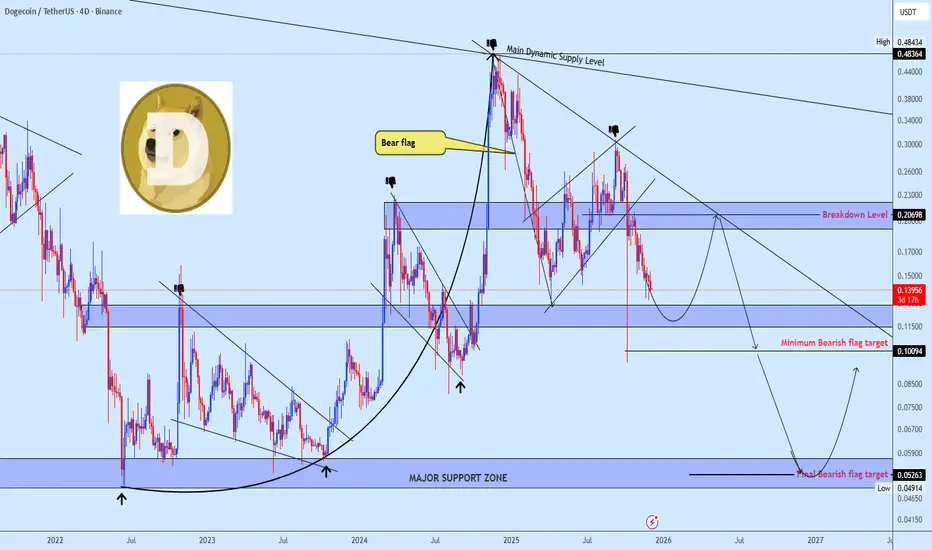
DOGE – Downtrend Channel + Bearish Head & Shoulders BreakdownDogecoin continues to move inside a large multi-year descending channel, respecting both the upper and lower boundaries. Recently, the chart has formed a clear bearish Head and Shoulders pattern , which has already broken down and is currently playing out.
At this stage, I expect a small relief retest toward the $0.15–$0.175 zone , which corresponds to the broken neckline area. If this retest confirms resistance, DOGE may enter a deeper correction phase.
The main downside target lies at the $0.04–$0.03 zone , aligned with the lower boundary of the long-term descending channel.
From this area, I expect the beginning of a new bullish cycle for DOGE, potentially initiating a macro trend reversal.
Future bullish targets:
$0.80–$1.00
$1.70–$2.20

DOGE/USDT — Kijun Breakout Setup ► Bullish Swing Opportunity**📌 DOGE/USDT “DOGECOIN VS TETHER”
Crypto Market Opportunity Blueprint (Swing Trade)**
🟢 PLAN
Bullish plan activated but pending order — waiting for a clean Kijun Moving Average breakout.
This setup focuses on momentum shift + trend confirmation before entering aggressively.
🎯 ENTRY LEVEL
You can enter at any price level after the Kijun breakout @ 0.15100.
This protects you from premature entries and avoids fakeouts before trend confirmation.
🛡️ STOP-LOSS
This is Thief SL → 0.14400
Dear Ladies & Gentlemen (Thief OG’s), adjust your SL based on your strategy & your own risk.
Place SL only after the breakout confirmation, not before.
Reminder: This SL is not a mandatory one. You choose your risk. You make the money, then take the money at your rules.
🎯 TARGET
Moving Averages show strong resistance, price is near overbought zones, and potential trap zones exist — so book profits with discipline.
Our target → 0.16200
Again: This TP is optional. Use your personal exit plan based on market momentum and your risk tolerance.
📡 Related Pairs to Watch (Correlation & Key Points)
Tracking correlated pairs strengthens accuracy. Here are the most relevant:
1. BINANCE:BTCUSDT
Key Correlation:
DOGE follows BTC’s overall direction 70–80% of the time during swing phases.
A BTC breakout above major MAs often fuels memecoin rallies.
Watch for: BTC holding above its Kijun / 1H–4H cloud.
2. BINANCE:ETHUSDT
Key Correlation:
ETH strength = stronger altcoin liquidity rotation.
If ETH breaks resistance, capital flows into major alts → then into meme assets like DOGE.
Watch for: ETH bullish continuation patterns.
3. BINANCE:SHIBUSDT
Key Correlation:
Direct memecoin sector sentiment indicator.
SHIB pump = DOGE usually reacts next with lag.
Watch for: SHIB Kijun breakout or sudden volume burst.
4. BINANCE:PEPEUSDT
Key Correlation:
New-age meme liquidity leader; often front-runs meme sector volatility.
PEPE volatility spikes are usually early warning signals for DOGE momentum.
Watch for: Volume expansion + breakout candles.
5. BINANCE:LTCUSDT (Secondary correlation)
Why:
LTC acts as a secondary liquidity indicator for old-generation altcoins.
When LTC moves with speed, DOGE tends to follow in the same risk-on window.
Watch for: LTC strength above its 200 MA.
📌 Final Note
Track DOGE’s Kijun breakout, manage risk with discipline, and monitor correlated assets to stay in sync with sector momentum. This keeps your swing strategy clean, controlled, and data-driven.

DeGRAM | DOGEUSD is falling in the channel📊 Technical Analysis
● DOGE continues to trade within a descending channel, repeatedly rejecting the dynamic resistance near 0.1473. The recent lower-high formation and breakdown from the short-term trendline signal renewed bearish momentum.
● The failed right-shoulder recovery and tightening consolidation below 0.1460 increase the probability of continuation toward the 0.1400 support.
💡 Fundamental Analysis
● Sentiment toward memecoins remains weak as risk appetite softens and broader crypto rotation favors large-caps.
✨ Summary
● Bias: bearish; below 0.1460 targeting 0.1400 → 0.1357.
-------------------
Share your opinion in the comments and support the idea with a like. Thanks for your support!

DOGE near term TARGET $0,34Dogecoin is likely on it's way to more bullish prices.
Since around 22 June, there's been a near "up-only" trend on DOGE, where the price is continuously making higher highs and the corrections are all still higher lows.
In terms of technical indicators, we see strong bullish indication in the weekly timeframe as the price trade above all moving averages:
The daily timeframe's price is trading above the moving averages as well. A good place to watch for SHORT term corrections is the first and second band of the moving averages here:
OKX:DOGEUSDT BINANCE:DOGEUSDT

DOGENever fade $DOGE. Within 133 days I am expecting a bullish catalyst that pushes it through the diagonal resistance. Once that breakout hits, the next target is $0.42 followed by $1. The structure and timing both support a major move.

DOGE/USDT : BUY MARKETHello friends
Well, considering the decline we had, you can see that the price has been well supported by buyers, which has caused the price to increase slightly.
Now it seems that given the good fundamental news on the Dodge and the ascending channel it has created, it can grow.
There is also an important resistance ahead, which if broken, could see the number 19 cents.
This analysis is purely from a technical perspective and is not a buy or sell recommendation. Avoid emotional behavior.
Trade safely with us

#DOGE/USDT - Only One Scenario Left: UP#DOGE
The price is moving in a descending channel on the 1-hour timeframe. It has reached the lower boundary and is heading towards breaking above it, with a retest of the upper boundary expected.
We have a downtrend on the RSI indicator, which has reached near the lower boundary, and an upward rebound is expected.
There is a key support zone in green at 0.1470. The price has bounced from this zone multiple times and is expected to bounce again.
We have a trend towards consolidation above the 100-period moving average, as we are moving close to it, which supports the upward movement.
Entry price: 0.1490
First target: 0.1500
Second target: 0.1522
Third target: 0.1550
Don't forget a simple principle: money management.
Place your stop-loss order below the support zone in green.
For any questions, please leave a comment.
Thank you.

DOGEUSDT.P PRICE PREDICTIONDoge ETF launched last week
I think there is a chance that maybe Doge could rally to a new high in the next 1 or 2 months.
I set a target at $0.3 but you can expect it will reach $0.45 (finger cross :D)

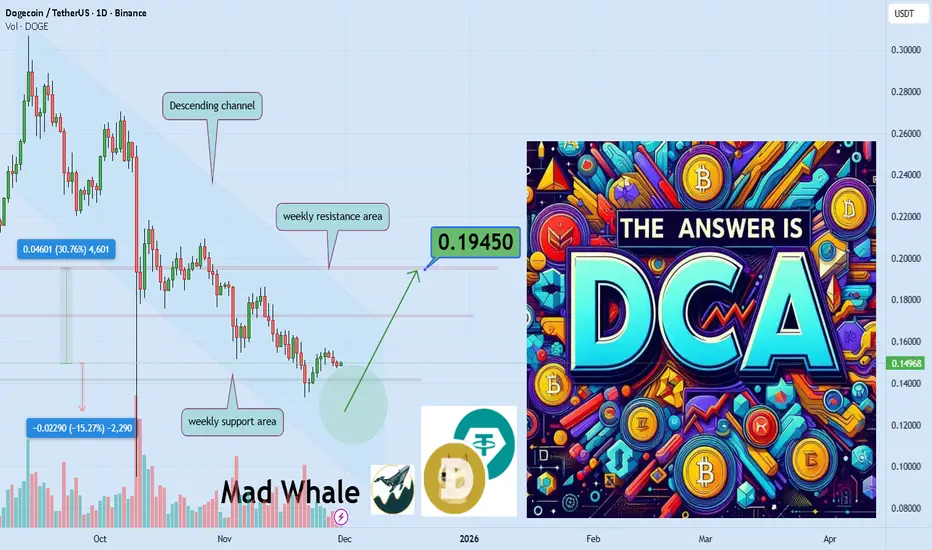
Working hard yet poor while Others get wealthy, answer is DCAEver wondered why you work so hard yet your wealth doesn’t grow
How some people with the exact same income quietly multiply their assets
The answer is a simple calm strategy that whales follow It is called DCA
Hello✌️
Spend 3 minutes ⏰ reading this educational material.
🎯 Analytical Insight on doge:
I expect a much bigger rise for Ripple than what I have shown on the chart. But we should remember that every year when the New Year approaches the market usually goes bearish. We need to wait and pass through that period to see what the final result will be.
Now , let's dive into the educational section,
The problem isn’t the market it is our behavior 🧠
Many wait for the perfect entry and never enter at all
Others rush to buy the top then panic sell the bottom
This behavior kills wealth and wastes precious time
The market never rewards emotional chaos
DCA means order inside crypto chaos ⏳
Crypto volatility punishes the impatient every single time
Buying periodically stops emotional decision making
If price drops you accumulate cheaper
If price rises your position grows stronger
Why whales never act like retail traders 🐳
Whales never throw all capital at once into the market
They use every dip as a quiet accumulation opportunity
DCA is simply whale strategy in a smaller scale
Slow silent and incredibly powerful
Greed is the hidden enemy of retail 🔥
Our mind always asks for fast and huge profits
But real profits go only to the patient ones
DCA isn’t greedy but builds true wealth
Each small buy is one step toward financial freedom
When everyone is hopeless you own the future ⚡
In bear markets emotional traders give up
But DCA traders become the future winners
The market rewards those who continue
Not those who stop because of fear
Your DCA plan must stay simple 📝
Define a monthly amount that never hurts your life
Choose a fixed time so it becomes a habit
Pick strong and credible long term assets only
Most important never break discipline for news or hype
summary 🎯
If you work hard but wealth doesn’t grow
The problem is not effort the problem is no system
TradingView features that make DCA smarter 📈
Price alerts so the market never surprises your entries
Moving averages to confirm trend before new allocation
Support zones marked with horizontal levels for optimal steps
Volume indicator to detect where big money is building positions
Percent labels to track the efficiency of every DCA buy
A clean focused watchlist to keep best assets always visible
survival tips for crypto investors 🔑
Never sacrifice long term patience for short term excitement
Volatility copies your mindset stay balanced and volatility works for you
True wealth goes to those who continue even during deep red days
✨ Need a little love!
We pour love into every post your support keeps us inspired! 💛 Don’t be shy, we’d love to hear from you on comments. Big thanks , Mad Whale 🐋
📜Please make sure to do your own research before investing, and review the disclaimer provided at the end of each post.
DOGEUSDT /// 30NOVThe sharp market decline on Friday, October 10th led to a significant drop of approximately 63% in Dogecoin. Currently, the market is retracing part of that daily candle. Price is trading around $0.15, and selling pressure has notably decreased; however, there is still no clear presence of strong buyers to support a sustained upward move.
For Dogecoin to potentially enter a strong bullish phase, price would need to show a sharp reaction and visible inflow of capital around the $0.11 area. A plausible scenario is that the market may reach this level either through another downward leg or after a short-term move toward the $0.18 zone, where it could face renewed selling pressure and move back down toward $0.11.
Overall, price may continue to range between $0.11 and $0.24 for several months. At the moment, there is no technical evidence on this chart suggesting a sharp rally toward the $1 level.

DOGE 4H – Trendline + EMA Rejection, Liquidity Below?DOGE is reacting cleanly to a multi-factor resistance cluster: the descending trendline, the 50 EMA, and the 100 EMA all converge at the same price level. This area has rejected every retest during the downtrend, and today’s wick into the circle shows the same behavior.
Stoch RSI is extended into overbought territory, adding momentum exhaustion to the setup. Below, the $0.136 level remains the key liquidity draw from previous lows — and price has not fully tapped into that zone since the last sweep.
For bulls to regain control, DOGE must break and hold above the EMA cluster and trendline. Until then, the structure favors a continuation move toward lower liquidity levels.

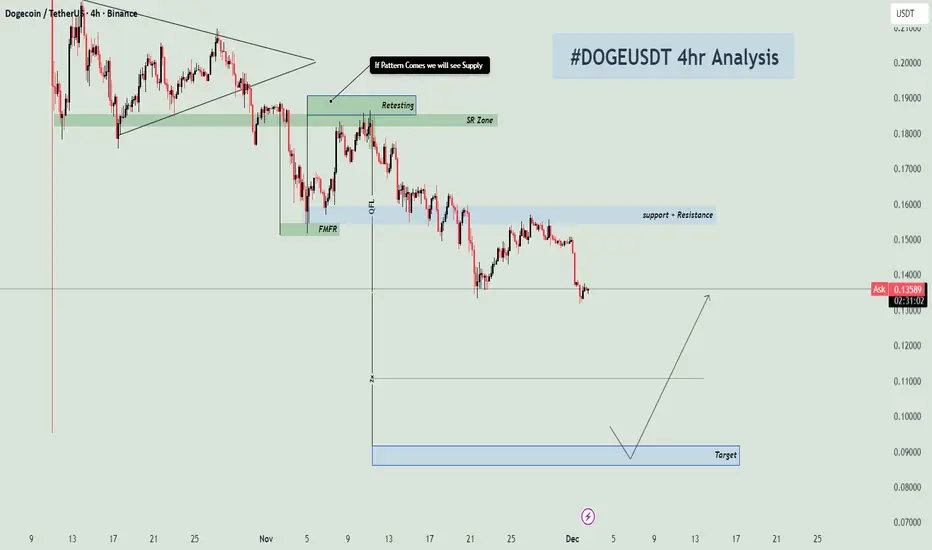
DOGE/USDT: Structural Breakdown & Retest of S/R Flip To Target📉 DOGE/USDT 4H: Structural Breakdown and Retest of S/R Flip for Continuation Short
📝 Market Overview and Trend Context
The DOGE/USDT pair, as observed on the 4-hour chart, has undergone a significant structural breakdown following an extended period of consolidation (a potential triangle or pennant pattern). The initial support zone, which held price during the consolidation, was decisively broken around the 0.18000 level.
The current price action is characterized by a bearish trend, with the most recent move being a retest of the broken support level, which has now flipped to become a critical Resistance Zone (S/R Flip). The overall expectation is for a continuation of the bearish trend towards much lower structural lows.
🔑 Key Technical Zones and Structural Elements
The analysis focuses on the structural change and the re-entry point for selling:
1. S/R Flip Zone (The Supply Entry) 🔴
Zone Location: The green shaded area, spanning roughly 0.18000 to 0.18500.
Significance: This zone was the last significant area of support before the decisive breakdown. After the break, price rallied back up to this zone in a retesting maneuver. This confirms the S/R Flip, where former support becomes new, strong resistance (a high-quality Supply Zone).
Trading Thesis: This is the high-probability area where institutional sell orders are expected to enter the market, initiating the next leg down of the bearish trend.
2. False Move Failure Retest (FMFR)
Marking: An area labeled FMFR (False Move Failure Retest) appears near the retesting area. This highlights a specific pattern often used in Smart Money Concepts (SMC) where the initial move into a zone is often complex or fails before the true move begins, adding confluence to the resistance/supply thesis.
3. Target Zone (Accumulation Zone) 🔵
Zone Location: The blue shaded box, spanning approximately 0.08800 to 0.09100.
Significance: This is the primary long-term Target for the short trade. It represents the next major structural low or a historical area of strong accumulation/demand, which is likely to attract the price once the supply pressure is confirmed.
📊 Trading Hypothesis: Shorting the Retest
The trade plan is contingent on confirming the bearish pattern at the S/R flip zone:
Trade Direction: Short (Sell).
Entry Strategy : The condition for entry is strictly: "If Pattern Comes we will see Supply". This means traders must wait for a clear bearish pattern (e.g., bearish engulfing candle, pin bar, or an indication of supply overwhelming demand) to form within the S/R Flip Zone on the 4H chart or a lower confirmation timeframe (e.g., 1H).
Stop Loss (S/L) : The Stop Loss should be placed securely above the highest wick of the S/R Flip Zone retest (e.g., above 0.19000), protecting against a false breakdown and a move back into the prior consolidation range.
Take Profit (T/P): The primary and most aggressive target is the Target Zone around 0.09000. Given the size of the move, interim profit targets may be placed at psychological levels (e.g., 0.12000 or 0.10000).
⚠️ Risk Management and Invalidation
The critical factor is adherence to the "If Pattern Comes" rule. Entering before a clear rejection of the S/R Flip Zone is premature. A decisive close above the S/R Flip Zone (e.g., above 0.19000) would invalidate this bearish setup, potentially signaling a large deviation move or a false structural break.