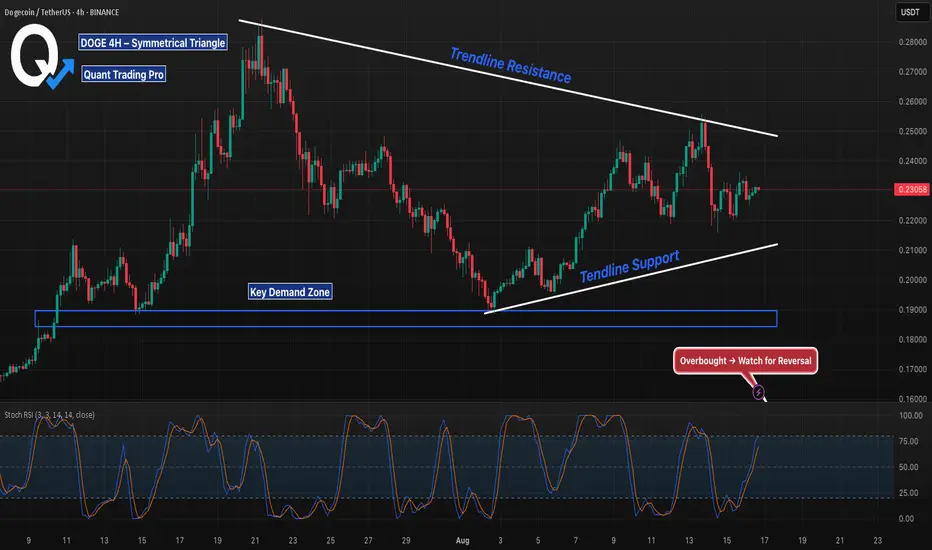
DOGE 4H – Breakout Toward 0.25 or Breakdown to 0.19?Dogecoin is consolidating inside a symmetrical triangle with lower highs and higher lows converging. Price is currently hovering near 0.23, right in the middle of the structure.
Bull case: Break above 0.25 trendline resistance would confirm bullish continuation, opening a push toward the mid-0.26s.
Bear case: Failure to hold 0.22 would invalidate the rising base and target the 0.19–0.20 demand zone.
With Stoch RSI overbought, momentum may cool before a decisive breakout. The next move out of this triangle will set the direction.
DOGEUSDT trade ideas
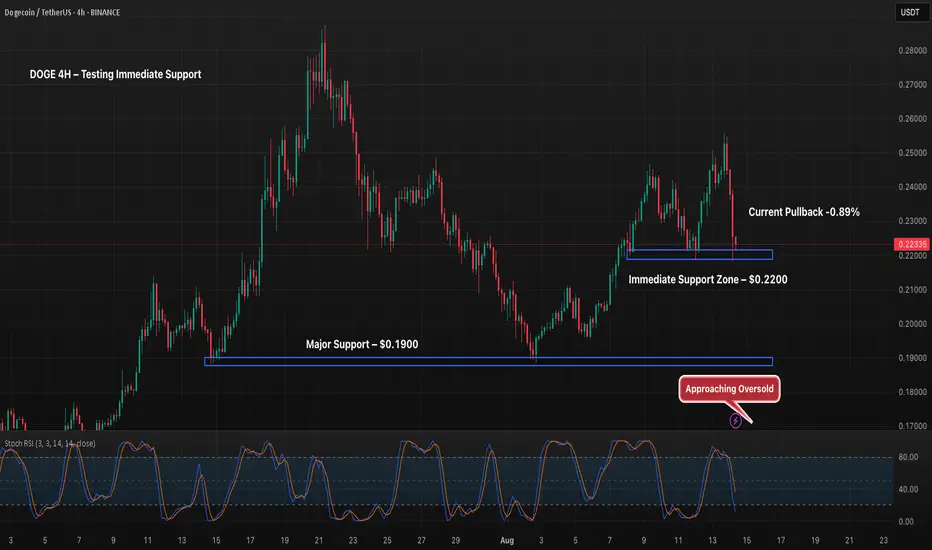
DOGE 4H – Testing Immediate SupportDogecoin’s 4H chart is testing its immediate support near $0.2200 after a sharp pullback. The oversold Stoch RSI suggests potential for a short-term bounce, but a decisive break lower could trigger a move toward the major $0.1900 support zone. Bulls will need to reclaim $0.24 to shift momentum back upward.
DOGEUSDT FLAG Pattern and CorrectionDOGEUSDT recently broke out of a bullish wedge, triggering an upward price move. It has now formed a bullish flag pattern, with the price currently in a corrective phase. The correction could extend to the 0.5 Fibonacci retracement level around 0.22, after which traders will be watching for a breakout above the flag’s trendline.

Strong BULLISH TREND will continueThe best time and place to buy.
Divergence is observed.
Zigzag pattern has been completed on the daily timeframe.
It will see its previous high at $0.46.
Be patient


The reaction to the specified blue-colored areaHi, I think in the blue-marked area we can make a good buy, but unfortunately I can’t identify the target.
What’s your opinion?
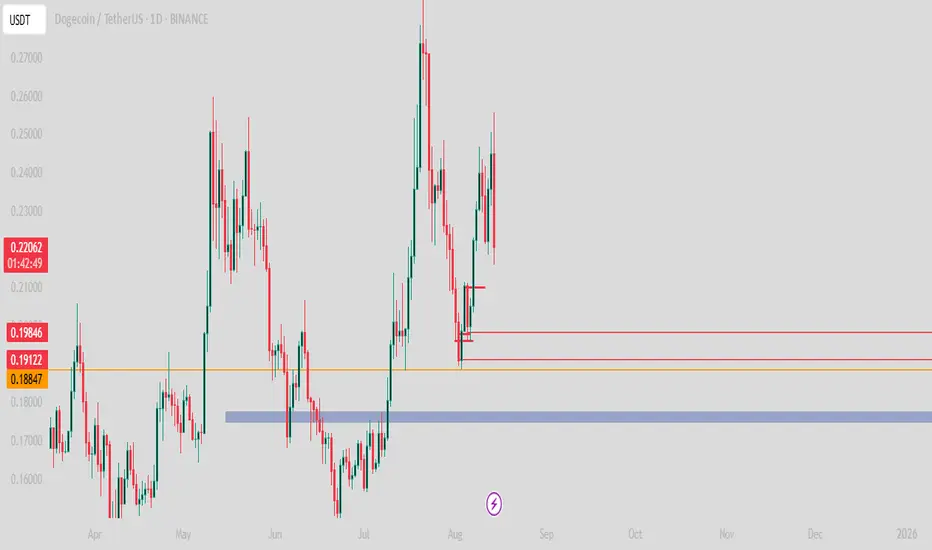
#DOGE/USDT | Eyes Bounce from Key Support !#DOGE
The price is moving within an ascending channel on the 1-hour frame, adhering well to it, and is on its way to breaking strongly upwards and retesting it.
We have support from the lower boundary of the ascending channel, at 0.1930.
We have a downtrend on the RSI indicator that is about to be broken and retested, supporting the upside.
There is a major support area in green at 0.1895, which represents a strong basis for the upside.
Don't forget a simple thing: ease and capital.
When you reach the first target, save some money and then change your stop-loss order to an entry order.
For inquiries, please leave a comment.
We have a trend to hold above the 100 Moving Average.
Entry price: 0.2060.
First target: 0.2111.
Second target: 0.2183.
Third target: 0.2264.
Don't forget a simple thing: ease and capital.
When you reach the first target, save some money and then change your stop-loss order to an entry order.
For inquiries, please leave a comment.
Thank you.

2 Billion DOGE Accumulation Triggers Golden Cross For Dogecoin At the time of writing, BINANCE:DOGEUSDT is trading at $0.246 , having recently broken through the $0.241 resistance level. To sustain its upward movement, Dogecoin needs to convert this level into solid support. If it manages to hold above $0.241, it will likely continue rising, with $0.273 acting as the next major resistance point.
The accumulation of BINANCE:DOGEUSDT by whales is expected to drive the price towards the $0.273 resistance level. Dogecoin whales have been a significant driver of the recent price movement, showing bullish sentiment since the start of the month.
In the past week, addresses holding between 100 million and 1 billion DOGE have accumulated more than 2 billion BINANCE:DOGEUSDT , worth approximately $500 million .
If the Golden Cross continues to signal bullish momentum, BINANCE:DOGEUSDT price could surpass this resistance and continue rising.
However, if the bullish momentum fails to strengthen, BINANCE:DOGEUSDT may experience consolidation between the $0.241 and $0.218 levels . This scenario would indicate a weakening of market confidence, causing a temporary price pullback. Should this occur, the bullish outlook would be invalidated, and further losses may follow.

Dogecoin (DOGE): Push Phase Has Started | Bullish AFDOGE is playing by the book, just as we were looking for. Our theory was right here and we are now in the push phase, where after the recent fight over EMAs, we see that buyers took full control.
Won't keep it long; everything should be clear here—we are bullish!
Swallow Academy

DOGE - Time to buy again!It appears that the price is forming a cup and handle pattern, and if this occurs, it could push the price above $0.33.
Best regards CobraVanguard.💚

DOGE Long 7xA+ Setup
Entry $0.2204
Entry below 200EMA hourly chart
SL $0.21
Target $0.02515 Sell 100%
B/E After closing above 200 on hourly
Risk 4/10

DOGE may face a Major Correction Old memes are getting forgotten more and more as thousands of new, funnier ones with even greater potential pop up every day. DOGE may still be climbing right now, but if you look closely, the chart is looking pretty sad at the moment. That said, the long-term potential is huge — it just needs time.
Here’s the breakdown:
➡️ The first thing that stands out is the large number of gaps above. When the price was dropping, it did so sharply. And as we know, 99% of gaps get filled sooner or later — just probably not right now.
➡️ Volume — divergence with price. Buying volumes keep declining while the price is moving up. This type of trend is usually considered weak and unstable. In fact, buying volume is near its lows despite the overall market situation.
➡️ Money Flow — here we see harmony with price. Liquidity is still flowing in, but only in small portions, which of course isn’t enough. This shows that interest in the asset remains, but it’s not particularly strong at these price levels.
➡️ The price is also close to its yearly ascending trendline support, which could spark a rally — but that seems unlikely. More likely, I expect a long squeeze below support, leading to complete disappointment in DOGE, followed by a slow accumulation phase and an eventual move up once everyone has stopped caring.
📌 Conclusion:
Right now, I prefer not to touch DOGE at all — even in futures. But trust me, this little guy’s moment will come.

DOGEUSDT Bearish Reversal Setup From Resistance Area(AI) Trade Setup Analysis
Timeframe: 1D (Daily)
Position Type: Short (Sell)
Entry Point: 0.2380
Positioned exactly between the stop loss and take profit zones, providing a balanced short entry from a key resistance level.
Stop Loss (SL): 0.2460
Placed above the resistance zone to protect against a bullish breakout. Risk is approximately +3.36% from entry.
Take Profit (TP): 0.2200
Target set at a significant support area, offering a potential downside of around -7.56% from entry.
Risk/Reward Ratio: 2.25
A moderate but favorable setup with more than double the reward compared to the risk.
Technical Outlook:
DOGEUSDT is approaching a resistance zone after a short-term bounce. This area could act as a ceiling, potentially triggering a retracement toward the $0.2200 support.
Bearish Scenario: Rejection at 0.2380 could open the way for a move toward the 0.2200 target.
Bullish Invalidation: A sustained close above 0.2460 would invalidate the bearish outlook and could trigger further upside.
Summary:
This setup aims to capture a potential short-term reversal from resistance with a clearly defined stop and target, supported by a favorable risk/reward ratio.

Weekly trading plan for DOGE Last week, BINANCE:DOGEUSDT showed strong growth and is now in a correction. At the moment, the price reacted from the moving averages and has impulsively broken this week’s pivot point at 0.225 . Therefore, as long as we stay above 0.218 , the target remains the 0.2440–0.257 range.
If support breaks, I’ll be watching the 0.205–0.193 zone.
More details are in the idea video. Also, let me know which format you prefer — photo with description or video format?

doge buy midterm"🌟 Welcome to Golden Candle! 🌟
We're a team of 📈 passionate traders 📉 who love sharing our 🔍 technical analysis insights 🔎 with the TradingView community. 🌎
Our goal is to provide 💡 valuable perspectives 💡 on market trends and patterns, but 🚫 please note that our analyses are not intended as buy or sell recommendations. 🚫
Instead, they reflect our own 💭 personal attitudes and thoughts. 💭
Follow along and 📚 learn 📚 from our analyses! 📊💡"

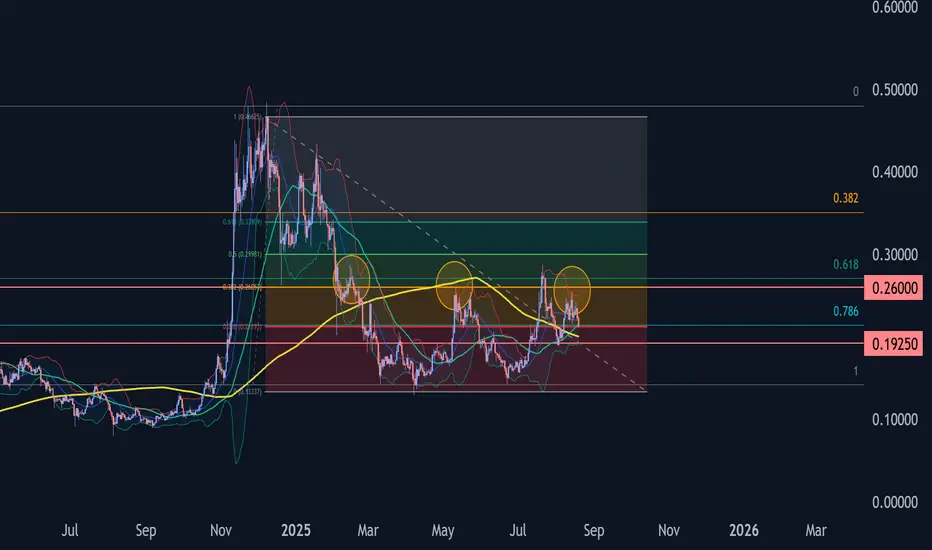
Dogecoin Wave Analysis – 19 August 2025
- Dogecoin reversed from resistance zone
- Likely to fall to support level 0.1925
Dogecoin cryptocurrency recently reversed down from the resistance zone located between the strong resistance level 0.2600 (which has been reversing the price from the start of May) and the upper daily Bollinger Band.
The downward reversal from this resistance zone created the daily Japanese candlesticks reversal pattern Bearish Engulfing -which started the active impulse wave 3.
Given the widespread bearish sentiment seen across the cryptocurrency markets today, Dogecoin cryptocurrency can be expected to fall to the next support level 0.1925.
DOGE 4H Trendline Break, Is 0.19 Next?Dogecoin has lost its rising trendline support and is now trading below it. Price is compressing under trendline resistance with momentum indicators showing overbought on the 4H Stoch RSI.
Failure to reclaim the broken support suggests sellers remain in control.
Next key demand zone sits around $0.190.
Only a breakout above trendline resistance would flip the bias back toward bullish continuation.
Current structure favors downside continuation unless bulls step in quickly.

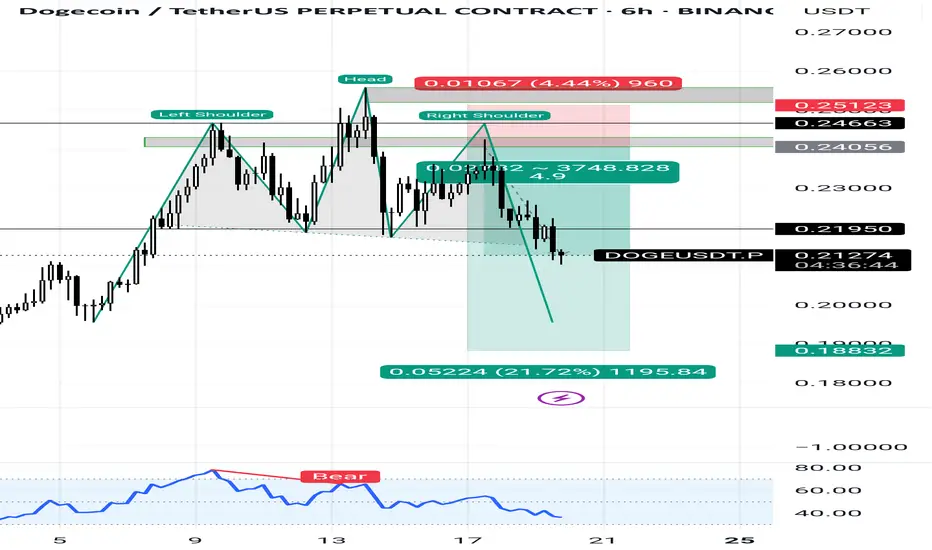
Doge update 2Doge moved nicely according to the idea what i last shared that doge forming head and shoulder pattern
Dogecoin Teeters on $0.21 Support as Bears Regain ControlBINANCE:DOGEUSDT is flashing a clear bearish warning as it hovers around the $0.21 support level. A break below this zone could trigger a slide toward $0.18, marking a potential 15% decline. Technically, the momentum has already turned negative: the Bull-Bear Power (BBP) indicator has flipped red, confirming that BINANCE:DOGEUSDT sellers are gaining control and retail buyers are pulling back. Structurally, this confirms bearish continuation unless $0.23 is reclaimed soon.
What makes this setup worse is the on-chain data. HODL Wave metrics show the 6–12 month and 1–3 month cohorts — typically less reactive than short-term traders — are now reducing their positions. Their combined decline signals fading mid-term conviction.
Simultaneously, 76.95% of DOGE’s supply remains in profit, a level that has previously triggered sell-offs. Last time this metric hit similar highs, Dogecoin tanked from $0.22 to $0.19. Until that resets, every price rally faces strong profit-taking pressure. With weakening momentum and fragile holder behavior, downside risks are for BINANCE:DOGEUSDT real unless bulls step in fast.

Dogeusdt I think doge looks solid to me as soon as btc breaks 20k doge will fly quickly Macd looks good . It just broke resistance so I expect it to keep rising also alt season still has more room to growth

Sellers Tighten Grip on DOGE — $0.20 in SightDOGEUSDT has clearly transitioned from its earlier bullish phase into a decisive downtrend. After peaking near the 0.248–0.250 zone, price has been consistently printing lower highs and lower lows, confirming that sellers have taken control. The rejection around this major resistance has set the tone for a gradual but steady decline.
On the current 1H chart, candles are closing below the short-term moving average, and every attempt at a bounce (seen from the “B” buy signals) has been weaker than the last, showing fading buyer strength. The 0.23378 level is now acting as a strong short-term resistance where sellers have been quick to re-enter. Above that, the zone between 0.24676 and 0.24859 remains the critical ceiling for any bullish attempt.
Support on the downside is stacked quite close, starting with 0.22426–0.22420, which is being tested. A confirmed break here could open the path toward 0.22117, then the more significant 0.21127–0.20900 range. If selling pressure accelerates, the psychological 0.20000 level could be tested, and deeper targets such as 0.19560 and even 0.18845 may come into play.
Volume and price behavior suggest that sellers are dominating momentum. Sharp rejections after sell markers, combined with the lack of bullish engulfing patterns, indicate that downside continuation is more probable than a reversal at this stage.
Trading Idea (Bearish Bias) 📉
• Entry: ~0.22420 on breakdown confirmation
• Stop Loss: Above 0.23378
• Targets: TP1: 0.22117, TP2: 0.21127, TP3: 0.20000, TP4: 0.18845
It’s recommended to take partial profits at each target and trail the stop loss to protect gains if the drop extends.

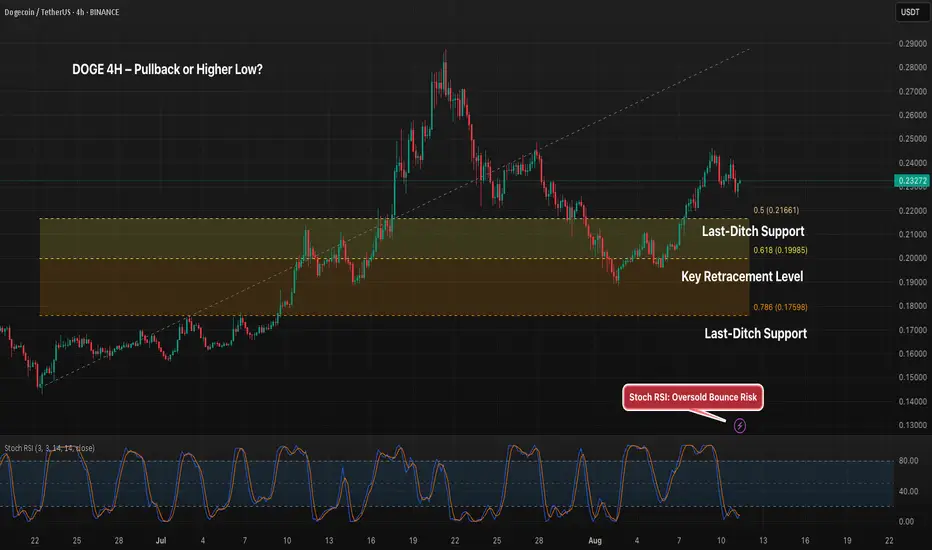
DOGE 4H – Holding Above 0.5 Fib, Can Bulls Push Higher?DOGE is holding above the 0.5 Fib retracement at $0.2166 after a strong move up from August lows. Stoch RSI is curling upward from oversold territory, suggesting a potential shift in momentum. A push above $0.245 could signal trend continuation toward $0.26, while losing the $0.2166–$0.1998 support range risks a deeper retrace toward $0.1759.
DOGE COIN 1. Trend Analysis
Recent Trend: DOGE recently had a strong bullish move, but has since formed lower highs, suggesting a short-term correction or consolidation.
The price appears to be forming a bullish descending wedge, typically a continuation pattern in an uptrend.
2. Key Support & Demand Zones
Purple Box (POC/Volume Profile Area): High-volume node indicates a strong demand zone, likely between $0.210 - $0.220.
Horizontal Blue Support Lines:
$0.20009 – Significant psychological and historical support.
$0.19001 – Prior consolidation level.
$0.18006 – Stronger support zone from earlier price accumulation.
These levels would be the likely bounce areas if price corrects deeper.
