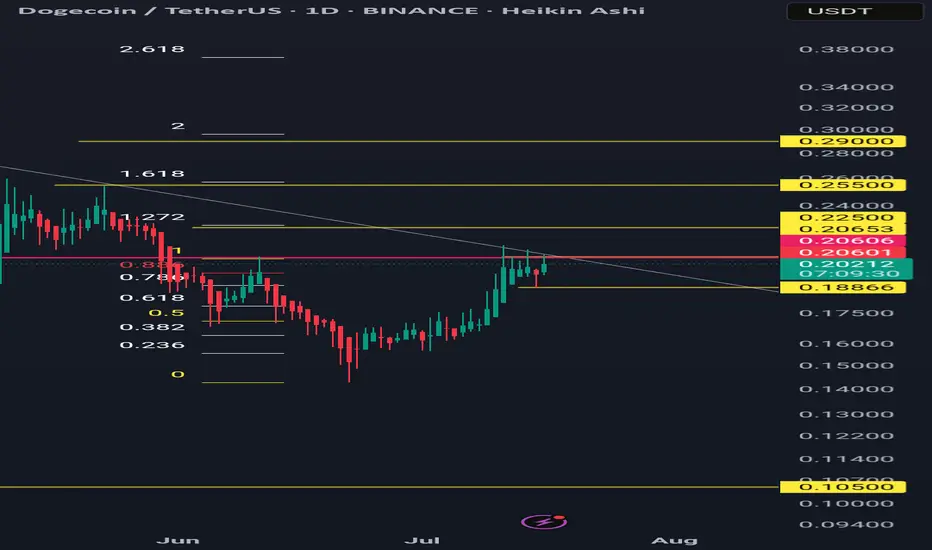
Dogeusdt bullish iH&S/cup&handle pattern in daily tfForming a bullish pattern and a close above 0.206 in daily time frame may activate the pattern.
Targets are 0.225, 0.255 and 0.29
Invalidation below 0.1886
DOGEUSDT trade ideas
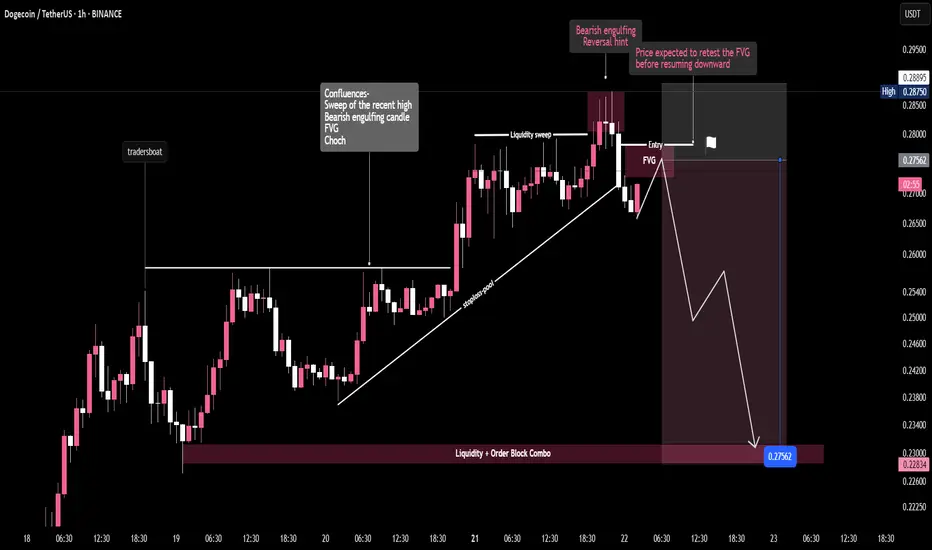
DOGE/USDT -1H "Dogecoin Fakeout? 🚨 Liquidity sweep followed by a bearish break – Smart money eyes the FVG for re-entry. Targeting the demand zone below. Patience is profit. 💰📉"
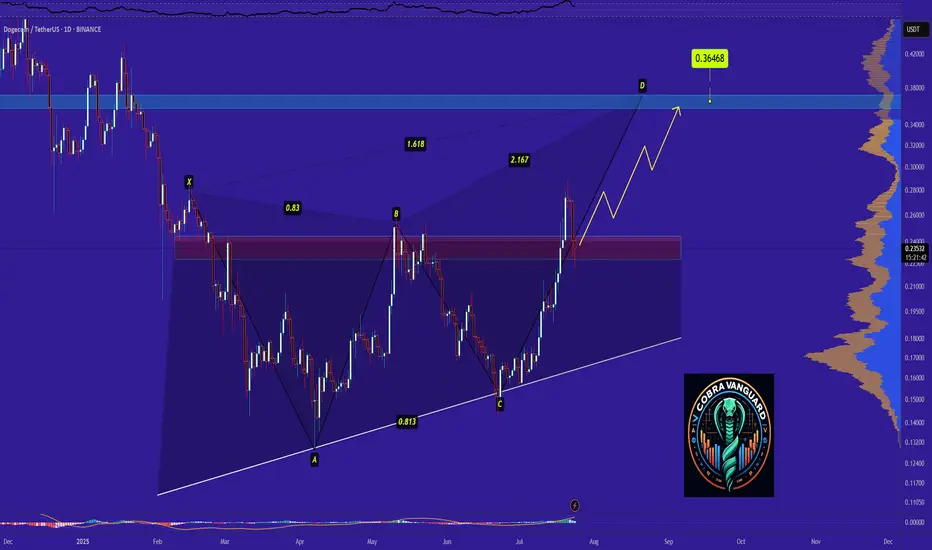
Dogecoin Ready for PUMP or what ?Dogecoin has completed and broken the ascending triangle in the daily timeframe, The price is currently supported well, which can increase the price. I expect the price to rise to around 0.36 .
Stay Awesome , CobraVanguard
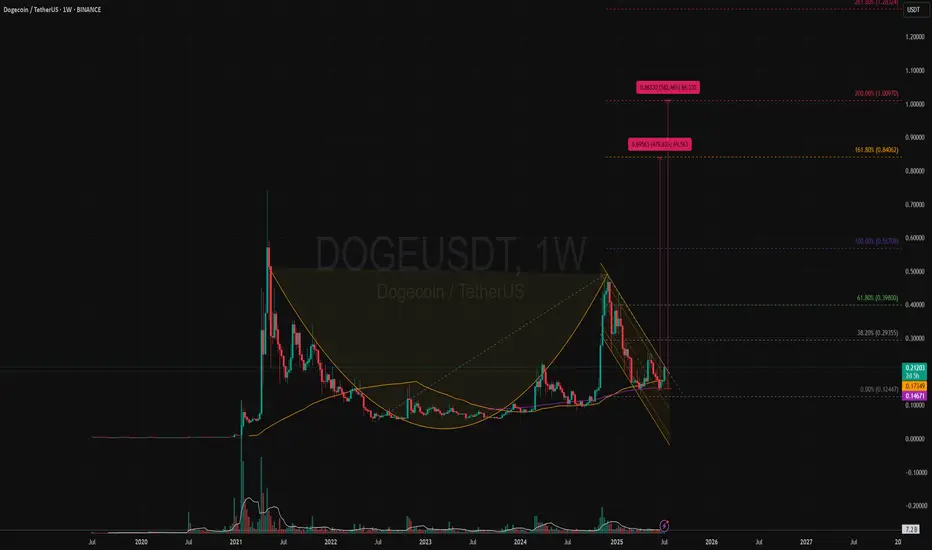
DOGEUSDT | Bullish Cup & Handle Revisiting Target +500% (1 USD)?Price Action and Chart Pattern Analysis:
DOGE cup bottom happened around $0.05 with the rim around $0.48. That gives a depth of roughly $0.42. If the breakout occurs near the rim, the measured move target would be $0.90 zone.
This aligns with several analyst projections suggesting DOGE could reach $0.90 to $1.00 if the breakout confirms.
Another way to project this cup & handle is the fibonacci-based target. These levels suggest that if DOGE breaks above the handle and sustains momentum, $0.85–$1.00 is a realistic zone for profit-taking at 161.8% and 200% extension as 1-2-3 wave pattern.
Reliability of the Cup and Handle Pattern for DOGE
The cup and handle is a classic bullish continuation pattern, but when applied to Dogecoin, its reliability depends on several dynamic factors:
Strengths of the Pattern in DOGE’s Context
Historical Accuracy: DOGE has previously respected technical patterns like rounded bottoms or (THE CUP) and breakout channels (THE HANDLE), especially during alt coin rallies.
Current Setup: a well-formed cup and handle on DOGE’s weekly chart, with price rebounding from $0.14 and testing resistance at $0.2 zone which also the key resistance SMA50W and the downtrend channel (the handle)
WATCH OUT: still a possible throw-under pattern or a final bear trap liquidity below previous low!
Key Action: If breakout confirmed with volume > Follow BUY | if not, wait for retraced SMA20 or breakout support.
Always trade with affordable risk and respect your stop...
accumulation phase means bullish sentiment We are seeing a bullish scenario in an accumulation phase, we should be seeing doge test the 200 ema before bouncing back or test the 20 ema before bouncing back. we see a change in character which as short lived after a day's breakout. After a 7 day's rally after breaking out of the 200 ema, we see a pull, I THINK WE SHOULD BE SEEING MORE OF THAT UNTIL BUYERS ARE CONVINCED THE MARKET IS NOT JUST FOLLOWING THE SUMMER RALLY TREND

Trading plan for DOGELast week, BINANCE:DOGEUSDT rode the market wave with solid gains. Now we're in a correction phase, sitting right at the weekly pivot point. Here's the breakdown:
Upside potential: Needs to cleanly break and hold above $0.257 to target new local highs
Current reality: While below the weekly pivot, odds favor more downside toward $0.20
Trade the reality until the market proves otherwise. Watch those levels and let price lead the way.

DOGE Strategy — Momentum Entry, MA Trend Hold, Pullback PhaseThis chart showcases how the MACD Liquidity Tracker Strategy performed on DOGE over the past several days. The strategy entered during a clear momentum breakout and trended cleanly above its MA filter for nearly 48 hours.
Let’s break it down:
🔹 First Signal: Early compression breakout long, but price stayed flat. This entry was managed with a tight close before the second impulse began.
🔹 Second Long: Clean breakout on rising momentum — confirmed by MACD histogram expansion and strong Stoch RSI crossover.
🔹 Trend Structure: MA support held multiple times during this move, reinforcing the uptrend. Dotted trendline shows price respecting structure cleanly.
🔹 Exit Trigger: Price began consolidating and histogram showed waning momentum. The strategy correctly exited before the full reversal began.
🔹 Current Action: Pullback in progress. MACD histogram flipping red, Stoch RSI resetting. This may just be a correction… or the trend might be breaking.
📊 This setup is a textbook use of trend filters, confluence, and exit logic — and a good reminder that the strategy isn’t just about entry… it’s about managing exits with discipline.
Whether this develops into a higher low continuation or rolls into full reversal, momentum confirmation is key before the next entry.
#DOGE #TradingStrategy #AlgoTrading #MACDStrategy #QuantTrading #CryptoTechnicalAnalysis #PriceAction #TrendFollowing #Backtesting #CryptoCharts

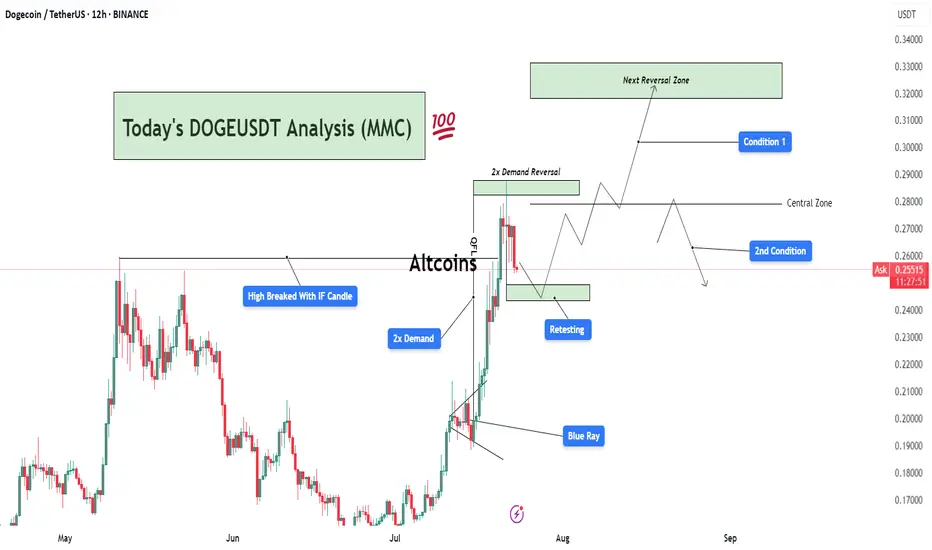
DOGEUSDT Analysis : Demand Zone Retest Before New Highs Target📊 Overview:
Today's DOGEUSDT analysis (12H chart) under the Mirror Market Concept (MMC) framework reveals a potential bullish continuation or corrective phase based on two major conditions. The market structure is transitioning after a strong impulsive move, triggered by a 2x Demand Zone breakout, and is now in the retesting phase.
🔍 Key Technical Breakdown:
High Broken with IF Candle:
A significant previous swing high was broken decisively by an Initiation Flow (IF) candle, indicating institutional activity or aggressive buying pressure.
This confirms a shift in market structure toward a bullish trend.
2x Demand Zone:
This zone has served as a strong base for price accumulation and an impulsive breakout.
The market responded well with a sharp rally post this demand, validating it as a critical support.
Blue Ray Zone (Support Zone):
The bullish breakout was partially driven by this inner trendline zone (referred to as Blue Ray), where price respected the rising support channel before breakout.
This shows smart money liquidity engineering prior to the breakout.
Retesting Zone:
Currently, the price is retracing toward a previously broken demand zone.
If this zone holds, it could provide an optimal entry for continuation.
📈 Two Scenarios (Conditions):
✅ Condition 1: Bullish Breakout to Next Reversal Zone
If the retest holds and price prints bullish confirmation (e.g., engulfing or pin bar), we can expect price to move up toward the next key reversal zone between $0.3100–$0.3300.
This zone is marked as a potential supply/reversal zone, where large sell-offs may occur.
This path follows the continuation structure under MMC, aligning with trend-following buyers.
⚠️ Condition 2: Failure to Hold Demand → Deeper Pullback
If the current demand zone fails to hold and price re-enters below the central zone (~$0.2700), we could expect a deeper correction.
Price may then revisit lower demand regions, potentially toward $0.2200 or lower, depending on rejection strength.
📌 Important Notes:
The central zone acts as a pivot level, defining whether bulls or bears gain short-term control.
Monitor the reaction from retesting area closely — candle confirmation is key before any trade execution.
This chart follows Mirror Market Concepts (MMC), combining smart money behavior, demand/supply reversal logic, and psychological market zones.
💬 Final Thoughts:
DOGEUSDT is currently in a critical phase. The market has shown strength, but now it's about confirmation. Patience is key — wait for a clean break or rejection around the retesting zone to determine the next direction. The analysis favors bullish continuation, but being flexible with both scenarios gives traders an edge.
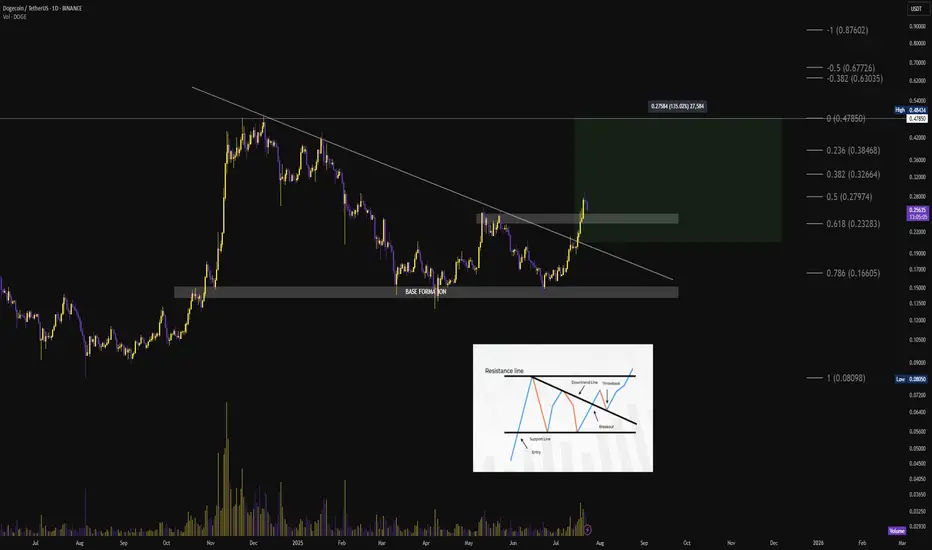
$DOGE Daily [Descending Triangle Breakout] Structure: Descending Triangle into Breakout
Duration: ~9 months (October 2024 – July 2025)
🟩 Breakout Level:
→ $0.24
🟩 Fib-Based Targets:
→ $0.28 (0.5 fib)
→ $0.32 (0.382 fib)
→ $0.38 (0.236 fib)
→ $0.48 (full move completion)
🟥 Invalidation: Close below $0.22 would invalidate the breakout and re-enter previous consolidation zone
Strong volume expansion. Breakout clean. Momentum trending upward post-retest with no immediate overhead resistance until $0.32
Textbook pattern resolution with major upside room — meme king waking up again.
#DOGE #Altseason #MemeCoin #DOGECOIN
Doge
• Current Price Level: The current price is 0.25770 USD, with a decrease of 0.01323 USD (4.88%).
• Support and Resistance Levels:
◦ Key Resistance: Around 0.25770 USD (red line), which is currently a critical level to test. Breaking this could push toward the 0.30000 USD marked level.
◦ Key Support: At 0.14280 USD (green line). If the price drops below this, it might fall to 0.11000 USD.
• Trend Line: The white diagonal line indicates a previous downtrend that has recently been broken. This could signal a shift to an uptrend, but it needs confirmation with higher volume.
• RSI (Relative Strength Index): At the bottom of the chart, RSI has moved out of the oversold territory (below 30) and is around 40-50. This suggests selling pressure is easing and it may soon enter a neutral or bullish zone (above 50).
• Trading Volume: The recent increase in volume as the price approaches resistance indicates buyer interest, but sustained volume is needed to confirm an uptrend.
• Patterns: The price movement forming a wavy (W-shaped) pattern near resistance could indicate consolidation. A decisive break above 0.25770 with a confirmation candle could activate the next target.
Conclusion: The chart suggests DOGE is at a pivotal price point. Breaking the 0.25770 resistance could confirm an upward move, otherwise a drop to the 0.14280 support is possible. It’s recommended to use a stop loss below the support and monitor trading volume. For real-time data, I can search if you’d like.

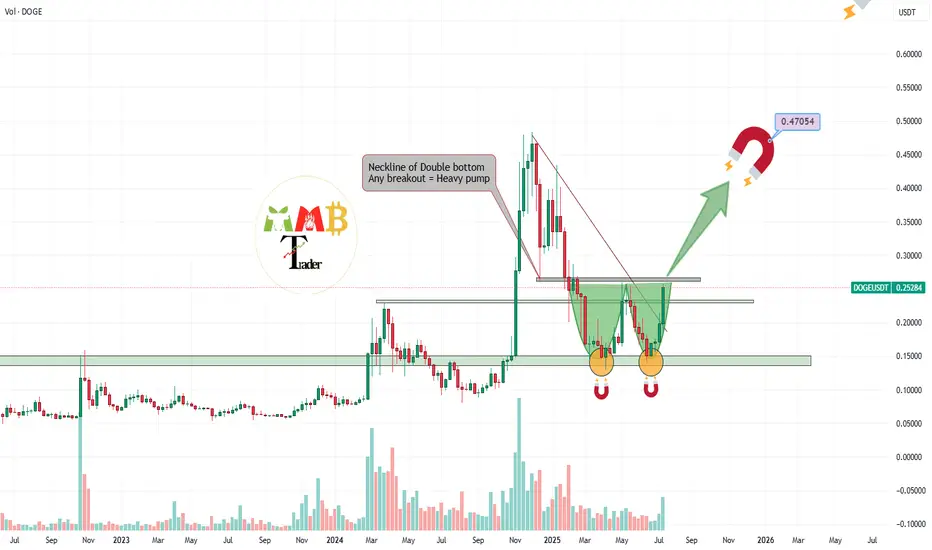
DOGEUSDT double bottom pattern or my Magnet pattern???So many of Traders around the world sees weekly Strong reversal pattern which is double Bottom and they are waiting for breakout of neckline which is last major resistance of 0.26$ and i think soon it can break the resistance and heavy pump ahead after breakout is expected.
But you may be wrong the upcoming pump here is due to my magnets on chart.
find them all and see how it pump price.
Who finds all targets for BINANCE:DOGEUSDT ?
But remember and never forget this was not
DISCLAIMER: ((trade based on your own decision))
<<press like👍 if you enjoy💚
DOGE LONG TRADE SETUPDOGE/USDT is currently in a correction zone. There's a high chance it will retest the entry price before resuming its upward momentum.
#DOGEUSDT – Major Breakout Signals Strong Long-Term Momentum Dogecoin is showing significant bullish structure on the weekly timeframe, having broken out of a long-term descending trendline and reclaimed key horizontal support around $0.20–$0.22.
🔹 Key Technical Developments:
✅ Breakout above multi-month trendline resistance
✅ Retest and reclaim of major horizontal support zone
🔼 Price now forming higher highs and higher lows
📈 Path to next resistance zone: $0.48–$0.52
🎯 Long-term target zone: $0.75–$0.85
📌 Key Levels to Watch:
Support: $0.20 (horizontal) & uptrend line
Mid-Term Resistance: $0.48–$0.52
Long-Term Target: $0.75–$0.85
With weekly structure shifting bullish and trendline broken, DOGE could see a strong continuation if BTC remains stable. Ideal for swing/position traders.

DOGE/USDT : eyes More Gains – Mid-Term Targets Up to $0.70! By analyzing the Dogecoin chart on the daily timeframe, we can see that since our last analysis around 7–8 months ago, the price started its rally from $0.10 and surged over 370% to reach $0.48. After that, it corrected back to around $0.13 and is currently trading near $0.27. If Dogecoin manages to hold above $0.25, we can expect further upside movement in the mid-term. The next targets are $0.287, $0.32, $0.41, and $0.70.
Please support me with your likes and comments to motivate me to share more analysis with you and share your opinion about the possible trend of this chart with me !
Best Regards , Arman Shaban

DOGE – Strong Uptrend Confirmed by Aroon Indicator
DOGE is flashing a powerful bullish signal, with its Aroon Up indicator reading a perfect 100%. The Aroon indicator helps identify the strength and direction of a trend by tracking how recently price has made new highs or lows. A 100% Aroon Up reading means that the most recent highs are happening consistently within each period of the indicator’s lookback window.
Currently, DOGE is trading at price levels last seen in February, and the persistent new highs confirm a strong and steady uptrend. This setup suggests bullish momentum is not only intact but accelerating, as DOGE continues to push into higher territory with each candle.
Ask ChatGPT

DOGEUSDT Above Key SupportHi there,
DOGE/USDT looks bullish at H1 with two potential price targets for a bias of 0.2290.
The price made a higher low at the 0.1900 area zone and pushed above the key level of 0.1990, and it is hovering above this level. Now, as long as the 0.1900 sustains the 0.1963 low, then the price will rally to previous highs.
Happy Trading,
K.

Bullish DOGE Setup: $0.60, $0.80, and $1 Main TargetsHello✌
Let’s analyze Dogecoin’s upcoming price potential 📈.
BINANCE:DOGEUSDT , I expect a long-term upward bullish trend.
There are three main targets in this analysis: $0.60, $0.80, and a final target of $1. These targets could be reached within 2 to 6 years.
The price may form parallel channels at times, which are shown on the chart. There is also a strong trendline and a good daily support level backing this movement.
✨We put love into every post!
Your support inspires us 💛 Drop a comment we’d love to hear from you! Thanks , Mad Whale🐋
🐋Many of the points and levels shown on the chart are based on personal experience, feeling, and over 7 years of research and daily study of crypto charts.
Some of the lines, channels, and price zones are drawn to make the chart easier to understand and to help imagine possible future price movements.
I’ve also included one very big drop in price even bigger than the others because in the crypto market, it’s common for prices to suddenly fall hard and push out small investors and traders with positions.
The targets on the chart are not guaranteed; they might be reached, or they might not.📚
📜Please make sure to do your own research before investing, and review the disclaimer provided at the end of each post.

$DOGE Potential koreksi Analyst 🧠 Brief Analysis of the DOGE/USDT Chart (1H Timeframe)
1. Supply Zone Formed
Above is the SUPPLY area (around $0.2739), where sellers previously accelerated.
The price has rejected that area and is now starting to fall below the trendline → signaling buyer weakness.
2. Trendline Break = Potential Correction
The price has broken the ascending trendline → signaling an early reversal or at least a short-term correction.
3. Downward Targets
Target 1 = $0.2550 (mild demand zone)
Target 2 = $0.2440 (strong demand zone, likely solid support)
4. Stochastic Remains Neutral, Tends Down
Not yet overbought/oversold, but starting to form a subtle downward divergence = indicating further decline.

Are you looking for a short in #DogeHi Padawans,
BTC.D is dropping from 66% to 60%, and as expected, ALTs are starting to pump.
I’m keeping an eye on DOGE and will look to take some quick short scalps once it reaches the target levels.
Best regards,
CryptoObi
DOGE | Gearing up For a BIG MOVEDoge is looking mighty bullish after establishing a clear bottom.
Together with confirmation from BTC, we can safely say that altseason is yet ahead of us. BTC's recent increase show that the bullish impulse is still upon us. And after ETH increases, the rest of the altcoin market will follow suit as per usual.
DOGE is bullish because:
✅ Clear bottom
✅ Higher lows, daily looking to reclaim the moving averages:
✅ Altseason upon us after ETH increase
Ultimately, we need to wait for confirmation - if THIS major resistance zone is cleared (in other words if daily candles close ABOVE this zone) then we're full bull mode.
________________
BINANCE:DOGEUSDT

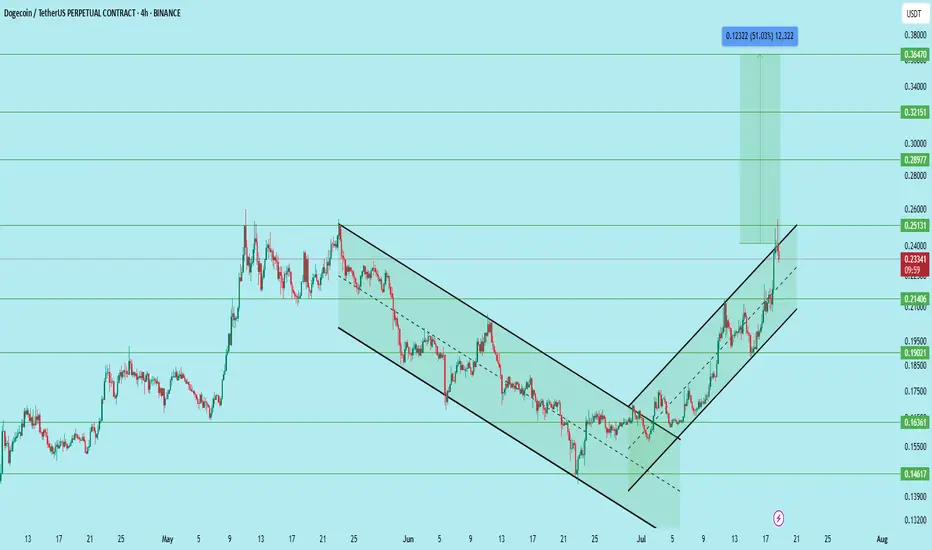
DOGE/USDT – Bullish Setup with Clear Channel BreakoutDogecoin has successfully broken out of a falling wedge and is now trending within a rising channel on the 4H timeframe. The price recently reclaimed the 0.214 support zone and is now showing continuation with strong volume and structure.
After the breakout and multiple retests, the pair offers a compelling long opportunity.
Setup Details:
Entry Zone: 0.208 to 0.214
Stop Loss: 0.186
Targets:
• 0.251 – First major resistance
• 0.289 – Mid-level breakout target
• 0.321 – Psychological round number
• 0.364 – Final target (approx. 51% move)
Technical Structure:
Breakout from falling wedge followed by bullish channel, Higher highs and higher lows clearly forming, Volume supports accumulation near breakout levels, Support holding above 0.214, confirming demand
Support Zones:
0.214 (reclaimed)
0.190 (intermediate)
0.163 (major demand zone)
Resistance Zones:
0.251
0.289
0.321
0.364
This setup offers a clean risk-reward ratio with confirmation on trend continuation. A rejection at 0.251 may present another opportunity to re-enter on a retest.
DYOR. Not financial advice.
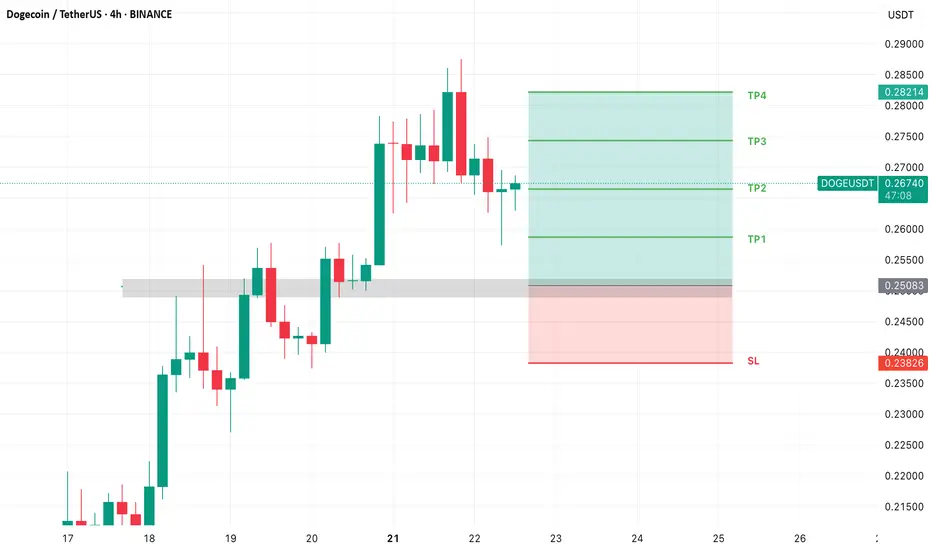
#DOGE Update #1 – July 21, 2025#DOGE Update #1 – July 21, 2025
Dogecoin has made healthy retracements after both of its last impulsive moves, maintaining a technically sound structure. I took a profit yesterday but didn’t share it due to higher risk.
Now, I've opened the Long position visible in the chart because I believe DOGE is targeting the second leg of this impulsive move, aiming for the $0.29 zone. I’m expecting approximately 6% gain from this setup.
The trend remains bullish, and pullbacks have been met with solid support, giving this trade a high probability of continuation. That said, always be cautious with sharp volatility.
