DOGE/USD: Breakdown Incoming? Supply Zone Rejection . Strong Supply Zone at $0.24009 – $0.25000
Price sharply rejected from this area, forming consecutive bearish candles.
Previous attempt in March also failed at this zone – double rejection = high supply strength.
2. Bearish Engulfing Confirmation
A bearish engulfing pattern has formed, signaling potential trend reversal after bullish momentum.
Selling pressure increasing, with volume backing the move down.
3. Support Levels to Watch:
$0.19361: Previous resistance turned support. If this breaks, further drop likely.
$0.14915: Major demand zone. High confluence from past reversals and visible range support zone.
4. Indicators:
LuxAlgo’s Supply and Demand visible range highlights high liquidity clusters at $0.15 and $0.24 zones.
Arrows suggest institutional interest near $0.15 – possible bounce zone.
---
Outlook:
DOGE appears to be in the early stages of a bearish correction after failing to break the $0.25 resistance. A clean breakdown below $0.19361 opens room to revisit the $0.15 zone, where strong historical demand and accumulation occurred. Swing traders should monitor price action closely around these key levels.
---
Possible Trade Idea:
Short Setup: Below $0.19361 with TP around $0.14915
Long Setup (Low Risk): Entry near $0.14915 with tight SL below demand zone
---
What’s Your Take?
Are you buying the dip or waiting for $0.15? Drop your analysis below, and don’t forget to like and share if you find this useful!
#DOGE #Dogecoin #CryptoAnalysis #LuxAlgo #PriceAction #Altcoins #CryptoTrading #TradingView
DOGEWBNB_4361AA.USD trade ideas

Dogecoin (DOGE) OverboughtI have been trading for a long time using the DCA strategy indicator that I have developed and I have recently published the indicator on my Tradingview page.
According to this indicator, I have been buying DOGEs at support levels with more money than I would have thrown away so far. This support level is generally seen at $0.056. In addition, I dumped some of my DOGE at $0.2285, but then bought again at $0.107. I have already shared this analysis.
I think that DOGE, which has broken through two resistances, will advance at least up to $0.75 (potential 89% return). But for this progress, I think that it must first find support at the $0.2285 level, which was broken again. This is because the indicator also gives an overbought signal. Therefore, I will tailor my portfolio accordingly. But I wouldn't be surprised if it continues relentlessly.
As long as Elon Musk remains in government, I think this cryptocurrency will be on a continuous upward trend.

DOGEUSD Massive Bull Flag targets $0.40 like late 2024!Dogecoin (DOGEUSD) is posting a Bull Flag pattern on the 4H time-frame, being supported by the 4H MA50 (blue trend-line).
A similar Bull Flag was formed at the start of its previous major rally in October 2024, which made the price jump to the 2.0 Fibonacci extension, in as much time as it took for the price to reach the Bull Flag's start from the bottom.
As a result, we expect DOGE's next short-term Target to be $0.40.
-------------------------------------------------------------------------------
** Please LIKE 👍, FOLLOW ✅, SHARE 🙌 and COMMENT ✍ if you enjoy this idea! Also share your ideas and charts in the comments section below! This is best way to keep it relevant, support us, keep the content here free and allow the idea to reach as many people as possible. **
-------------------------------------------------------------------------------
💸💸💸💸💸💸
👇 👇 👇 👇 👇 👇

DOGE - RETESTING PREVIOUS SUPPORTSGood Morning,
As you can see DOGE hit a price point level that people where not so comfortable with yet. We are seeing some strength with the coin today with it potentially closing higher than yesterday. As for right now I am not making any moves back into the coin until I see where it has closed today.
Enjoy!

DemandThis asset is currently in a downtrend, making LHs and LLs, price seems to be retreating from the .2313 area. Price may be retreating to one of key layers below. Please see chart for price action.

Weekly trading plan for DOGEIn this idea I marked the important levels for this week and considered a few scenarios of price performance
The nearest support is at $0.2186, if it is broken, the price may break the trend line
Write a comment with your coins & hit the like button and I will make an analysis for you
The author's opinion may differ from yours,
Consider your risks.
Wish you successful trades ! mura

Possible entry into the pullbackWaiting for testing on the green line and selling at a profit on the red line. this if there is no bullish trend
DOGEUSD Critical Supply Zone – Dump Incoming or Just a Fakeout?Dogecoin just rejected hard from a strong Supply Zone around $0.2400, showing a sharp intraday drop of over 8%. Is this the beginning of a deeper correction or just a healthy retrace?
Key Levels to Watch (1H Chart):
1. Resistance Zone (Supply):
$0.2400 - $0.2450: Heavy supply zone marked by LuxAlgo’s visible range. Price got sharply rejected here, indicating strong seller interest.
Expect any move into this zone to face significant resistance unless supported by volume surge.
2. Immediate Support:
$0.2027: First key demand level. A breakdown here could trigger panic selling.
Watch this level for potential bounce or breakdown setup.
3. Major Support Zone:
$0.1564 - $0.1620: High volume node + previous accumulation range.
This is where large buyers previously stepped in. If DOGE dumps hard, this is a potential long entry zone.
4. Bearish Signal:
Price created a double wick rejection at the top of the supply zone.
Red arrows suggest a potential drop to $0.2027, or even $0.1564, if volume confirms.
Potential Trade Setup:
Short Bias: If price fails to reclaim $0.2400 zone and breaks below $0.2250.
TP1: $0.2027
TP2: $0.1564
SL: Above $0.2450
Risk/Reward: High with tight stops above clear supply
Fundamental Watch:
Multiple U.S. economic events approaching (CPI, PPI). Volatility could spike around May 13–16. Combine TA with news timing!
---
Let’s discuss:
Are you shorting DOGE or buying the dip? Drop your analysis and let's trade smarter together!
#DOGE #Dogecoin #Crypto #Altcoins #LuxAlgo #TechnicalAnalysis #SupplyDemand #CryptoTrading

DOGE - Round 1 Almost Tapped!Good Morning,
hope all is well. As you can see here, we have had a great bull run which was initiated April 5th. Last week we saw a great break out from the last price structure however a quick rejection into the weekend. I am still anticipating one more run up before we consolidate again as this rejection shows some weakness in the current buying power of DOGE.
Enjoy!

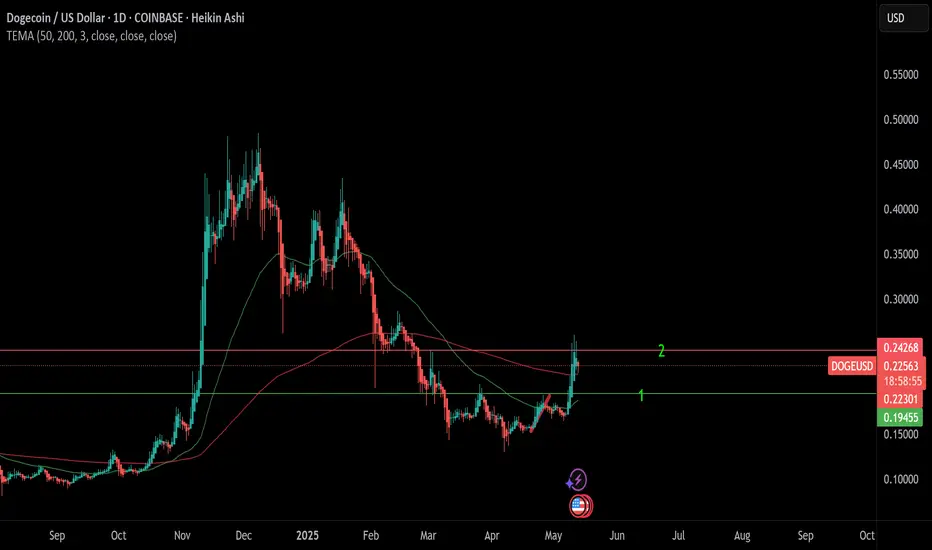
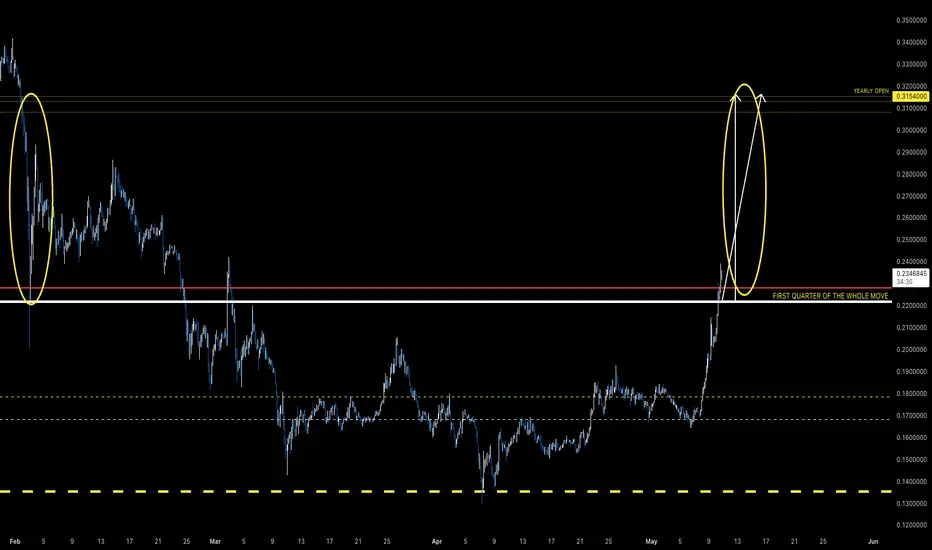
DOGEIF not in position this retest of first quarter of the whole move presents opportunity. Weekly close later today above and we're set up nicely for a run on Yearly Open at .31
Dance of the EMAsOn the 2 HR chart, the crypto asset consolidates on top of the 21 EMA, price needs to overcome .23476 price to continue the march. The 21 EMA sits over the 50 EMA which sits over the 200 EMA. If we get bearish action keep an eye on those levels, be safe and have a nice day.


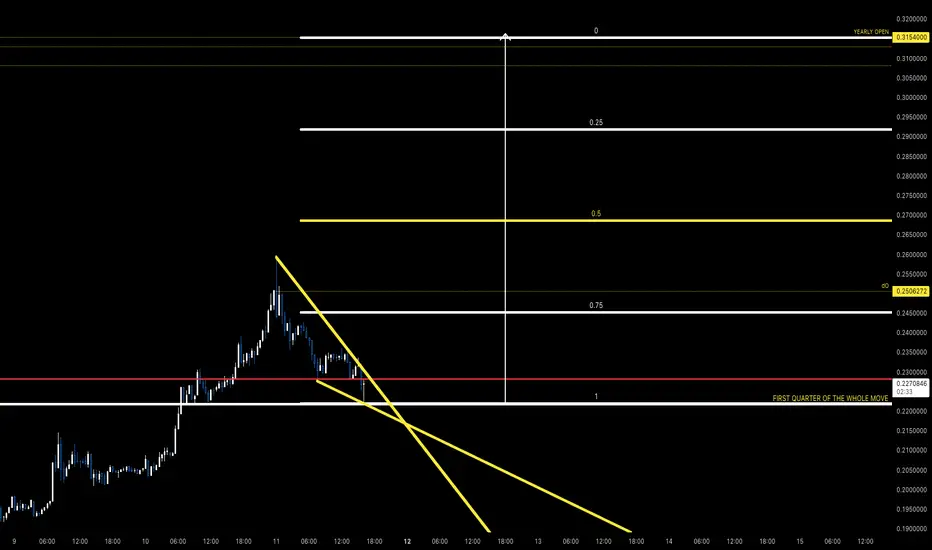
DOGEDOGE is starting to bark again... coming back up as quickly as it came down. Yearly open next target.
is ADA in the same pattern?We're observing a striking resemblance between Dogecoin's 2017 breakout pattern and Cardano's current price structure. In 2017, DOGE consolidated for months with tight EMA compression before erupting into a strong rally. ADA is now showing a nearly identical setup: prolonged sideways movement, a breakout from compression, and a surge backed by strong volume (122.47B).
Price recently reclaimed and closed above key resistance at $0.76, flipping it into support—mirroring the early breakout phase in DOGE. If the fractal holds, ADA could be entering the early stages of a significant impulse move.
Levels to Watch:
Immediate resistance: $0.895
Further targets: $1.00, $1.16, and $1.32
While history doesn’t repeat exactly, it often rhymes. This setup deserves attention as the technicals align closely with a historically explosive move.

Possible Bullish Parallel ChannelHere we have DOGE moving in an upward channel, indicators are saying asset is overbought, price has cycled to the top of the channel and could possibly breakout to the .24 cent range but a pull back to middle of the channel is possible (.21) range or to the bottom of the channel closest demand (.20) range. Have a nice day be careful.

DOGE to new ATHDOGE has been sleeping since the ATH in 2024. But has now woken up. The interest in this coin of freedom between people has again started to spike. On 21D chart there's a giant Cup & Holder with the promise of taken this coin to a minimum of $0.72 !

Cup & Holder on Doge DOGE has been sleeping since the ATH in 2024. But has now woken up. The interest in this coin of freedom between people has again started to spike. On 21D chart there's a giant Cup & Holder with the promise of taken this coin to $0.72.

DOGE looking really good🚀 DOGE is looking technically strong heading into the next potential explosive cycle. As always, crypto carries risk — the real question is: how much are you willing to lose? 🧠💸
Remember: only invest what you can afford to lose. Stay smart, stay strategic. #Dogecoin #Crypto #InvestWisely

DOGEUSD Started its final rally and can hit $1.300Dogecoin (DOGEUSD) just broke above its 1W MA50 (blue trend-line) again for the first time since March 24 2025 and is doing so after a clear rebound on its 1W MA100 (green trend-line). This is a technical bottom formation, that resembles the one on September 11 2017, right before that Cycle's final rally was initiated.
The 1W RSI has already broken above its MA trend-line (yellow) and every time that took place since October 16 2023, DOGE posted a strong rally. As you can see, the similarities between the two fractals are remarkable, both unfolding a structured bullish pattern on similar stages, with a 1W MA50/100 Bullish Cross leading to the massive Bull Flag (green) that bottomed on the 1W MA100 and initiating the parabolic rally.
In 2017 it topped on the 1.786 Fibonacci extension, so if it continues to replicate that fractal, we expect this run to hit $1.300 by the end of the year and make the Cycle's Top.
-------------------------------------------------------------------------------
** Please LIKE 👍, FOLLOW ✅, SHARE 🙌 and COMMENT ✍ if you enjoy this idea! Also share your ideas and charts in the comments section below! This is best way to keep it relevant, support us, keep the content here free and allow the idea to reach as many people as possible. **
-------------------------------------------------------------------------------
💸💸💸💸💸💸
👇 👇 👇 👇 👇 👇

DODGE LongDodge is now net long on the regression break.
I am considering all my options in the CRYPTO world.

buying??!@Dogecoin temporary buy strong corrective zone after that strong possibility of continued downward trend unless confirmed to break the general downward trend and bullish trend

DOGE Explodes +7% – Major Supply Zone Hit! Will the Rally Hold?”Dogecoin (DOGE/USD 1H) – Sharp Rally into Supply Zone!
DOGE just printed a massive +6.84% breakout, surging straight into a key supply zone between 0.1835 and 0.1900, as identified by LuxAlgo's Supply & Demand.
What’s happening:
Clean break above previous resistance at 0.1700
Entering high-volume node (0.1835–0.1900), where sellers previously dominated
RSI likely overheating on lower TFs, signaling potential short-term exhaustion
Key Zones to Watch:
Resistance: 0.18465–0.1900 (major supply = likely rejection or breakout trap)
Support: 0.1700 (former resistance now flipped support)
Demand Base: 0.1557–0.1500 (ideal long reload zone if price dips)
Scenarios:
Bullish Breakout: Clear move and close above 0.1900 = fresh rally potential toward 0.21+
Rejection Play: If supply holds, expect pullback to 0.1700 or deeper into demand zone (0.1550 area)
How I'm trading it:
Watching PA at 0.1850–0.1900 closely
Entering shorts if rejection candle confirms
Long reload only at 0.1700 or 0.1550 if structure remains bullish
DOGE moves fast — are you long or waiting for a pullback?
#Dogecoin #Crypto #DOGEUSD #Breakout #LuxAlgo #SupplyAndDemand #TradingView #CryptoTrading #Altcoins

DOGE/USDT: Descending Triangle Breakout with Bullish PotentialA weekly chart of DOGE/USDT on Binance, spanning from 2017 to early 2025 shows a clear descending triangle pattern that has formed over several years, characterized by a flat support base around $0.0030-$0.0040 (2017-2020) and a downward-sloping resistance trendline connecting lower highs over time. The price has recently broken out of this pattern and is showing signs of bullish momentum.
Descending Triangle Pattern:
- A descending triangle is typically a continuation pattern, but in this case, it acted as a reversal pattern after a prolonged downtrend. The flat base of the triangle (around $0.0030-$0.0040) served as strong support, with the price bouncing off this level multiple times between 2017 and 2020.
- The upper trendline of the triangle, which slopes downward, connected key lower highs at approximately $0.069 (2018), $0.018 (2019), and $0.010 (2020). This trendline was tested multiple times, showing consistent selling pressure at these levels.
- In early 2021, the price broke above this trendline with a strong bullish candle, accompanied by a significant spike in volume (visible at the bottom of the chart). This breakout confirmed the end of the consolidation phase and the start of a new uptrend.
Post-Breakout Price Action:
- After the breakout, DOGE/USDT surged dramatically, reaching a high of $0.737 in 2021, driven by market hype and increased adoption. However, the price then entered a corrective phase, pulling back to retest the breakout level around $0.169 in 2023. This retest is a common occurrence after a breakout, as it confirms the previous resistance as new support.
- The price has since consolidated in a range between $0.130 and $0.237, forming a rectangular consolidation zone (highlighted in yellow on the chart). This range indicates indecision in the market, with buyers and sellers battling for control.
- Recently, the price has approached the upper boundary of this range at $0.237, and the current candle (as of early 2025) shows a push towards this resistance. A breakout above this level would signal the continuation of the bullish trend.
Key Levels to Watch:
- Support Zone ($0.130-$0.150): This area has acted as a strong support during the consolidation phase. If the price fails to break above $0.237, it may pull back to this zone for another retest. A break below $0.130 would invalidate the bullish setup and could lead to a deeper correction towards $0.069.
- Resistance Zone ($0.237): This is the immediate hurdle for DOGE/USDT. A confirmed break above this level, especially with strong volume, would confirm the continuation of the uptrend.
- Next Resistance ($0.400-$0.450): The measured move of the descending triangle can be calculated by taking the height of the triangle (from the base at $0.003 to the highest point at $0.069, roughly $0.066) and adding it to the breakout point (around $0.169). This gives a target range of $0.235-$0.400. However, considering the momentum and historical price action, the price could extend towards $0.450 if bullish sentiment persists.
Volume Analysis:
- Volume spiked significantly during the breakout in 2021, confirming the strength of the move. However, during the consolidation phase (2023-2025), volume has been relatively low, indicating a lack of strong directional momentum.
- For the breakout above $0.237 to be valid, we would ideally want to see an increase in volume, signaling renewed buying interest. Without this, the breakout could be a false move, leading to a rejection and pullback.
Market Context and Risks:
- DOGE/USDT is known for its volatility, often driven by market sentiment, social media hype, and news events. While the technical setup looks bullish, external factors could impact the price. For example, a broader market downturn or negative news could lead to a rejection at $0.237.
- The weekly timeframe suggests a long-term perspective, so traders should be prepared for potential short-term volatility. Using a stop loss below $0.169 helps manage risk in case the setup fails.
