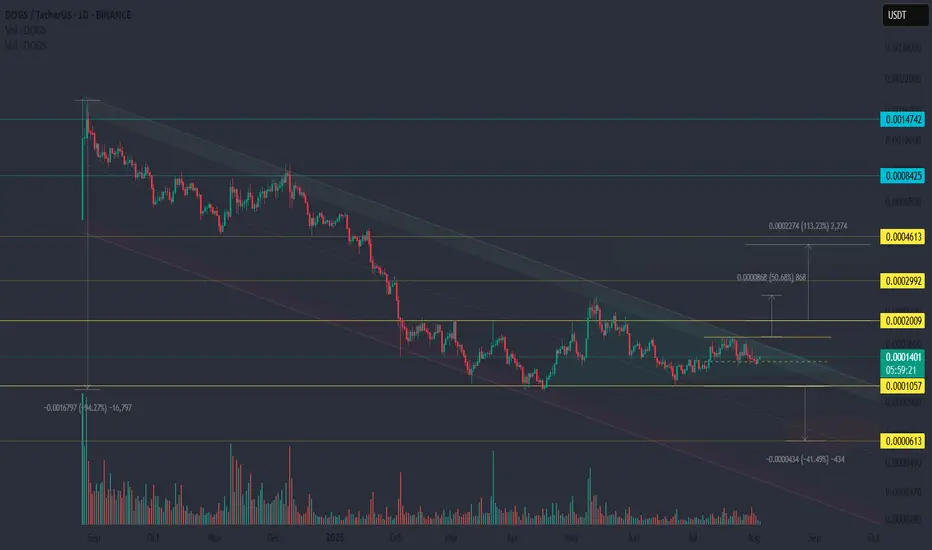
DOGS/USDT — Capitulation Zone. Is the Breakout Coming?The price has been moving sideways for several months, forming a classic low-volatility summer channel.
🔹 Primary trend: still bearish — price remains inside a descending channel
🔹 Volume: mostly low, but occasional spikes near support may signal hidden accumulation
🔹 Formation: a triangle is formi
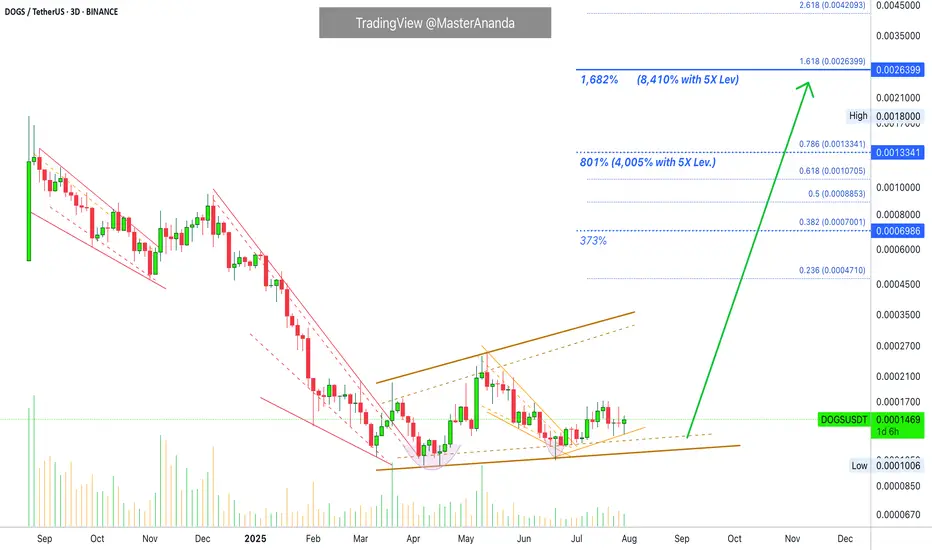
Dogs 5X Leveraged Trade-Setup (8,410% Profits Potential)Dogs continues to consolidation at bottom prices producing higher lows. With each passing day/session and candle, DOGSUSDT gets closer and closer to a strong bullish breakout. If you remember recently this pair produced for us more than 800% profits with 7X, the entire move was about 150% strong, be
#DOGS/USDT – Launchpad or Breakdown?#DOGS
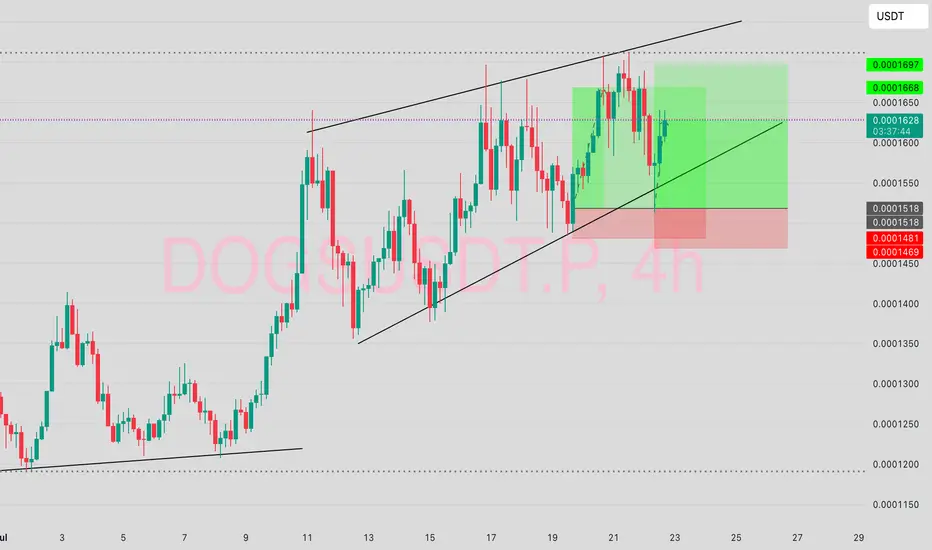
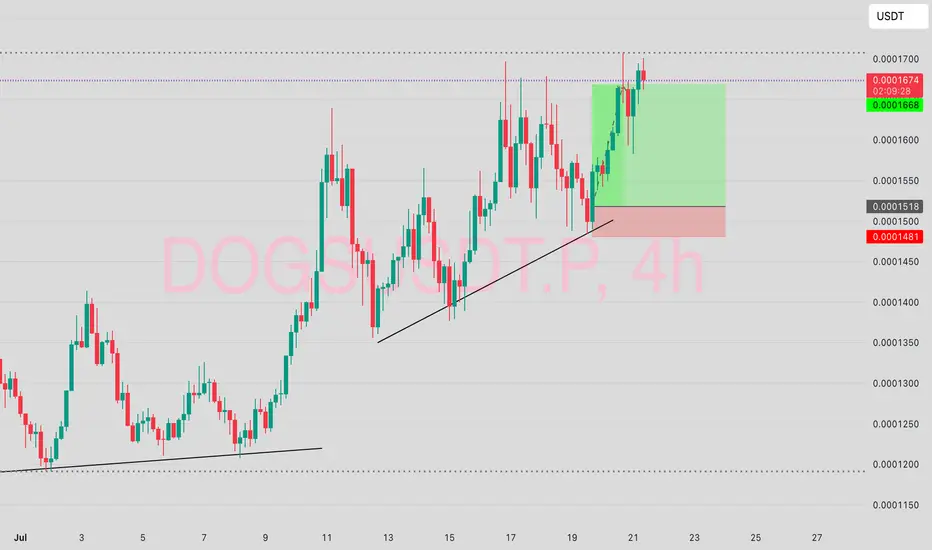
The price is moving within an ascending channel on the 1-hour frame, adhering well to it, and is poised to break it strongly upwards and retest it.
We have support from the lower boundary of the ascending channel, at 0.0001300.
We have a downtrend on the RSI indicator that is about to break

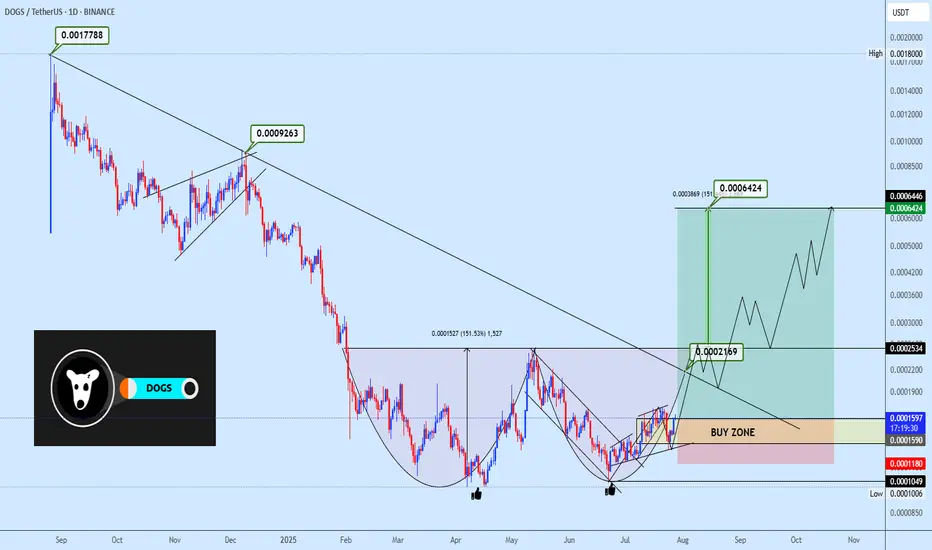
Dogsusdt double bottom formationDOGSUSDT is exhibiting a micro double bottom formation, with price rebounding from a previous support zone. The strategy is to accumulate within the highlighted area and monitor the neckline reaction around 0.0002534. A breakout above this level would validate the entire double bottom structure and
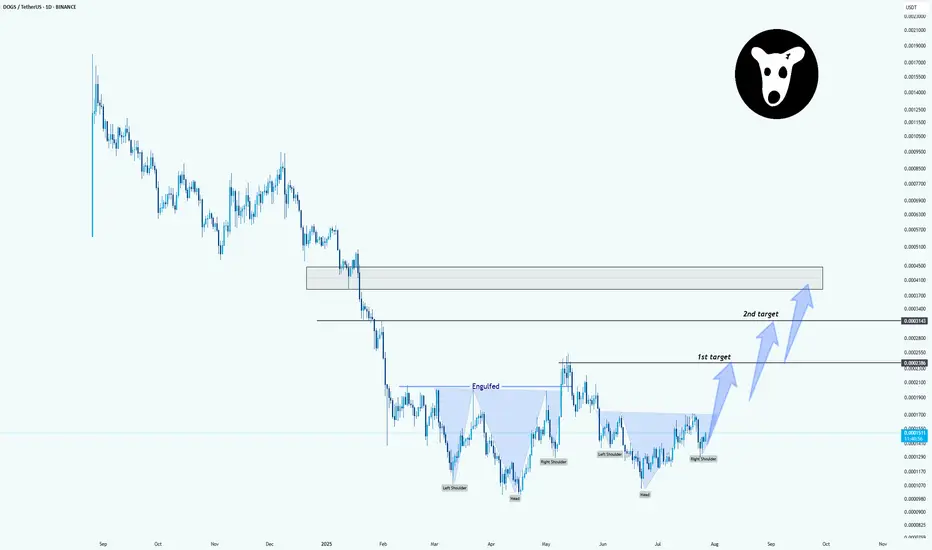
DOGSUSDT: Inverse Head & Shoulders Pattern in PlayHello.
The chart clearly shows an inverse head and shoulders formation. Price has now formed:
Left Shoulder
Head
Right Shoulder (recently completed)
The neckline was engulfed after a strong move, which adds confidence to the breakout potential. If the price continues to hold above the right shoul
#DOGS/USDT#DOGS
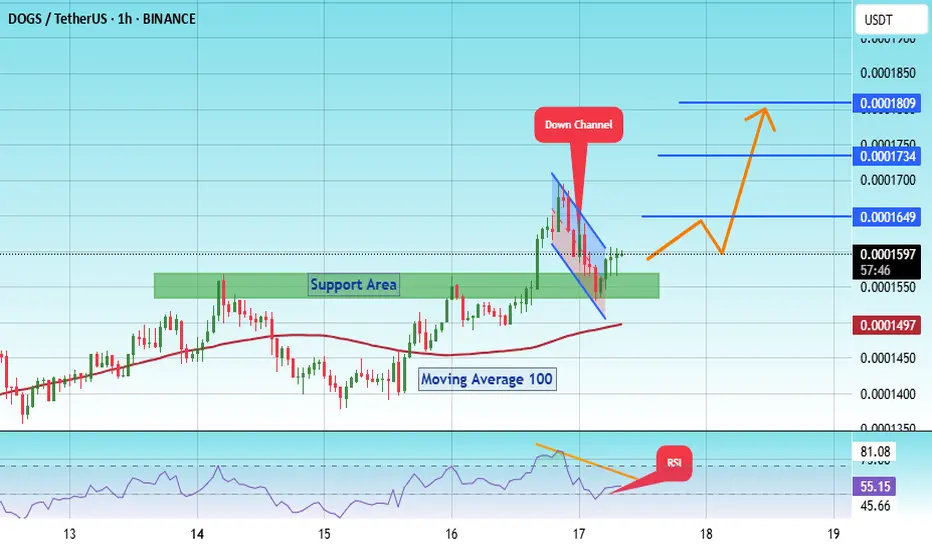
The price is moving within a descending channel on the 1-hour frame, adhering well to it, and is poised to break it strongly upwards and retest it.
We have support from the lower boundary of the descending channel, at 0.0001432.
We have a downtrend on the RSI indicator that is about to break

$DOGS Bite???How sweet of a trade here on BYBIT:DOGSUSDT.P 🤩🤩🤩
Running as fast. who released the SEED_ALEXDRAYM_SHORTINTEREST1:DOGS ?
I'm not chasing them, they should run their fastest.
Sipping my juice🥤
$DOGSHere's my BYBIT:DOGSUSDT.P
My regard to my SEED_ALEXDRAYM_SHORTINTEREST1:DOGS for the 1:4RR
Every weekend should be like this, don’t you think say?
#DOGS/USDT#DOGS
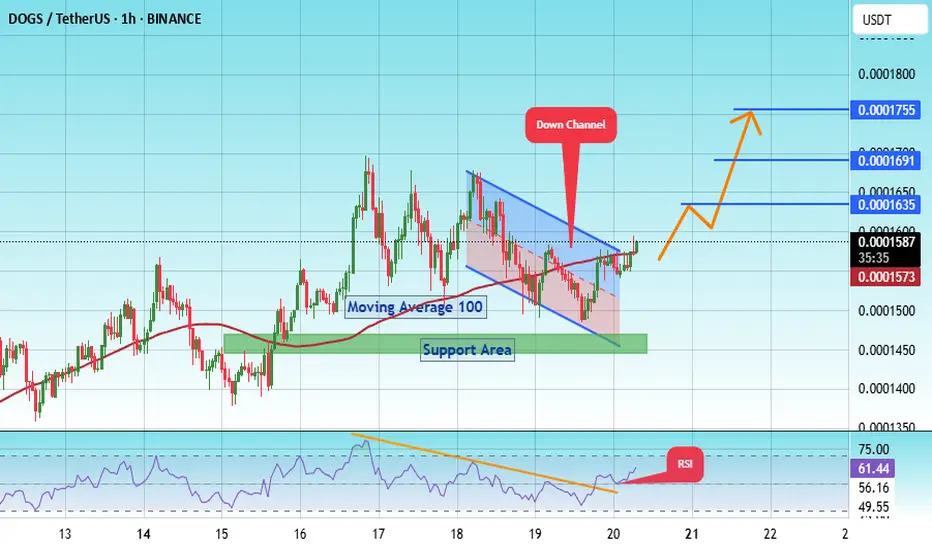
The price is moving within a descending channel on the 1-hour frame, adhering well to it, and is poised to break it strongly upwards and retest it.
We have support from the lower boundary of the descending channel, at 0.0001485.
We have a downtrend on the RSI indicator that is about to break
#DOGS/USDT – Launchpad or Breakdown?#DOGS
The price is moving within a descending channel on the 1-hour frame, adhering well to it, and is on its way to breaking it strongly upwards and retesting it.
We have a bounce from the lower boundary of the descending channel. This support is at 0.0001500.
We have a downtrend on the RSI indic
See all ideas
Summarizing what the indicators are suggesting.
Oscillators
Neutral
SellBuy
Strong sellStrong buy
Strong sellSellNeutralBuyStrong buy
Oscillators
Neutral
SellBuy
Strong sellStrong buy
Strong sellSellNeutralBuyStrong buy
Summary
Neutral
SellBuy
Strong sellStrong buy
Strong sellSellNeutralBuyStrong buy
Summary
Neutral
SellBuy
Strong sellStrong buy
Strong sellSellNeutralBuyStrong buy
Summary
Neutral
SellBuy
Strong sellStrong buy
Strong sellSellNeutralBuyStrong buy
Moving Averages
Neutral
SellBuy
Strong sellStrong buy
Strong sellSellNeutralBuyStrong buy
Moving Averages
Neutral
SellBuy
Strong sellStrong buy
Strong sellSellNeutralBuyStrong buy
Displays a symbol's price movements over previous years to identify recurring trends.