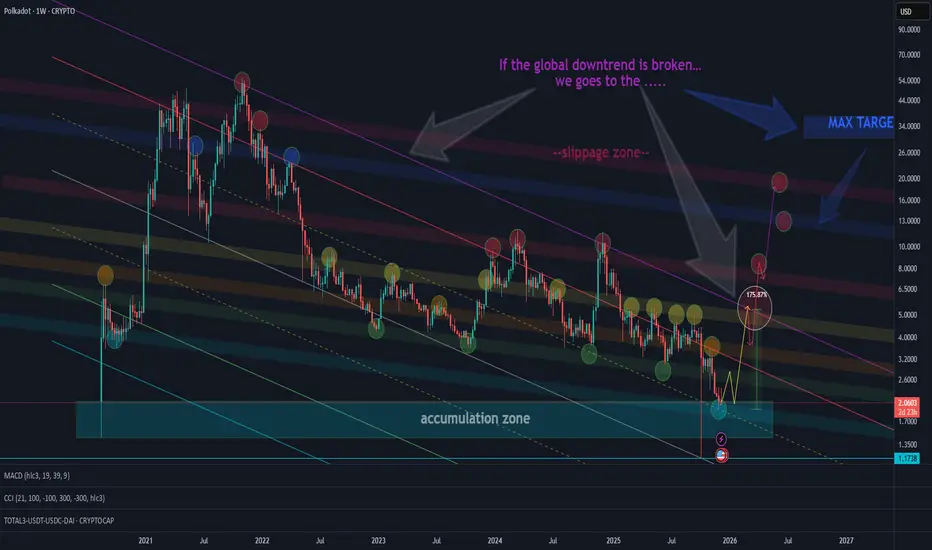
POLKADOT DOT DOTUSD 1W TFThe chart shows support and resistance levels as well as the targets up to the global descending channel.
If the global downtrend is broken - the maximum target is the blue zone.
The red zone represents a short-squeeze area originating from the blue zone — which may or may not occur and the sque
DOTDear Traders
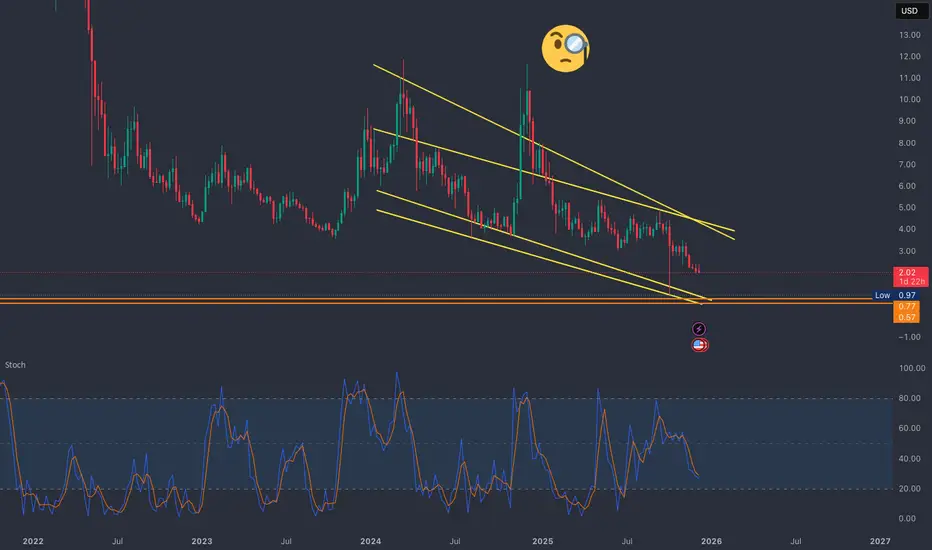
heres a deep analysis on dot on weekly clear down trend no? lets see if it can play on weekly
The DOT XRP MigrationXRP and DOT are currently the same price. XRP it looking oversold on some charts while DOT is undersold and is currently the lowest price it's been on Coinbase USD. I can see it going to $11 if bitcoin pumps to 100k soon. The CME gap has still not been closed at $117k so we'll see how things go but

Polkadot Crashes to 2.00 – Breakdown Fully ConfirmedDOT just dropped -7.5% and is now sitting at 2.04, confirming a full structural breakdown. No bullish MSB in sight, and price continues setting lower lows.
RSI is deeply oversold at 24, but MACD still shows no reversal signal. Until bulls flip 2.60–2.80, this trend remains heavily bearish.
Momentu

DOTUSD Update Double bottom failed to hold on weekly & monthly timeframe
But this descending wedge support has been touched. Hopefully this holds. Yes, hope, as it's hard to know anymore with these alts.
DOT vs SOL - Place your betsDOT will outperform SOL in % return
The volume node intersects beautifully with the first horizontal resistance and the moving average, so I am confident
Not financial advice

$DOT / Polkadot - Life SupportWith price coming out of the accumulation range in a downtrend and collapsed under weekly mitigated support/demand.
Price is now retesting this weekly level in a textbook 'break & retest'.
Bulls need to reclaim this area for a chance, other than that it could be curtains.

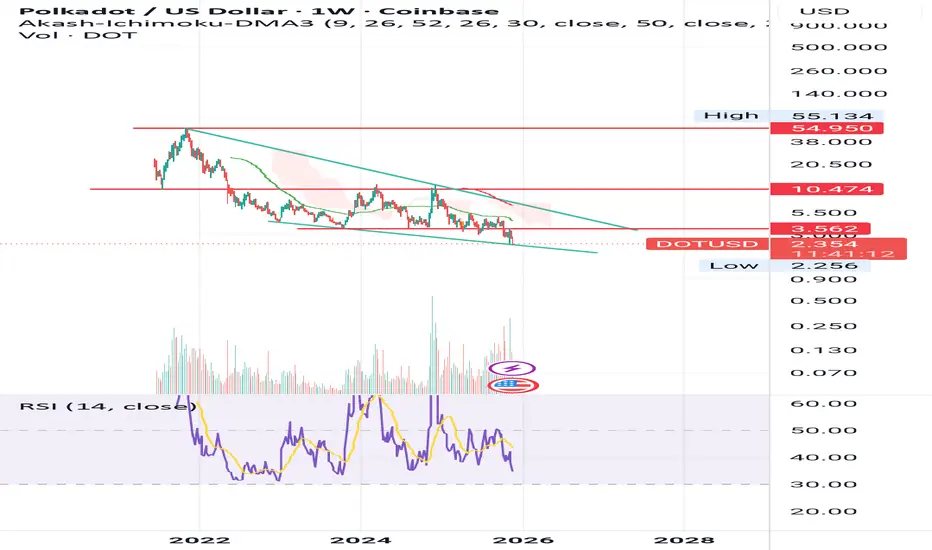
DOT Q4 swingInteresting to see DOT taking 2020 lows, last time this happened we saw price rising to $55.
Q4 looks like buyers will take control, we will have to keep a close eye on lower time frames specially the monthly and weekly for more data.

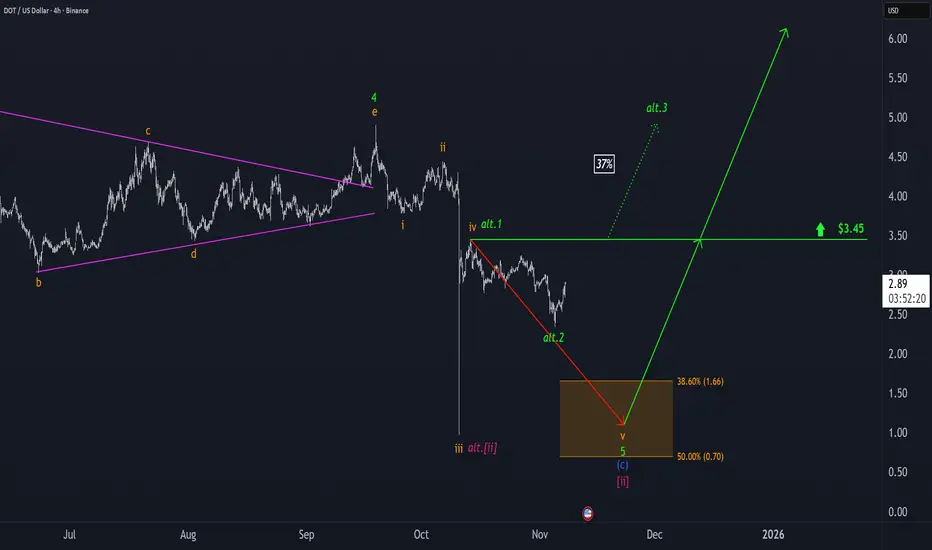
Polkadot: Ready to Bounce Straight Back Up?For now, we continue to expect that DOT will be sold off into our orange Target Zone between $1.66 and $0.70—which could offer attractive long entry opportunities – and complete magenta wave . However, we estimate there’s a 37% chance that the significant low is already in place and that the altcoi
DOT/USDHow to become classy and how to move beyond the Jones.
waiting for confirming PA over several months, before entering, waiting for yearly close and how price behavior with dynamics play out in and around key levels.

See all ideas
Summarizing what the indicators are suggesting.
Oscillators
Neutral
SellBuy
Strong sellStrong buy
Strong sellSellNeutralBuyStrong buy
Oscillators
Neutral
SellBuy
Strong sellStrong buy
Strong sellSellNeutralBuyStrong buy
Summary
Neutral
SellBuy
Strong sellStrong buy
Strong sellSellNeutralBuyStrong buy
Summary
Neutral
SellBuy
Strong sellStrong buy
Strong sellSellNeutralBuyStrong buy
Summary
Neutral
SellBuy
Strong sellStrong buy
Strong sellSellNeutralBuyStrong buy
Moving Averages
Neutral
SellBuy
Strong sellStrong buy
Strong sellSellNeutralBuyStrong buy
Moving Averages
Neutral
SellBuy
Strong sellStrong buy
Strong sellSellNeutralBuyStrong buy
Displays a symbol's price movements over previous years to identify recurring trends.
Curated watchlists where DOTUSD.P is featured.

Gen 3 crypto: A new day dawns…
25 No. of Symbols

Interoperability Crypto: Communication station
14 No. of Symbols

Polkadot Ecosystem: Spot the best
19 No. of Symbols

Proof of Stake: Seeking validation?
26 No. of Symbols

Smart contracts: Make the smart decision
36 No. of Symbols

Staking Coins: Pick up a stake
18 No. of Symbols

Top altcoins: Choose your alternatives carefully
28 No. of Symbols
See all sparks