Inverted s-h-s for DOT $63 soon!We can see an inverted s-h-s formation inside the channel. DOT just crossed to the next level of the channel.
By knowing parachains are now happening, we can be quite sure that DOt will be one of the biggest gainers during this Q4 and Q1 2022.
I expect the price action to go up to $63 by November.
Appreciate the hard work by clicking like
Happy trading,
Raf
Market insights

DOT- Added swing tradeHi,
As most of you will already know my strategy, I won't go into much detail. But put simply...I sell 33% at every major resistance and buy the 33% on support of the next major pullback. This has helped me accumulate a LOT more than I would have if I just held.
Today I have added a swing trade from $45 with the target of $50. The price looks to close higher than any other local high and the momentum should quickly push this up to Target.
Good luck if you join


DOT Short againSome pullback needed before it continues the uptrend.
How deep it is depends on the profit taking happening with ETH and BTC.
The whales are in control as usual.

Polkadot Price AnalysisDOT is trading within a tight range after bouncing off the psychological level of 40 earlier in the week. On Wednesday, the altcoin has been on a rebound for two consecutive sessions. Subsequently, it hit an intraday high of 45.53 on Thursday before pulling back. On a three-hour chart, it is trading above the 25 and 50-day exponential moving averages.
In the immediate term, I expect the crypto to trade within the horizontal channel of between Thursday’s high of 45.53 and along the 25-day EMA at 42.65. Above the channel’s upper border, the bulls will strive to retest the year’s high of 49.75. On the flip side, a move below the lower border will likely have the bears retesting the support zone of 40.00.
Feel free to get in touch for premium trade signals

DOT following the trendDOT got support with the 40$ support area and should now head to 48$ resistance.
Nothing to do at the moment, as the buying opportunity was on support as stated in my previous idea.
Let's wait and see how DOT will react on resistance but for now MACD in Weekly, Daily and H4 are well bullish.

DOT - READY TO BREAKOUT AND TEST/BREAK ATH!ALTS ARE LOOKING GOOD TODAY! BTC looking like its pulling back to turn previous ATH into support!
This is a perfect opportunity for alts to catch up and do their thing here!
DOT - IS LOOKING READY TO BREAK OUT AND POSSIBLY BREAK ATH VERY SOON!
BBWP FLASHED A BUY SIGNAL!
MACD looking EXACTLY how we want to see it before a pump!
This is a low risk situation IMO!
GET READY, ITS LOOKING TO BE A GOOD DAY FOR ALTS!

DOTUSD-H4- Bearish CrabPattern is near completion at 46.70
Im placing a sell limit order there.
The ratios are perfect 0.61 - 1.61
Best regards.

Polkadot Update: 11% away from ATH next Target $73 @ 161.80%Polkadot Update 20/10/21: 11% away from ATH @ $49.45, the next Target $73 @ 161.80% Fibs. Happy Trading
Polkadot Update 19/10/21: Bullish Bias still holds! Please See Previous analysis below. Buy Signal from Script triggered on the 1st August: Fast EMA Crossover Slow SMA .
Confirmed reversal, Polkadot Buy Signal from Script triggered: EMA Crossover SMA just below the 23.60% fibonacci level, 43% gain from here to retest the 200 MA. Use buy zone to map your buys. Swing target from here is 160% gain from $18.92 to $49.75.
Current Price Targets: 20/10/21
127.20% Fibs @ $60.08 (35% Gain from current price level)
161.80% Fibs @ $73.59 (66% Gain from current price level)
261.80% Fubs @ $112.66 (155% Gain from current price level)
Happy Trading :)
See previous analysis below.
Polkadot (Dot) Buy opportunity! Potential 50%+ Gain to set a New ATH of $50 at the 161.8% Fibonacci Level. Dot's price soared to a high of $42 on 20/02/21. Since setting this new ATH , it has lost some momentum, retracing down to a low of $26 on the 23/02/21 after such an impulsive move, but currently it is still trading 45% above this low 4days ago on the 23/02/21.
The fundamental outlook for Dot in the long-term is great and still very much bullish , its total Market Cap is at $33.7 billion and currently ranked 6th biggest digital currency in the world after Bitcoin , Ethereum , Cardano , Binance Coin and Tether. Over the coming month we expect Dot to retest the previous ATH of $50 at the 161.8% Fibonacci extension .

DOT LOOKING HOT... WHERE TO GET IN?POLKADOT is looking to be one of the few alts looking good here ALTHOUGH I DO THINK WE WILL SEE ETH, ADA, and some others picking up soon. (maybe BNB, XRP, SOL... we'll get to that!)
Personally I'd be looking to get in on this one after a pullback and anything above 34.00 I CONSIDER BULLISH
If we get some upwards consolidation as I predict we will, we can watch for Head & Shoulder patterns (INVERSE AS WELL) OR just good old bull flags however H&S Patterns REALLY GIVE NICE ACCURATE TARGETS!
This will be a good one to watch and if it breaks out to the upside WE WILL LOOK AT THE DOTBTC CHART for potential targets while it is in price discovery mode!
I DO THINK DOT is very overdue for a breakout so I do see good potential here!

PolkaDot DOTUSDT - HUGE Secret Ascending Channel + New ATH soon- Polkadot is strong on the daily timeframe , as we can see.
- The price broke out of the bullish falling wedge and now is unstoppable!
- On the daily time scale, we can spot a huge blue parallel channel , which acts like a support and resistance.
- Target top of the chanel or 1:1 fib extension on the daily chart.
- For expected duration of the trade, probability, stop loss, profit target, entry price and risk to reward ratio ( RRR ) - please check my signature below ↓
- Due to my Elliott wave count, the correction is totally over and we can expect a higher prices!
- If you want to see more of these ideas, hit "Like" & "Follow"!

Polkadot Update: Buy Signal Script triggered: 45% Gain to $60Polkadot Update 19/10/21: Bullish Bias still holds! Please See Previous analysis below. Buy Signal from Script triggered on the 1st August: Fast EMA Crossover Slow SMA.
Confirmed reversal, Polkadot Buy Signal from Script triggered: EMA Crossover SMA just below the 23.60% fibonacci level, 43% gain from here to retest the 200 MA. Use buy zone to map your buys. Swing target from here is 160% gain from $18.92 to $49.75.
Current Price Targets:
127.20% Fibs @ $60.08 (45% Gain from current price level)
161.80% Fibs @ $73.59 (78% Gain from current price level)
261.80% Fubs @ $112.66 (173% Gain from current price level)
Happy Trading :)
See previous analysis below.
Polkadot (Dot) Buy opportunity! Potential 50%+ Gain to set a New ATH of $50 at the 161.8% Fibonacci Level. Dot's price soared to a high of $42 on 20/02/21. Since setting this new ATH , it has lost some momentum, retracing down to a low of $26 on the 23/02/21 after such an impulsive move, but currently it is still trading 45% above this low 4days ago on the 23/02/21.
The fundamental outlook for Dot in the long-term is great and still very much bullish , its total Market Cap is at $33.7 billion and currently ranked 6th biggest digital currency in the world after Bitcoin , Ethereum , Cardano , Binance Coin and Tether. Over the coming month we expect Dot to retest the previous ATH of $50 at the 161.8% Fibonacci extension .

DOT potentially on the move Cypher Cypher Harmonic on Dot. Potential move to the upside. SL @ 8.7 if you must

DOT MOVES DOT could breach above 80$ if it actually pulls backs to the 16$ level to fill my buy another... I think breaking ATH will not be possible for now

DOTUSD Bullish TargetTargeting the 1.272 Fib level which is placed within a parallel channel that can be developed
DOT has been acting very bullish lately
Hence the chart

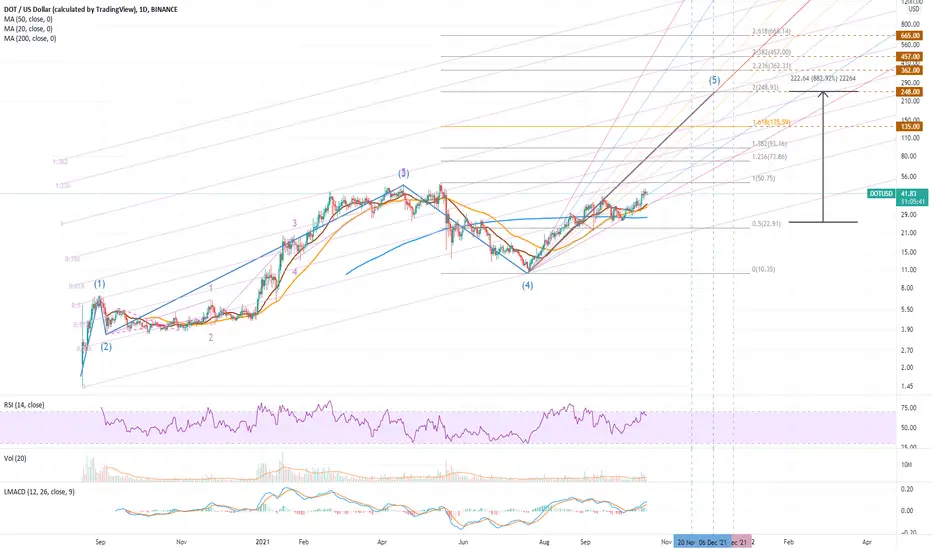
Polkadot (DOT) - Structure and TargetsA study in DOT, identifying a Fibonacci Channel containing the price action, a Pitch Fan providing lines of support and resistance, and an Elliot Wave apparently working its way towards a wave 5 climax.
What are your target levels for DOT and when will they hit?