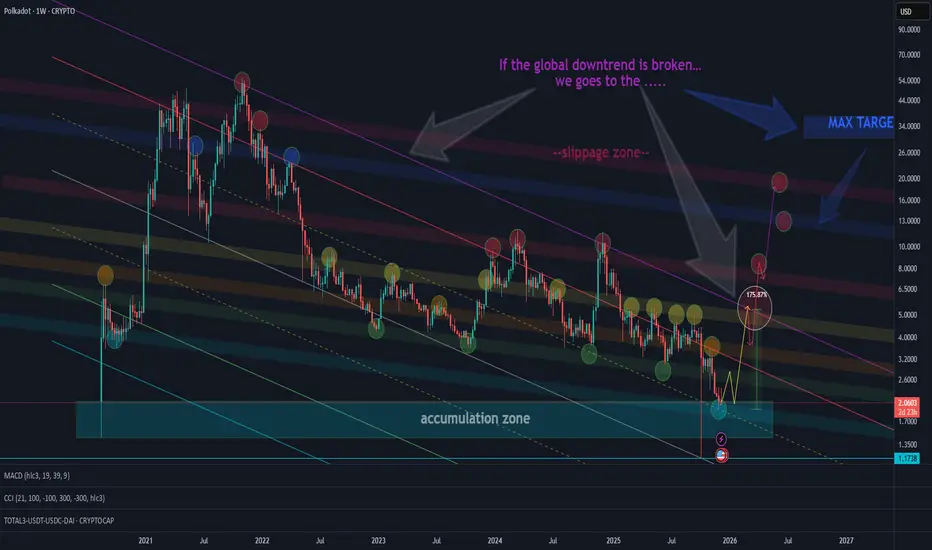
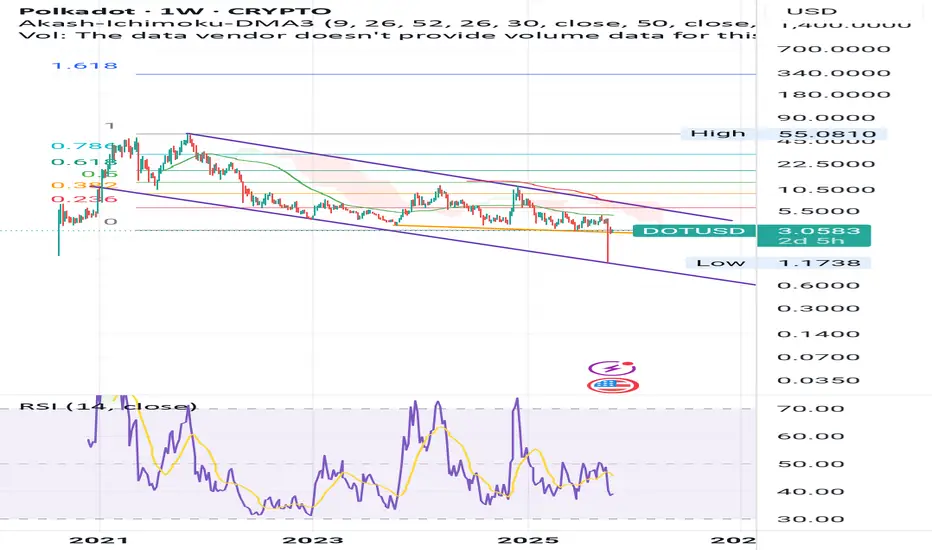
POLKADOT DOT DOTUSD 1W TFThe chart shows support and resistance levels as well as the targets up to the global descending channel.
If the global downtrend is broken - the maximum target is the blue zone.
The red zone represents a short-squeeze area originating from the blue zone — which may or may not occur and the squeeze could also happen earlier.
At the moment we are in the accumulation zone of the asset.
Market insights
DOTDear Traders
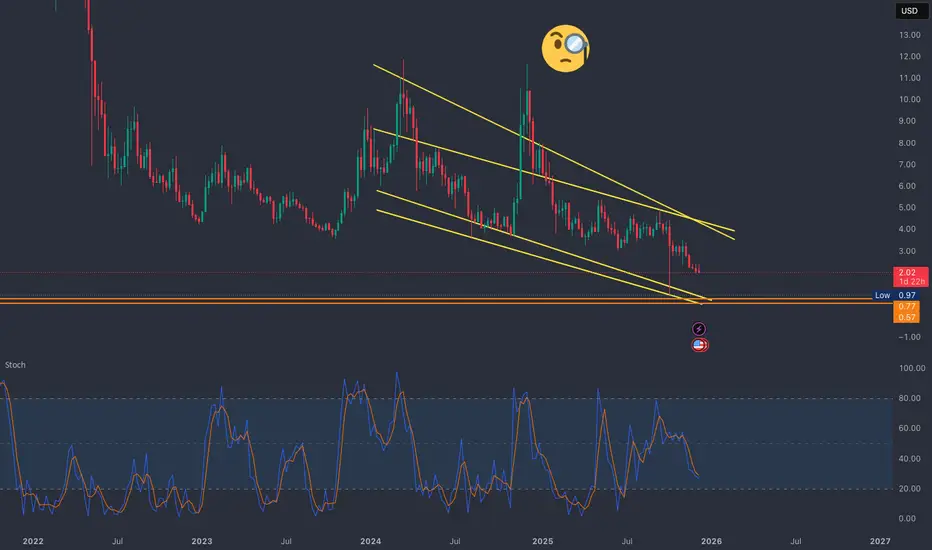
heres a deep analysis on dot on weekly clear down trend no? lets see if it can play on weekly
The DOT XRP MigrationXRP and DOT are currently the same price. XRP it looking oversold on some charts while DOT is undersold and is currently the lowest price it's been on Coinbase USD. I can see it going to $11 if bitcoin pumps to 100k soon. The CME gap has still not been closed at $117k so we'll see how things go but I'm quite bullish on DOT at the moment alongside ADA and AVAX

Polkadot Crashes to 2.00 – Breakdown Fully ConfirmedDOT just dropped -7.5% and is now sitting at 2.04, confirming a full structural breakdown. No bullish MSB in sight, and price continues setting lower lows.
RSI is deeply oversold at 24, but MACD still shows no reversal signal. Until bulls flip 2.60–2.80, this trend remains heavily bearish.
Momentum is dying fast. Breakdown is clean and active.
Bias: Bearish
Pair: DOT/USDT
Timeframe: 12H
This is not financial advice, only data analysis. Please consult a qualified financial professional for personalized guidance.

DOTUSD Update Double bottom failed to hold on weekly & monthly timeframe
But this descending wedge support has been touched. Hopefully this holds. Yes, hope, as it's hard to know anymore with these alts.
DOT vs SOL - Place your betsDOT will outperform SOL in % return
The volume node intersects beautifully with the first horizontal resistance and the moving average, so I am confident
Not financial advice

$DOT / Polkadot - Life SupportWith price coming out of the accumulation range in a downtrend and collapsed under weekly mitigated support/demand.
Price is now retesting this weekly level in a textbook 'break & retest'.
Bulls need to reclaim this area for a chance, other than that it could be curtains.

DOT Q4 swingInteresting to see DOT taking 2020 lows, last time this happened we saw price rising to $55.
Q4 looks like buyers will take control, we will have to keep a close eye on lower time frames specially the monthly and weekly for more data.

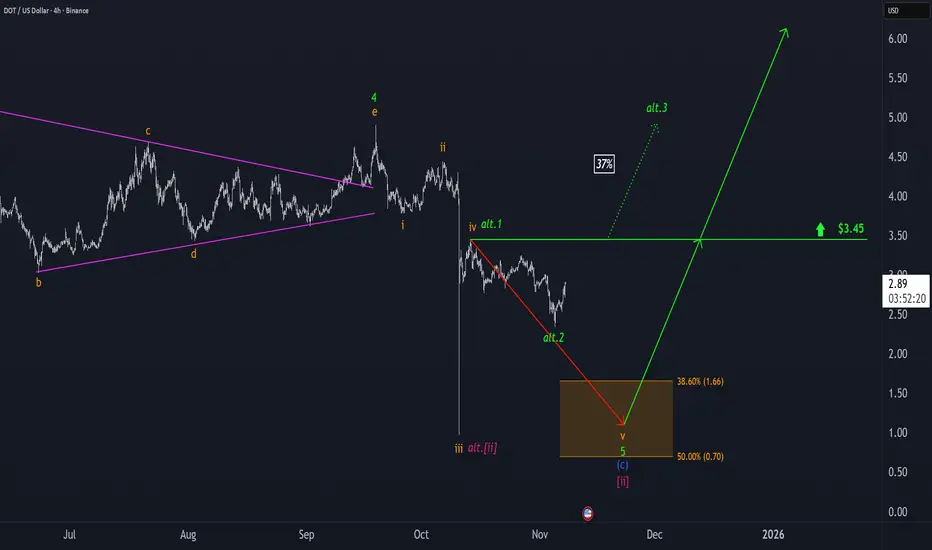
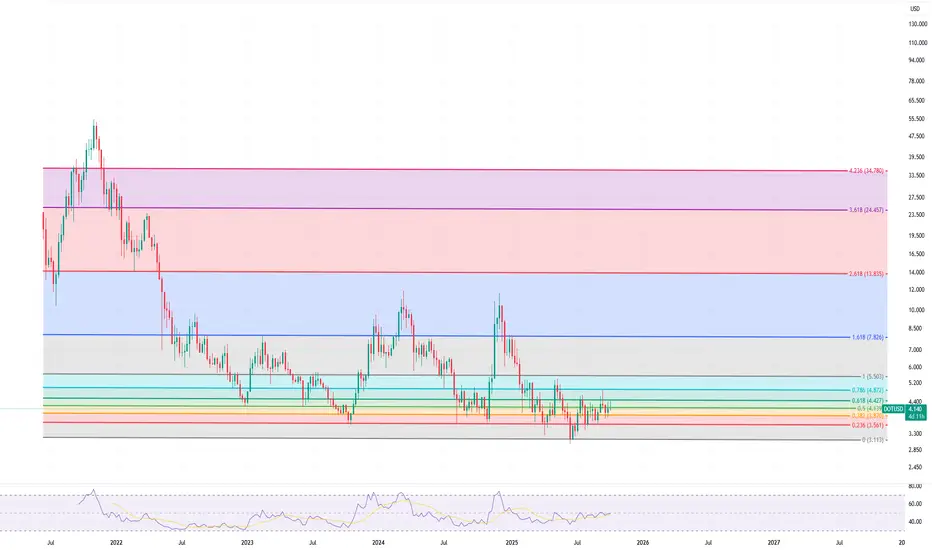
Polkadot: Ready to Bounce Straight Back Up?For now, we continue to expect that DOT will be sold off into our orange Target Zone between $1.66 and $0.70—which could offer attractive long entry opportunities – and complete magenta wave . However, we estimate there’s a 37% chance that the significant low is already in place and that the altcoin could break out directly above resistance at $3.45; in this scenario, our Target Zone would no longer be relevant.
DOT/USDHow to become classy and how to move beyond the Jones.
waiting for confirming PA over several months, before entering, waiting for yearly close and how price behavior with dynamics play out in and around key levels.

DOTUSD | Bearish Rejection at Overlap ResistanceDOT/USD is rising towards the sell entry, which is an overlap resistance and could reverse from this level to the downside.
Sell entry is at 3.065, which is an overlap resistance.
Stop loss is at 3.277, which is a swing high resistance that aligns with the 161.8% Fibonacci extension.
Take profit is at 2.806, which is an overlap support.
Stratos Markets Limited (tradu.com ):
CFDs are complex instruments and come with a high risk of losing money rapidly due to leverage. 68% of retail investor accounts lose money when trading CFDs with this provider. You should consider whether you understand how CFDs work and whether you can afford to take the high risk of losing your money.
Stratos Europe Ltd (tradu.com ):
CFDs are complex instruments and come with a high risk of losing money rapidly due to leverage. 70% of retail investor accounts lose money when trading CFDs with this provider. You should consider whether you understand how CFDs work and whether you can afford to take the high risk of losing your money.

DOTUSD le flagJust because I got minimwlly rekt by that slip it closes above the orange support and gives a clear bullish future
NOT FINANCIAL ADVICE
Polkadot: Short-Term Rally Before Potential Drop into Target ZonDOT is currently expected to move toward the high of wave iv in orange, according to our primary scenario. We continue to anticipate that this move will remain below the resistance level at $3.78. Afterward, we are primarily preparing for a wave v sell-off into the orange Target Zone ($1.66 – $0.70). In this range, we expect to see the low of wave in magenta, which should signal a potential long-term trend reversal to the upside. There is still a 30% probability that the correction low has already been completed as wave alt. in magenta. However, this alternative would only be definitively confirmed by a significant breakout above the $3.78 level.

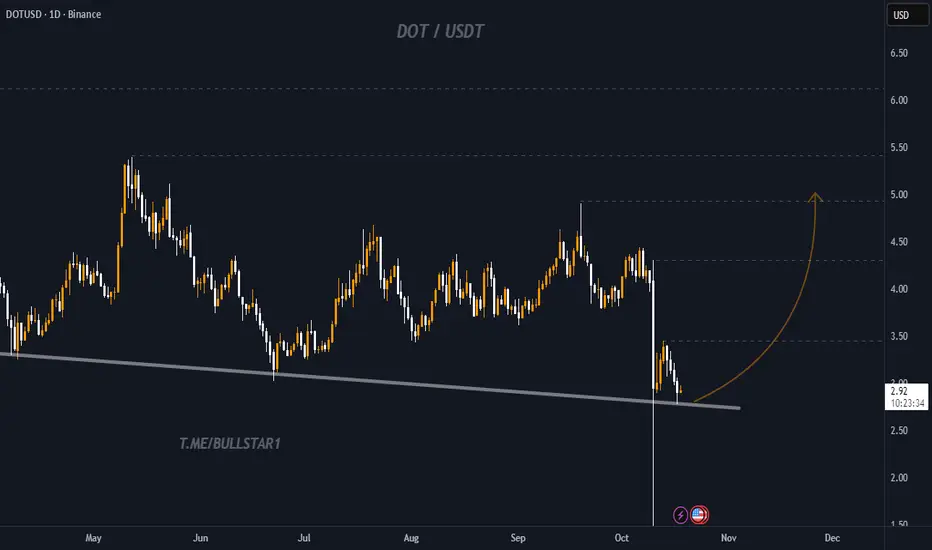
DOT / USDT – Retesting Long-Term Support | Potential Reversal AhPolkadot (DOT) is currently retesting a key long-term ascending support trendline that has held since early 2024. After a strong correction and liquidity sweep below recent lows, the price is showing signs of stabilizing around the $2.80–$3.00 area.
This zone has historically acted as a strong demand region, making it a potential accumulation area for the next bullish move. If the support holds, a rebound toward the $3.50, $4.50, and $5.00 resistance levels is likely in the coming weeks.
Technical Outlook:
- Support zone: $2.80–$3.00
- Resistance targets: $3.50 → $4.50 → $5.00
- Invalidation (Stop Loss): Daily close below $2.70
A successful bounce from this level could confirm the continuation of DOT’s long-term uptrend structure. Patience and confirmation signals are key before entering a position.
POLKADOT spring set upPolkadot has currently started phase C (SPRING) of the Accumulation: Wyckoff Events schematic #1

Polkadot is the FUTURE Hi everyone
The pic is talking to us. Polkadot has big holders. Faithful and believed ones.
Keeping the bottom for almost 3 years and still resisting it.
I am sure that it is the one cryptocurrency you will never find to hold anymore soon.

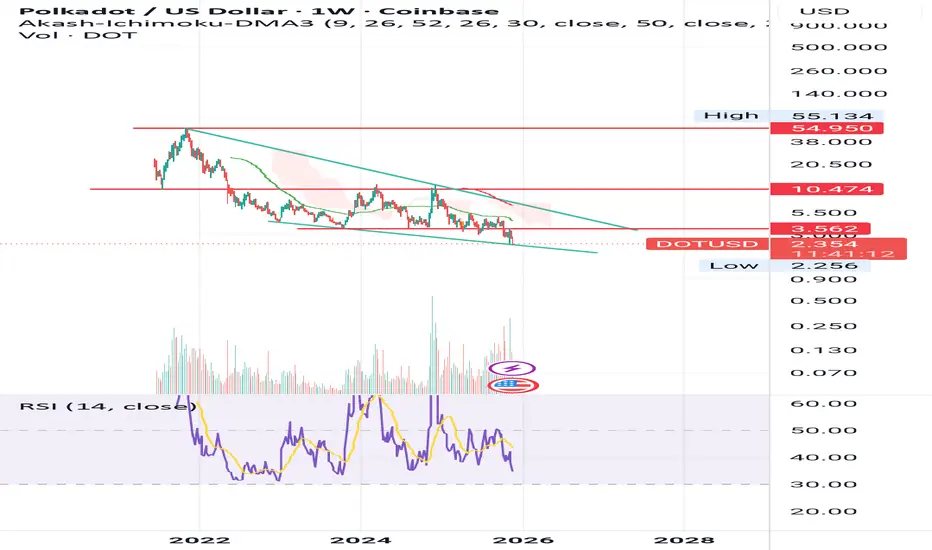
DOTUSD Can this Channel save it from complete obsolescence?Polkadot (DOTUSD) has been trading within a Channel Down since the December 26 2022 Low and it only broke momentarily during last Friday's flash crash. Having recovered instantly above it and closing the 1W candle inside the pattern, it technically counts as a Lower Low.
The last two Lower Lows (both inside 2025), delivered rebound that hit tested the 1W MA50 (blue trend-line). As a result, the obvious technical Target on the medium-term is the 1W MA50 and our (a but more conservative) estimation is $4.600, which is right on the 0.382 Fibonacci Channel level. Of course that's assuming the market doesn't close any 1W candles below the Channel Down. The current price levels offer an excellent Risk/ Reward ratio on this.
If the 1W MA50 breaks, we can see an even more aggressive extension towards the top (Lower Highs trend-line) of the Channel Down. The best indicator for a Sell Signal in that scenario is the 1W RSI Resistance Zone. It has priced the last three major Highs since 2023. Naturally the 1W MA200 (orange trend-line) is the obvious long-term Resistance and potential Target in that scenario but can go even as high as 9.5000 if we repeat the previous +225.10% Bullish Leg.
-------------------------------------------------------------------------------
** Please LIKE 👍, FOLLOW ✅, SHARE 🙌 and COMMENT ✍ if you enjoy this idea! Also share your ideas and charts in the comments section below! This is best way to keep it relevant, support us, keep the content here free and allow the idea to reach as many people as possible. **
-------------------------------------------------------------------------------
💸💸💸💸💸💸
👇 👇 👇 👇 👇 👇

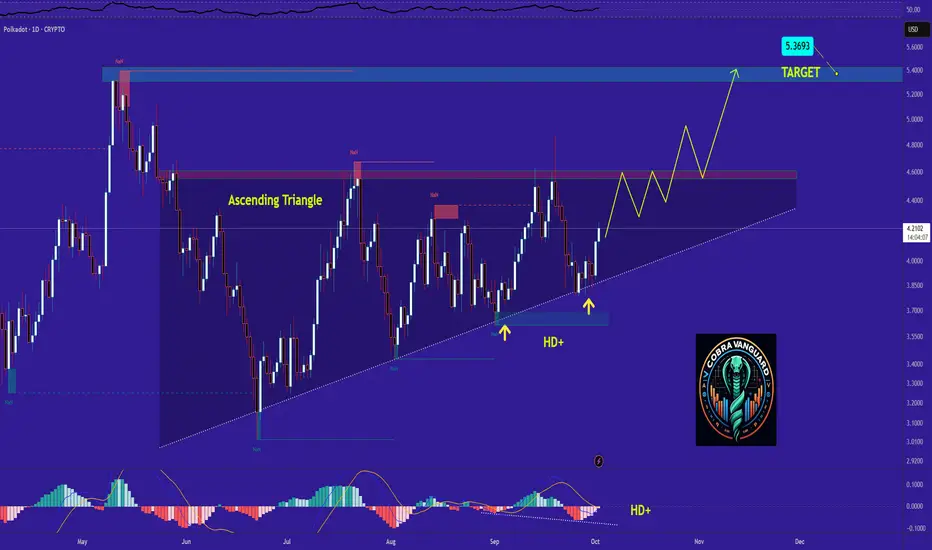
DOT's situation+next targets and expected movementsThe price on the daily timeframe is within an ascending triangle, which can be promising. If the price breaks this pattern with bullish candles, it could easily rise by the distance of AB=CD, If my view is correct, DOT will rise to $5 .
And if this pattern is correct and breaks, higher targets are possible.

DOT is one of the most difficult projects to chart in the top 50DOT is one of the most difficult projects to chart in the top 50, DOT is still making lower lows.
$DOT \ PolkadotCRYPTOCAP:DOT \ Polkadot 🔃
Polkadot has been accumulating for a long time in both USD and CRYPTOCAP:BTC pairs and is gathering strength above the demand zone.
With the RSI supporting this movement, DOT is preparing for a new upward phase. The sleeping giant, which has been quiet for a long time, seems to be waking up soon.

DOTUSD H4 | Bearish Drop in Progress”DOT/USD is reacting off the sell entry which is a pullback resistance that aligns with the 50% Fibonacci retracement and could drop from this levle to the downside.
Sell entry is at 4.165, which is a pullback resistance that aligns with the 50% Fibonacci retracement.
Stop loss is at 4.420, which is a pullback resistance.
Take profit is at 3.878, which is an overlap support that aligns with the 61.8% Fibonacci retracement.
High Risk Investment Warning
Trading Forex/CFDs on margin carries a high level of risk and may not be suitable for all investors. Leverage can work against you.
Stratos Markets Limited (tradu.com ):
CFDs are complex instruments and come with a high risk of losing money rapidly due to leverage. 65% of retail investor accounts lose money when trading CFDs with this provider. You should consider whether you understand how CFDs work and whether you can afford to take the high risk of losing your money.
Stratos Europe Ltd (tradu.com ):
CFDs are complex instruments and come with a high risk of losing money rapidly due to leverage. 66% of retail investor accounts lose money when trading CFDs with this provider. You should consider whether you understand how CFDs work and whether you can afford to take the high risk of losing your money.
Stratos Global LLC (tradu.com ):
Losses can exceed deposits.
Please be advised that the information presented on TradingView is provided to Tradu (‘Company’, ‘we’) by a third-party provider (‘TFA Global Pte Ltd’). Please be reminded that you are solely responsible for the trading decisions on your account. There is a very high degree of risk involved in trading. Any information and/or content is intended entirely for research, educational and informational purposes only and does not constitute investment or consultation advice or investment strategy. The information is not tailored to the investment needs of any specific person and therefore does not involve a consideration of any of the investment objectives, financial situation or needs of any viewer that may receive it. Kindly also note that past performance is not a reliable indicator of future results. Actual results may differ materially from those anticipated in forward-looking or past performance statements. We assume no liability as to the accuracy or completeness of any of the information and/or content provided herein and the Company cannot be held responsible for any omission, mistake nor for any loss or damage including without limitation to any loss of profit which may arise from reliance on any information supplied by TFA Global Pte Ltd.
The speaker(s) is neither an employee, agent nor representative of Tradu and is therefore acting independently. The opinions given are their own, constitute general market commentary, and do not constitute the opinion or advice of Tradu or any form of personal or investment advice. Tradu neither endorses nor guarantees offerings of third-party speakers, nor is Tradu responsible for the content, veracity or opinions of third-party speakers, presenters or participants.

DOT is bullish now & many Traders don't see it !!!The price on the daily timeframe is within an ascending triangle, which can be promising. If the price breaks this pattern with bullish candles, it could easily rise by the distance of AB=CD, If my view is correct, DOT will rise to 5$ .
And if this pattern is correct and breaks, higher targets are possible.
UPtoberI am noticing some nice bullish price action accumulating these last couple weeks, another reason i have this opinion is because there also seems to be a lot COINBASE:DOTUSD of bullish activity near the end of the year.
