UPtoberI am noticing some nice bullish price action accumulating these last couple weeks, another reason i have this opinion is because there also seems to be a lot COINBASE:DOTUSD of bullish activity near the end of the year.
Market insights

DOTUSD H4 | Bearish continuation in playDOT/USD is rising towards the sell entry, which is a pullback resistance that is slightly above the 23.6% Fibonacci retracement and could drop from this level to the downside.
Sell entry is at 3.937, which is an overlap resistance.
Stop loss is at 4.119, which is a pullback resistance that is slightly below the 50% Fibonacci retracement.
Take profit is at 3.617, which is a pullback support.
High Risk Investment Warning
Trading Forex/CFDs on margin carries a high level of risk and may not be suitable for all investors. Leverage can work against you.
Stratos Markets Limited (tradu.com ):
CFDs are complex instruments and come with a high risk of losing money rapidly due to leverage. 65% of retail investor accounts lose money when trading CFDs with this provider. You should consider whether you understand how CFDs work and whether you can afford to take the high risk of losing your money.
Stratos Europe Ltd (tradu.com ):
CFDs are complex instruments and come with a high risk of losing money rapidly due to leverage. 66% of retail investor accounts lose money when trading CFDs with this provider. You should consider whether you understand how CFDs work and whether you can afford to take the high risk of losing your money.
Stratos Global LLC (tradu.com ):
Losses can exceed deposits.
Please be advised that the information presented on TradingView is provided to Tradu (‘Company’, ‘we’) by a third-party provider (‘TFA Global Pte Ltd’). Please be reminded that you are solely responsible for the trading decisions on your account. There is a very high degree of risk involved in trading. Any information and/or content is intended entirely for research, educational and informational purposes only and does not constitute investment or consultation advice or investment strategy. The information is not tailored to the investment needs of any specific person and therefore does not involve a consideration of any of the investment objectives, financial situation or needs of any viewer that may receive it. Kindly also note that past performance is not a reliable indicator of future results. Actual results may differ materially from those anticipated in forward-looking or past performance statements. We assume no liability as to the accuracy or completeness of any of the information and/or content provided herein and the Company cannot be held responsible for any omission, mistake nor for any loss or damage including without limitation to any loss of profit which may arise from reliance on any information supplied by TFA Global Pte Ltd.
The speaker(s) is neither an employee, agent nor representative of Tradu and is therefore acting independently. The opinions given are their own, constitute general market commentary, and do not constitute the opinion or advice of Tradu or any form of personal or investment advice. Tradu neither endorses nor guarantees offerings of third-party speakers, nor is Tradu responsible for the content, veracity or opinions of third-party speakers, presenters or participants.

DOT - When in doubt, use lineCrypto wicks cause pictures to be muddied and for strong scenarios to be challenged in the moment. Sometimes holding steady is what's best.
I nearly closed my position until I looked at line.
Not financial advice
DOTUSD H4 | bearish drop offDOT/USD has rejected off the sell entry which and could potentially drop from this levle to the downside.
Sell entry is at 3.843, whichis a pullback resistance.
Stop loss is at 4.119, which is a pullback resistance.
Take profit is at 3.453, which acts as a pullback support.
High Risk Investment Warning
Trading Forex/CFDs on margin carries a high level of risk and may not be suitable for all investors. Leverage can work against you.
Stratos Markets Limited (tradu.com ):
CFDs are complex instruments and come with a high risk of losing money rapidly due to leverage. 65% of retail investor accounts lose money when trading CFDs with this provider. You should consider whether you understand how CFDs work and whether you can afford to take the high risk of losing your money.
Stratos Europe Ltd (tradu.com ):
CFDs are complex instruments and come with a high risk of losing money rapidly due to leverage. 66% of retail investor accounts lose money when trading CFDs with this provider. You should consider whether you understand how CFDs work and whether you can afford to take the high risk of losing your money.
Stratos Global LLC (tradu.com ):
Losses can exceed deposits.
Please be advised that the information presented on TradingView is provided to Tradu (‘Company’, ‘we’) by a third-party provider (‘TFA Global Pte Ltd’). Please be reminded that you are solely responsible for the trading decisions on your account. There is a very high degree of risk involved in trading. Any information and/or content is intended entirely for research, educational and informational purposes only and does not constitute investment or consultation advice or investment strategy. The information is not tailored to the investment needs of any specific person and therefore does not involve a consideration of any of the investment objectives, financial situation or needs of any viewer that may receive it. Kindly also note that past performance is not a reliable indicator of future results. Actual results may differ materially from those anticipated in forward-looking or past performance statements. We assume no liability as to the accuracy or completeness of any of the information and/or content provided herein and the Company cannot be held responsible for any omission, mistake nor for any loss or damage including without limitation to any loss of profit which may arise from reliance on any information supplied by TFA Global Pte Ltd.
The speaker(s) is neither an employee, agent nor representative of Tradu and is therefore acting independently. The opinions given are their own, constitute general market commentary, and do not constitute the opinion or advice of Tradu or any form of personal or investment advice. Tradu neither endorses nor guarantees offerings of third-party speakers, nor is Tradu responsible for the content, veracity or opinions of third-party speakers, presenters or participants.

Great opportunity Polkadot resting on top of an algorithm support.
Expecting bulls to defend this level.
Opportunity given the right conditions.
NFA

DOT/USDT – Retracement Before Next Leg Up Towards FVG📈 Prediction:
DOT/USDT remains in a bullish structure on the daily timeframe. Price is retesting the OB near $4.0, and a brief retracement is expected before continuation.
As long as $3.84 holds, DOT is likely to move towards $4.64 resistance and potentially fill the FVG up to $4.80.
⚠️ A clean break below $3.68 would invalidate the bullish scenario and open the door for deeper downside.
🔑 Key Points:
Support Zones:
$3.84 → immediate strong support
$3.68 → deeper liquidity support
Resistance Zones:
$4.64 → major resistance
$4.80 → Fair Value Gap (FVG) target
Market Structure:
Respecting ascending trendline since July lows
Completed a 5-wave corrective structure → likely retracement before continuation
Order Block (OB):
$3.90–$4.10 being tested → potential bounce zone
FVG:
$4.64–$4.80 acts as a price magnet once retracement completes
RSI:
Neutral at ~47 → room for upward momentum
#DOT #DOTUSDT #Crypto #Altcoins #OrderBlock #FVG #SupportResistance #Trading

DOTUSD H4 | Bearish reversal off major resistanceDOT/USD is rising towards the sell entry, which acts as an overlap resistance that aligns with the 23.6% Fibonacci retracement and could potentially reverse to the downside from this level.
Sell entry is at 4.007, which is an overlap resistance that lines up with the 23.6% Fibonacci retracement.
Stop loss is at 4.255, which is a pullback resistance that lines up with the 50% Fibonacci retracement.
Take profit is at 3.527, a pullback support that is slightly above the 161.8% Fibonacci extension.
High Risk Investment Warning
Trading Forex/CFDs on margin carries a high level of risk and may not be suitable for all investors. Leverage can work against you.
Stratos Markets Limited (tradu.com ):
CFDs are complex instruments and come with a high risk of losing money rapidly due to leverage. 65% of retail investor accounts lose money when trading CFDs with this provider. You should consider whether you understand how CFDs work and whether you can afford to take the high risk of losing your money.
Stratos Europe Ltd (tradu.com ):
CFDs are complex instruments and come with a high risk of losing money rapidly due to leverage. 66% of retail investor accounts lose money when trading CFDs with this provider. You should consider whether you understand how CFDs work and whether you can afford to take the high risk of losing your money.
Stratos Global LLC (tradu.com ):
Losses can exceed deposits.
Please be advised that the information presented on TradingView is provided to Tradu (‘Company’, ‘we’) by a third-party provider (‘TFA Global Pte Ltd’). Please be reminded that you are solely responsible for the trading decisions on your account. There is a very high degree of risk involved in trading. Any information and/or content is intended entirely for research, educational and informational purposes only and does not constitute investment or consultation advice or investment strategy. The information is not tailored to the investment needs of any specific person and therefore does not involve a consideration of any of the investment objectives, financial situation or needs of any viewer that may receive it. Kindly also note that past performance is not a reliable indicator of future results. Actual results may differ materially from those anticipated in forward-looking or past performance statements. We assume no liability as to the accuracy or completeness of any of the information and/or content provided herein and the Company cannot be held responsible for any omission, mistake nor for any loss or damage including without limitation to any loss of profit which may arise from reliance on any information supplied by TFA Global Pte Ltd.
The speaker(s) is neither an employee, agent nor representative of Tradu and is therefore acting independently. The opinions given are their own, constitute general market commentary, and do not constitute the opinion or advice of Tradu or any form of personal or investment advice. Tradu neither endorses nor guarantees offerings of third-party speakers, nor is Tradu responsible for the content, veracity or opinions of third-party speakers, presenters or participants.

After Breaking Massive Triangle, DOT’s First Real Test is at $5Polkadot has been a quiet story in 2025. From May to September, it sat in a big consolidation while rivals Solana and Cardano moved ahead.
Back in 2022–2023, all three were grouped together as Ethereum challengers. Over time, though, DOT slipped out of the spotlight while ADA and SOL kept building bullish structures.
That’s what makes the recent breakout interesting. Early September finally saw DOT push out of its triangle, and now it’s heading into its first real resistance test.
🔑 Key Levels
$5.00: 23.6% Fib retracement + Anchored vWAP since DOT’s $55 peak.
$6.45: Triangle measured-move target with the 38.6% Fib retracement from ATH.
Both levels are clean markers traders can build around. For traders, that’s the real story: DOT has clear levels and opportunities to exploit on the CFD chart.
📊 Cross-Pair View
DOT/ADA → Still suppressed under the 100 EMA band (blue).
DOT/SOL → Still capped by the 50 EMA band (green) and 200 EMA band (purple).
Relative to these two Layer-1 peers, DOT looks undervalued, but is beginning to chip away at resistance.
⚡ Posted by Alchemy Markets. Not financial advice — just sharing levels and setups we’re watching.

DOTUSD H4 | Heading into major into major resistanceDOT/USD is rising towards the sell entry which is a pullback resistance that is slightly above the 61.8% Fibonacci projection and the 161.8% Fibonacci extension and could reverse from this level to he downside.
Sell entry is at 4.496, which is a pullback resistance that is slightly above the 61.8% Fibonacci projection and the 161.8% Fibonacci extension.
Stop loss is at 4.794, which is a pullback resistance that is slightly above the 100% Fibonacci projection.
Take profit is at 4.004, whichis an overlap support.
High Risk Investment Warning
Trading Forex/CFDs on margin carries a high level of risk and may not be suitable for all investors. Leverage can work against you.
Stratos Markets Limited (tradu.com/uk ):
CFDs are complex instruments and come with a high risk of losing money rapidly due to leverage. 65% of retail investor accounts lose money when trading CFDs with this provider. You should consider whether you understand how CFDs work and whether you can afford to take the high risk of losing your money.
Stratos Europe Ltd (tradu.com/eu ):
CFDs are complex instruments and come with a high risk of losing money rapidly due to leverage. 66% of retail investor accounts lose money when trading CFDs with this provider. You should consider whether you understand how CFDs work and whether you can afford to take the high risk of losing your money.
Stratos Global LLC (tradu.com/en ):
Losses can exceed deposits.
Please be advised that the information presented on TradingView is provided to Tradu (‘Company’, ‘we’) by a third-party provider (‘TFA Global Pte Ltd’). Please be reminded that you are solely responsible for the trading decisions on your account. There is a very high degree of risk involved in trading. Any information and/or content is intended entirely for research, educational and informational purposes only and does not constitute investment or consultation advice or investment strategy. The information is not tailored to the investment needs of any specific person and therefore does not involve a consideration of any of the investment objectives, financial situation or needs of any viewer that may receive it. Kindly also note that past performance is not a reliable indicator of future results. Actual results may differ materially from those anticipated in forward-looking or past performance statements. We assume no liability as to the accuracy or completeness of any of the information and/or content provided herein and the Company cannot be held responsible for any omission, mistake nor for any loss or damage including without limitation to any loss of profit which may arise from reliance on any information supplied by TFA Global Pte Ltd.
The speaker(s) is neither an employee, agent nor representative of Tradu and is therefore acting independently. The opinions given are their own, constitute general market commentary, and do not constitute the opinion or advice of Tradu or any form of personal or investment advice. Tradu neither endorses nor guarantees offerings of third-party speakers, nor is Tradu responsible for the content, veracity or opinions of third-party speakers, presenters or participants.

DOTUSD H1 | Bearish reversal forming off 50% Fibonacci levelDOTUSD is rising towards the sell entry, which is a pullback resistance that aligns with the 50% Fibonacci retracement and could reverse from this level to the downside.
Sell entry is at 4.118, which is a pullback resistance that aligns with the 50% Fibonacci retracement.
Stop loss is at 4.25, which is a swing high resistance.
Take profit is at 3.90, which is an overlap support that is slightly below the 50% Fibonacci retracement.
High Risk Investment Warning
Trading Forex/CFDs on margin carries a high level of risk and may not be suitable for all investors. Leverage can work against you.
Stratos Markets Limited (tradu.com ):
CFDs are complex instruments and come with a high risk of losing money rapidly due to leverage. 65% of retail investor accounts lose money when trading CFDs with this provider. You should consider whether you understand how CFDs work and whether you can afford to take the high risk of losing your money.
Stratos Europe Ltd (tradu.com ):
CFDs are complex instruments and come with a high risk of losing money rapidly due to leverage. 66% of retail investor accounts lose money when trading CFDs with this provider. You should consider whether you understand how CFDs work and whether you can afford to take the high risk of losing your money.
Stratos Global LLC (tradu.com ):
Losses can exceed deposits.
Please be advised that the information presented on TradingView is provided to Tradu (‘Company’, ‘we’) by a third-party provider (‘TFA Global Pte Ltd’). Please be reminded that you are solely responsible for the trading decisions on your account. There is a very high degree of risk involved in trading. Any information and/or content is intended entirely for research, educational and informational purposes only and does not constitute investment or consultation advice or investment strategy. The information is not tailored to the investment needs of any specific person and therefore does not involve a consideration of any of the investment objectives, financial situation or needs of any viewer that may receive it. Kindly also note that past performance is not a reliable indicator of future results. Actual results may differ materially from those anticipated in forward-looking or past performance statements. We assume no liability as to the accuracy or completeness of any of the information and/or content provided herein and the Company cannot be held responsible for any omission, mistake nor for any loss or damage including without limitation to any loss of profit which may arise from reliance on any information supplied by TFA Global Pte Ltd.
The speaker(s) is neither an employee, agent nor representative of Tradu and is therefore acting independently. The opinions given are their own, constitute general market commentary, and do not constitute the opinion or advice of Tradu or any form of personal or investment advice. Tradu neither endorses nor guarantees offerings of third-party speakers, nor is Tradu responsible for the content, veracity or opinions of third-party speakers, presenters or participants.

DOT USD at the bottomDOT is at the bottom where the Wyckoff Accumulation Pattern was formed and it is in the final stages and I expect to start rising from these levels. The first target will be the top of the pattern at a price of $10. Breaking the top will open the way to the distant targets. I note that a huge limit has been set by Polkadot DAO on the network, as the total supply of tokens that will be minted has been changed. A ceiling has been set for it at 2.1 billion DOTs , unlike what was previously there was no ceiling, as the number of tokens was be around 5billion DOT in the year 2050.
Long-term targets:
22$
36$
60$
90$
140$

DOT USD bull market
DOT is at the bottom where the Wyckoff Accumulation Pattern was formed and it is in the final stages and I expect to start rising from these levels. The first target will be the top of the pattern at a price of $10. Breaking the top will open the way to the distant targets. I note that a huge limit has been set by Polkadot governance (DAO) on the network, as the total supply of tokens that will be minted has been changed. A ceiling has been set for it at 2.1 billion DOTs , unlike what was previously there was no ceiling, as the number of tokens was be around 5billion DOT in the year 2050.
Long-term targets:
22$
36$
60$
90$
140$

DOTUSDTechnical Analysis – DOT/USDT (4H timeframe)
Current Price Action:
DOT is currently trading around $4.35, sitting inside the highlighted entry zone ($4.20–$4.35).
The structure shows a bullish harmonic pattern (likely a bullish Gartley/Butterfly), suggesting potential upward movement.
Support & Stop Loss Levels:
Strong support is located at $4.20–$4.35 (entry zone).
Deeper support lies around $3.60–$3.47, which is also marked as the stop-loss level to protect against downside risk.
Resistance & Target Levels:
Target Zone 1: $5.01 – $5.13 (first profit-taking area).
Target Zone 2: $5.45 – $5.59 (secondary target if bullish momentum continues).
Major resistance beyond this lies near $7.32, but that’s a longer-term objective.
Trend Outlook:
The chart suggests a potential bullish breakout from the accumulation range.
As long as price holds above $4.20, the bias remains bullish.
A confirmed close above $5.13 would likely accelerate the move toward $5.45–$5.59.
Risk Management:
Entry should be considered within the $4.20–$4.35 range.
Place a stop loss at $3.60 to limit downside risk.
Risk-to-reward ratio (R:R) is attractive (around 1:2 or better), making this setup technically favorable.
Conclusion
DOT is showing a bullish technical setup with entry opportunities in the $4.20–$4.35 zone. If price holds above support, upside targets are $5.01–$5.13 (first take-profit) and $5.45–$5.59 (second take-profit). The bullish outlook is invalidated if price breaks below $3.60.

DOTUSDT – Daily Bullish Setup | Breakout BuildingDOTUSDT – Daily Bullish Setup | Breakout Building for Major Upside 🚀📈
Hey traders 👋
Polkadot (DOTUSDT) has been in a prolonged downtrend and accumulation phase, but now things are heating up. Price is compressing into a tight wedge, and momentum indicators are pointing toward a potential bullish breakout.
With a clearly defined invalidation level and huge upside potential, DOT is setting up for what could be a multi-leg rally if bulls step in.
📈 Technical Breakdown
Structure: Price coiling inside a wedge → breakout nearing
RSI: Trending higher, showing momentum building
Risk/Reward: Clear invalidation below the wedge base, upside targets are multiples higher
This is a classic breakout accumulation structure that often precedes big moves.
🎯 Trade Plan Idea
Entry: Breakout confirmation above wedge resistance
Stop-loss: Below wedge support (tight invalidation)
Targets:
TP1: 11.8 (first major resistance)
TP2: 23.8 (macro swing resistance)
TP3: 38+ (long-term potential if momentum sustains)
The setup offers huge asymmetric risk/reward, ideal for swing traders looking to capture the bigger move.
📌 DOT is coiling for a breakout — will this be the start of its next bull leg?
Are you scaling in early or waiting for breakout confirmation? Let’s discuss 👇
#DOTUSDT #Polkadot #Crypto #BullishSetup #Breakout #SwingTrade #TechnicalAnalysis #Altcoins

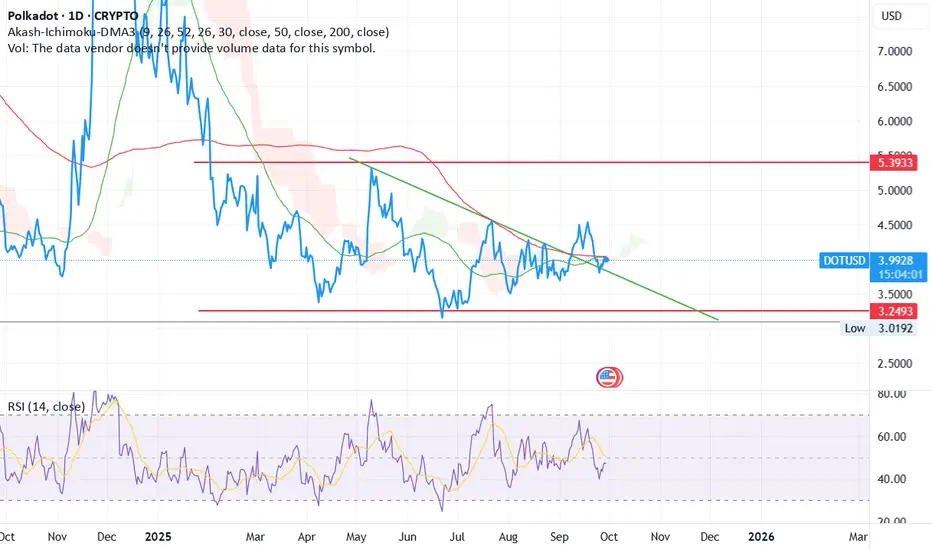
Polkadot: Rally Gains MomentumPolkadot’s DOT token has posted impressive gains recently. We primarily attribute this rally to wave iii in orange, which appears poised to break decisively above the $4.68 resistance level. At the same time, we see a 30% chance that a new correction low could still develop within the green alternative Target Zone between $3.22 and $2.31.

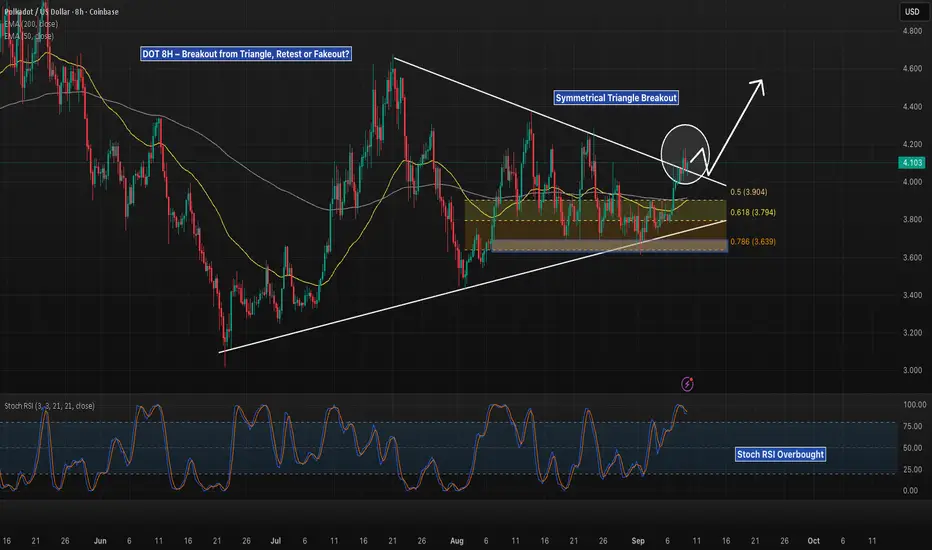
DOT 8H – Breakout from Triangle, Retest or Fakeout?Polkadot has broken above its symmetrical triangle structure, pushing through the EMAs and briefly clearing resistance near $4.10. Price is now retesting the breakout zone, with Fib confluence levels stacked between $3.90–3.63 as support.
Upside potential:
Sustaining above $4.10 could open a move toward $4.40–4.60 range.
Downside invalidation:
A failed retest and close back under $3.90 risks dragging DOT into the Fib retracement cluster ($3.79–3.63).
Stoch RSI is heavily overbought, suggesting pullback risk in the short term, but structure favors continuation if $4.00 holds as support.
📊 Key focus: Does DOT confirm the breakout by holding above EMAs and Fib 0.5, or is this another fakeout before dropping back into the range?
Clear Break out on DAYLY Timeframe for $DOTBeautiful standard Wedge break out!
Target 10 USD and above

DOTUSD H4 | Bullish bounce off supportBased on the H4 chart analysis, we could see the price fall to the buy entry, which is a pullback support and could bounce from this level to the upside.
Buy entry is at 3.748, which is a pullback support.
Stop loss is at 3.552, which is a pullback support.
Take profit is at 4.006, which is a swing high resistance.
High Risk Investment Warning
Trading Forex/CFDs on margin carries a high level of risk and may not be suitable for all investors. Leverage can work against you.
Stratos Markets Limited (tradu.com ):
CFDs are complex instruments and come with a high risk of losing money rapidly due to leverage. 65% of retail investor accounts lose money when trading CFDs with this provider. You should consider whether you understand how CFDs work and whether you can afford to take the high risk of losing your money.
Stratos Europe Ltd (tradu.com ):
CFDs are complex instruments and come with a high risk of losing money rapidly due to leverage. 66% of retail investor accounts lose money when trading CFDs with this provider. You should consider whether you understand how CFDs work and whether you can afford to take the high risk of losing your money.
Stratos Global LLC (tradu.com ):
Losses can exceed deposits.
Please be advised that the information presented on TradingView is provided to Tradu (‘Company’, ‘we’) by a third-party provider (‘TFA Global Pte Ltd’). Please be reminded that you are solely responsible for the trading decisions on your account. There is a very high degree of risk involved in trading. Any information and/or content is intended entirely for research, educational and informational purposes only and does not constitute investment or consultation advice or investment strategy. The information is not tailored to the investment needs of any specific person and therefore does not involve a consideration of any of the investment objectives, financial situation or needs of any viewer that may receive it. Kindly also note that past performance is not a reliable indicator of future results. Actual results may differ materially from those anticipated in forward-looking or past performance statements. We assume no liability as to the accuracy or completeness of any of the information and/or content provided herein and the Company cannot be held responsible for any omission, mistake nor for any loss or damage including without limitation to any loss of profit which may arise from reliance on any information supplied by TFA Global Pte Ltd.
The speaker(s) is neither an employee, agent nor representative of Tradu and is therefore acting independently. The opinions given are their own, constitute general market commentary, and do not constitute the opinion or advice of Tradu or any form of personal or investment advice. Tradu neither endorses nor guarantees offerings of third-party speakers, nor is Tradu responsible for the content, veracity or opinions of third-party speakers, presenters or participants.

Polkadot (DOTUSD) is currently consolidating around the criticalPolkadot (DOTUSD) is currently consolidating around the critical **$5.20** support level, which has served as a key psychological and technical baseline since February 2024. The asset faces persistent bearish pressure, trading below both the 50-day moving average (**$5.80**) and the 200-day moving average (**$6.40**). Volume has remained subdued during recent declines, indicating a lack of strong selling momentum but also absence of substantial buying interest.
The daily RSI reads **36**, hovering near oversold conditions yet without clear bullish divergence. The MACD remains below its signal line, though the histogram shows signs of convergence, suggesting weakening downward momentum. Immediate resistance is seen at **$5.80** (50-day MA), with more significant resistance at the **$6.20** Fibonacci retracement level.
Fundamentally, Polkadot continues to demonstrate robust ecosystem development with increasing parachain activity and cross-chain integrations. However, these strengths are being offset by prevailing bearish market sentiment. A breakdown below **$5.20** could trigger accelerated selling toward the next major support at **$4.80**. Conversely, a sustained move above **$5.80** with expanding volume could indicate near-term stabilization and potential retest of higher resistance zones. Traders should monitor Bitcoin's trajectory for broader market cues, given DOT's high correlation with major crypto movements.

Slowest altcoin gear up everLooks good here, only negating factor is the green cloud - but with NFP, who knows what will happen.
Not financial advice.

Zoom out - DOT weekly analysis Sep 3 - 9thAfter a period of very active trading, where I made profits but ultimately lost much more, I have decided to return to swing trading, as you can likely tell from the timeframe of this analysis. Accordingly, my analyses will now be structured with a broader outlook.
Polkadot is currently in an Intermediate 1–2 setup, which itself forms part of Primary Wave 3. My primary expectation is for an impulsive move toward the $5 level. However, this may prove challenging given seasonality effects, as September has historically tended to produce losses rather than gains.
From the order book perspective, we see several clusters of orders positioned above the current price, which is initially bullish. The liquidity heatmap, however, shows significant liquidity both above and below us, raising the possibility that the current move upward could merely be a liquidity grab before another downward leg.
Derivative data does not currently suggest an over-leveraged market or excessive greed or fear. Funding rates are holding steady at normal levels, and open interest is stagnant to slightly rising.
In summary, I remain long on DOT and expect an impulsive rally to follow soon.

DOTUSD H4 | Bullish bounce off major supportBased on the H4 chart analysis, we can see that the price has bounced off the buy entry, which is an overlap support that aligns with the78.6% Fibonacci projection and could rise to the take profit.
Buy entry is at 3.479, which is an overlap support that lines up with hte 78.6% Fibonacci projection.
Stop loss is at 3.189, which is a swing low support.
Take profit is at 3.837, which is a pullback resistance.
High Risk Investment Warning
Trading Forex/CFDs on margin carries a high level of risk and may not be suitable for all investors. Leverage can work against you.
Stratos Markets Limited (tradu.com ):
CFDs are complex instruments and come with a high risk of losing money rapidly due to leverage. 65% of retail investor accounts lose money when trading CFDs with this provider. You should consider whether you understand how CFDs work and whether you can afford to take the high risk of losing your money.
Stratos Europe Ltd (tradu.com ):
CFDs are complex instruments and come with a high risk of losing money rapidly due to leverage. 66% of retail investor accounts lose money when trading CFDs with this provider. You should consider whether you understand how CFDs work and whether you can afford to take the high risk of losing your money.
Stratos Global LLC (tradu.com ):
Losses can exceed deposits.
Please be advised that the information presented on TradingView is provided to Tradu (‘Company’, ‘we’) by a third-party provider (‘TFA Global Pte Ltd’). Please be reminded that you are solely responsible for the trading decisions on your account. There is a very high degree of risk involved in trading. Any information and/or content is intended entirely for research, educational and informational purposes only and does not constitute investment or consultation advice or investment strategy. The information is not tailored to the investment needs of any specific person and therefore does not involve a consideration of any of the investment objectives, financial situation or needs of any viewer that may receive it. Kindly also note that past performance is not a reliable indicator of future results. Actual results may differ materially from those anticipated in forward-looking or past performance statements. We assume no liability as to the accuracy or completeness of any of the information and/or content provided herein and the Company cannot be held responsible for any omission, mistake nor for any loss or damage including without limitation to any loss of profit which may arise from reliance on any information supplied by TFA Global Pte Ltd.
The speaker(s) is neither an employee, agent nor representative of Tradu and is therefore acting independently. The opinions given are their own, constitute general market commentary, and do not constitute the opinion or advice of Tradu or any form of personal or investment advice. Tradu neither endorses nor guarantees offerings of third-party speakers, nor is Tradu responsible for the content, veracity or opinions of third-party speakers, presenters or participants.

DOTUSD H4 | Bearish Pressure Likely to ExtendDOT/USD is rising towards the sell entry, which is a pullback resistance that aligns with the 78.6% Fibonacci retracement and could reverse from this level to our take profit.
Sell entry is at 3.899, which is a pullback resistance that lines up with the 78.6% Fibonacci retracement.
Stop loss is at 4.154, which is a swing high resistance that aligns with the 127.2% Fibonacci extension.
Take profit is at 3.587, a pullback support.
High Risk Investment Warning
Trading Forex/CFDs on margin carries a high level of risk and may not be suitable for all investors. Leverage can work against you.
Stratos Markets Limited (tradu.com ):
CFDs are complex instruments and come with a high risk of losing money rapidly due to leverage. 65% of retail investor accounts lose money when trading CFDs with this provider. You should consider whether you understand how CFDs work and whether you can afford to take the high risk of losing your money.
Stratos Europe Ltd (tradu.com ):
CFDs are complex instruments and come with a high risk of losing money rapidly due to leverage. 66% of retail investor accounts lose money when trading CFDs with this provider. You should consider whether you understand how CFDs work and whether you can afford to take the high risk of losing your money.
Stratos Global LLC (tradu.com ):
Losses can exceed deposits.
Please be advised that the information presented on TradingView is provided to Tradu (‘Company’, ‘we’) by a third-party provider (‘TFA Global Pte Ltd’). Please be reminded that you are solely responsible for the trading decisions on your account. There is a very high degree of risk involved in trading. Any information and/or content is intended entirely for research, educational and informational purposes only and does not constitute investment or consultation advice or investment strategy. The information is not tailored to the investment needs of any specific person and therefore does not involve a consideration of any of the investment objectives, financial situation or needs of any viewer that may receive it. Kindly also note that past performance is not a reliable indicator of future results. Actual results may differ materially from those anticipated in forward-looking or past performance statements. We assume no liability as to the accuracy or completeness of any of the information and/or content provided herein and the Company cannot be held responsible for any omission, mistake nor for any loss or damage including without limitation to any loss of profit which may arise from reliance on any information supplied by TFA Global Pte Ltd.
The speaker(s) is neither an employee, agent nor representative of Tradu and is therefore acting independently. The opinions given are their own, constitute general market commentary, and do not constitute the opinion or advice of Tradu or any form of personal or investment advice. Tradu neither endorses nor guarantees offerings of third-party speakers, nor is Tradu responsible for the content, veracity or opinions of third-party speakers, presenters or participants.
