Polkadot (DOT): Support Zone Holding Strong | BullishDOT seems bullish to us, as we are still holding that local support zone and buyers eat up that dip each time the price reaches this zone.
This being said, we are going to look for a strong upside movement as long as we are above that support zone (which low-key looks like a neckline zone as well)

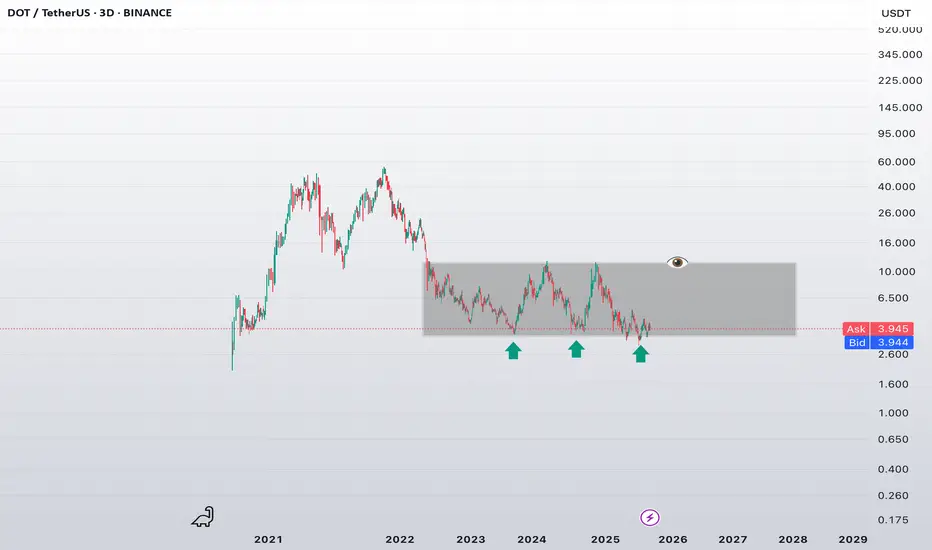
DOT — 4th Test of Major Support. Time to Start Watching Closely?
Polkadot continues to trade within a multi-year accumulation range, with the ~$3.50 level acting as a strategic support zone. We’re now seeing the fourth retest of this base — and once again, buyers are stepping in.
🔍 Structural Notes:
Horizontal range: ~$3.50–$7.50
Support: ~$3.50 — key demand zo
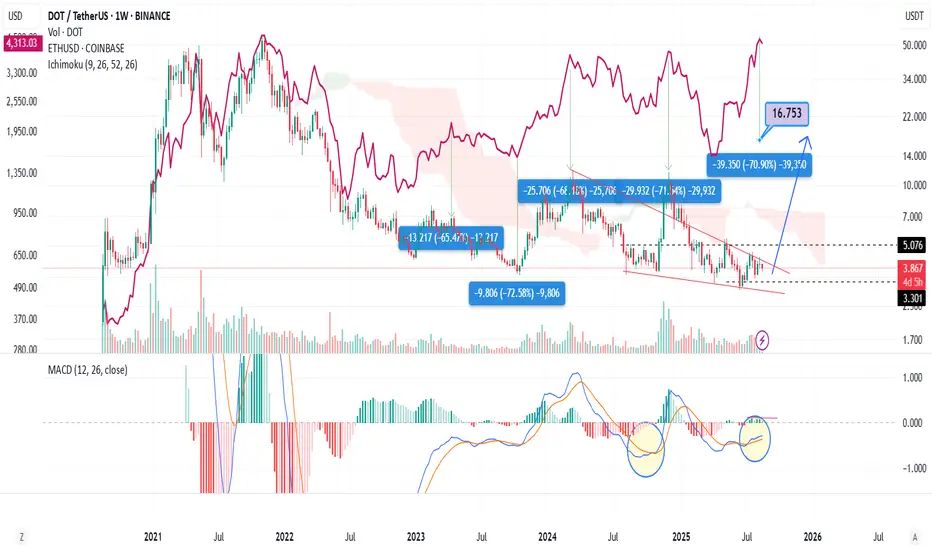
DOT has nearly completed its recovery phase, and even a minor upDOT is about to complete a long-term consolidation and bottoming phase on the weekly chart. The $3.5 – $4.0 range is a critical support zone. A strong breakout from this level could bring $7 first, followed by a $16 target. The MACD indicator supports the bullish signal. However, if there is a weekl
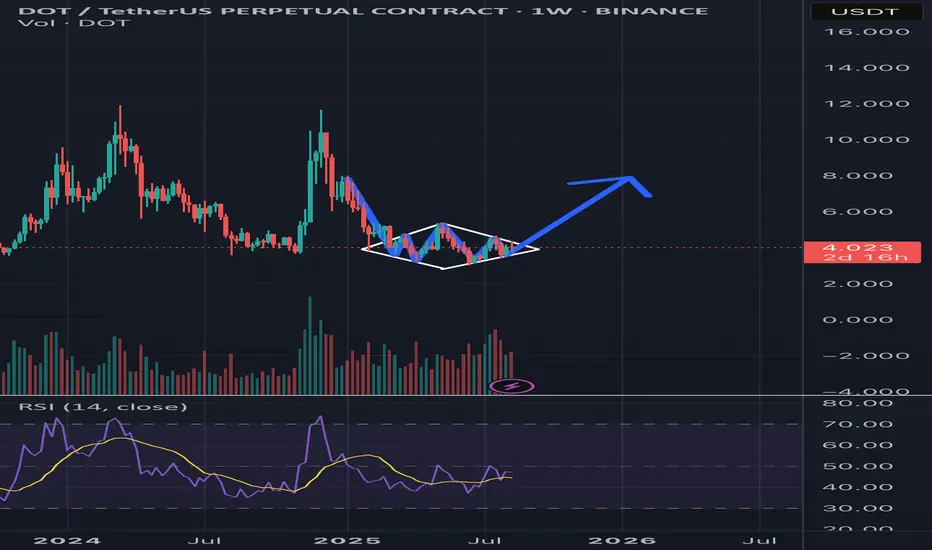
Perfectly created Bullish Diamond Pattern on livePerfectly generated buillish diamond pattern is on live right now! We can expect a breakout and a bullish momentum!!!
Elliottqablanam goftam farsi nemishe type kard pas harf nemizanam
inam bekhatere ejbare barname
vali agar fuchers mikhain bardarin ahrom 10 va 2 darsade valet surprise mishin

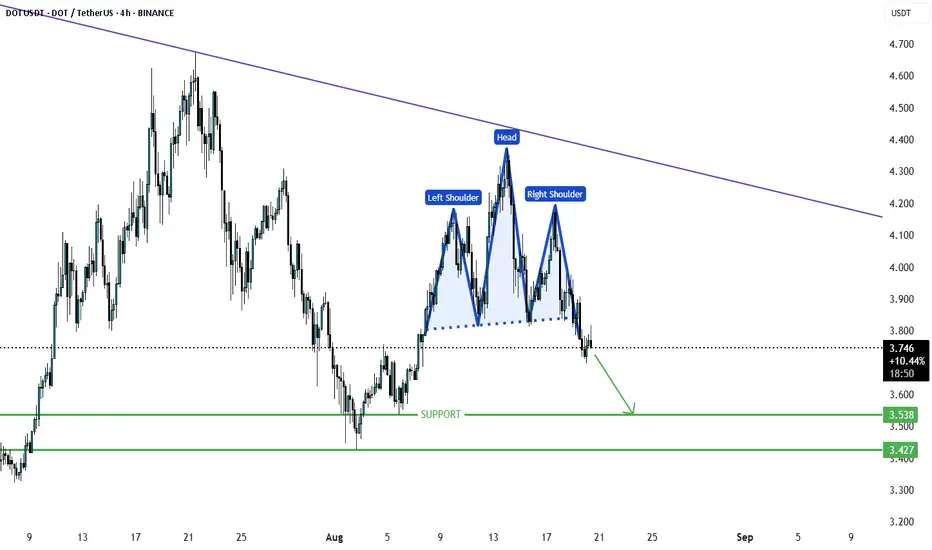
DOTUSD Head & Shoulders Pattern Points to Lower LevelsDOTUSD has recently completed a head and shoulders formation, a bearish chart pattern that often signals further downside. After the breakdown, price retested the neckline, which has now acted as resistance.
From here, DOT is likely to continue lower, with potential downside targets at $3.55 and $3
Polkadot (DOT) Holds $3.70 Support, Eyes Breakout Toward $5.37Polkadot (DOT) has reverted to a critical daily support at $3.70, aligning with the 0.618 Fibonacci retracement. This level is acting as a key higher-low formation in the current uptrend, but price must clear dynamic resistance before a push toward $5.37 becomes likely.
Polkadot’s recent price acti

Polkadot
Polkadot (DOT) Cryptocurrency
A good opportunity to buy again is in the price range of $3.55 to $3.75.
If the price holds in this area, it could see a strong first-stage growth to around $4.60, and then in the second and third stages, it could reach $5.40 and $6.20, respectively.
This is another go

DOTUSDT?Hi,
Find price range 4.07 to 4.++
Is a good range for buys
DOT past down trendline (1h)
All the best
Not a guru

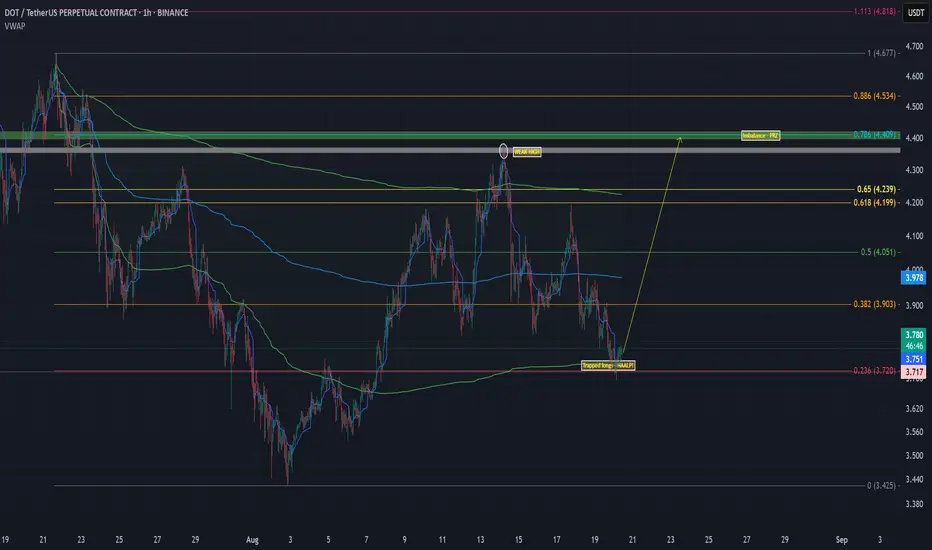
DOTUSDT – Fakeout to the Ground, Then Longs Turn It AroundThe chart says it all.
Price has been sliding since 14 Aug, and we’re now sitting in a potential reversal zone. Order Flow shows a cluster of longs who opened shorts right at the bottom — this positioning could juice the first leg up as they get squeezed to the bone.
Chances are we’ll sweep the ma
See all ideas
Summarizing what the indicators are suggesting.
Oscillators
Neutral
SellBuy
Strong sellStrong buy
Strong sellSellNeutralBuyStrong buy
Oscillators
Neutral
SellBuy
Strong sellStrong buy
Strong sellSellNeutralBuyStrong buy
Summary
Neutral
SellBuy
Strong sellStrong buy
Strong sellSellNeutralBuyStrong buy
Summary
Neutral
SellBuy
Strong sellStrong buy
Strong sellSellNeutralBuyStrong buy
Summary
Neutral
SellBuy
Strong sellStrong buy
Strong sellSellNeutralBuyStrong buy
Moving Averages
Neutral
SellBuy
Strong sellStrong buy
Strong sellSellNeutralBuyStrong buy
Moving Averages
Neutral
SellBuy
Strong sellStrong buy
Strong sellSellNeutralBuyStrong buy
Displays a symbol's price movements over previous years to identify recurring trends.