DOT/USDTWe are in a good price to accumulate DOT and add more to our bags. It will go side ways for couple of days or maybe a week. As soon as we break 9.70$-9.90$ price we will pump to 15$ to 17$.
Be patient and you'll make money.
DOTUSDT.P trade ideas

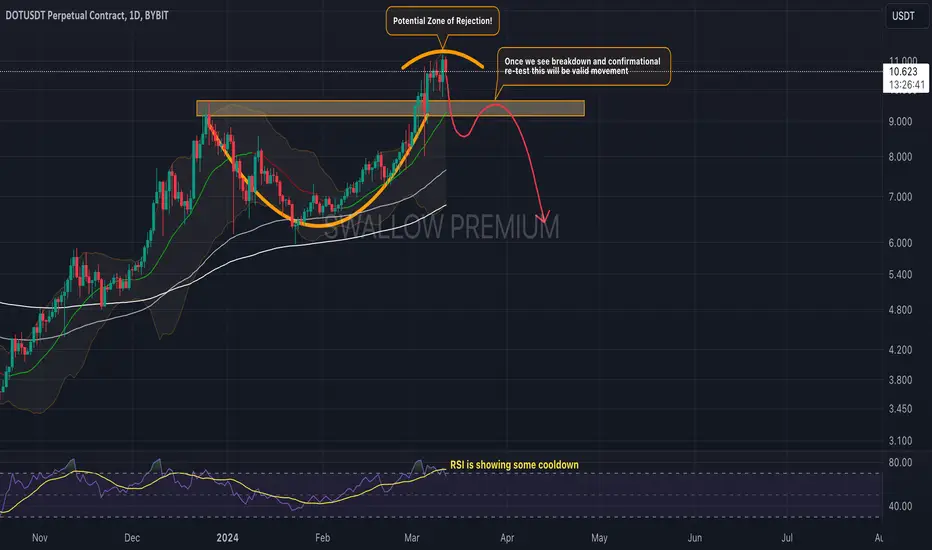
Polkadot(DOT): Breakdown Happened!Polkadot has had a really nice breakdown where the price got rejected from the 100 EMA zone.
With now crushing down the 200EMA as well, we are seeing a good chance of further movement here, so we are keeping our eyes open for a potential target zone to be reached!
Swallow Team


The DOT price action has broken below its ascending trendlineThe price of DOT has breached its previously established ascending trendline, suggesting a shift in market sentiment towards the downside.
First support area is $8.44, Second support area is $7.50 and third support area is $6.30. I hope we can regain the ascending trend before reaching the third support level.


DOT/USDTDOT is in a good position to buy and accumulate right now between prices of 9$ to 9.5$.
It's preparing for a huge move to 15$ and 17$. You can buy on spot and sit on the bag.
DYOR

DOTUSDT.PHello Trader BINANCE:DOTUSDT.P
rising wedge chart valid area when breakdown below 9,417 area, but if you want to short scalping can market price
take profit 6%
stop loss 1.5%
Please add a comment and Positive feedback and constructive criticism are important to authors and the community.
Disclamer: Not Financial Advice

DOT seems very Bullish - This is the time for entryIf you have not taken any entry, now is the time. Don't miss this chance before it takes off. Lots of things are happening in Polkadot and this is under value right now. I can DOT rally is near.

DOTUSDT Analysis - Long-Term Opportunity !!Dotusdt has recently experienced a breakout followed by a retracement, indicating potential upward momentum. With signs pointing towards new highs, entering for the long term could be promising. However, it’s crucial to maintain a disciplined approach by implementing a stop loss to mitigate risks along the way
DOTUSDT (1D Chart) Technical analysis
DOTUSDT (1D Chart) Currently trading at $9.7
Buy level: Above $9.6
Stop loss: Below $7.7
TP1: $11
TP2: $13
TP3: $17
TP4: $23
Max Leverage 2x
Always keep Stop loss
Follow Our Tradingview Account for More Technical Analysis Updates, | Like, Share and Comment Your thoughts

DOTUSDT is BullishDOT seems to have defined a higher low on daily time frame, and would now head towards previous higher high. Bulls are in control of the price action and a good rally of 20%-40% is expected from current levels. Targets are mentioned on the chart.

DOT SWING TRADE OPPORTUNITYIf the market gives us a long opportunity, I would enter on the levels mentioned below.
Long Entry DCA:
7.951
7.348
6.8
Stop Loss:
5.936
Risking 3% of portfolio

DOTUSDT - IN BEARISH TRENDDOTUSDT is trading in bearish trend in 1hr time frame as it is showing lower highs lower lows and confirmed by the formation of Shooting Star, Hanging Man, Evening Doji Star & Tweezers Top Candlesticks.

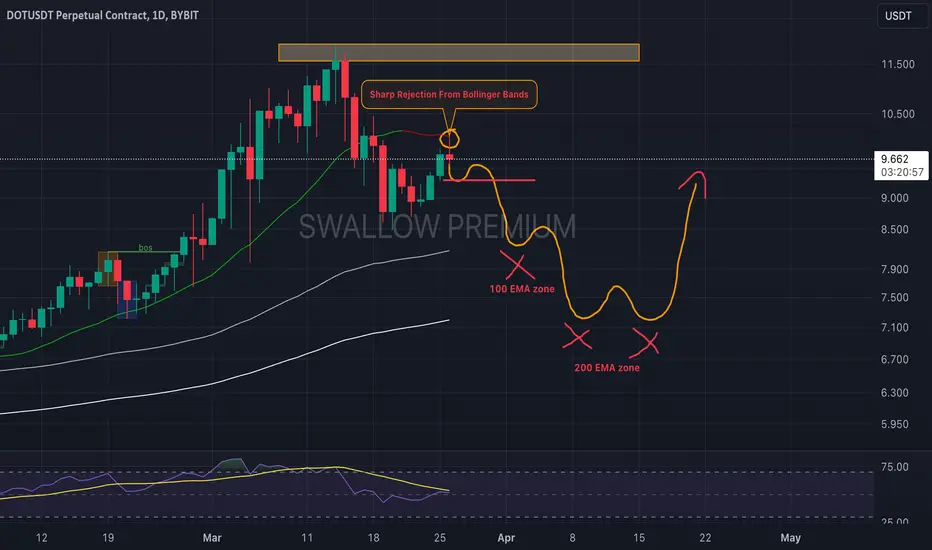
Polkadot(DOT): Rejected From Bollinger BandsPolkadot has shown us a decent rejection near the middle line of Bollinger Bands, which has also given us a confirmation of strength near that zone (as the re-test was secured).
As soon as we get the candle to close below that line, we will be looking for a potential movement between 100 & 200 EMAs.
Swallow Team
DOTUSDT SHORT OUTLOOKHello Traders, this is outlook that i think might be work. All Entry, Stop Loss, and Take Profit its already showed up. All trade it is on yourself. DYOR.

DOT/USDT | 1W 👀CRYPTOCAP:DOT is still in the accumulation stage.
Breaking the psychological mark of $10 will indicate the priority of further growth. And in fact, anything below this mark is considered the second stage of accumulation.
Accumulating and buying for the long term at prices below $10 is a perfectly good decision. The coin has not yet shown real growth. But I am confident that we will see good movement this year.
- Not financial advice, trade with caution.
✅ Stay updated on market news and developments that may influence the price of Polkadot. Positive or negative news can significantly impact the cryptocurrency's value.
✅ Exercise patience and discipline when executing your trading plan. Avoid making impulsive decisions driven by emotions, and adhere to your strategy even during periods of market volatility.
✅ Remember that trading always involves risk, and there are no guarantees of profit. Conduct thorough research, analyze market conditions, and be prepared for various scenarios. Trade only with funds you can afford to lose and avoid excessive risk-taking.
#Crypto #Polkadot #Investment #DOT

DOT USDTDOT Setup. After a confirmed breakout from the marked zone in green, we could take an entry at 9.985. Remember stop loss is your friend. Everything is on the chart.
Entry 9.985
S.L 9.389
T.P 1 10.444
T.P 2 11.062
T.P 3 11.810

🟢 DOT Trade Plan: Breakout and Retest Strategy 📈🚀🎯 Entry Point:
Long spot trade at the break and retest of $10.00 resistance on a 4HR candle.
🎯 Take Profit Levels:
First target: $11.30 - $12.00
Second target: $16.00 - $17.00
🛑 Stop Loss:
Just below $9.50 to manage downside risk.
📊 Strategy Rationale:
Taking advantage of breakout momentum with a confirmation retest strategy.
Targets set at key resistance levels for potential profit-taking.
Tight stop loss to manage risk in case of a reversal.
📉📈 Note: Monitor price action closely for confirmation and adjust strategy accordingly. #DOT #TradingStrategy #Breakout 🟢📊

DOT with Bullish div on daily histogramDOT ( provided on Live Stream ) 4hr chart
with bullish divergence on the daily histogram
broke above resistance ... enter at current price
add on retest
white circles = entry ideas
target 11.398
stop loss 9.239
Market Cap 13.9B
Layer 1
Not Financial Advice

DOTUSDT - Opportunity to catch a 38% correctionDOT/USDT is at a Buying Zone: This suggests that according to your analysis, the current market conditions favor purchasing DOT with USDT. Buying zones are typically identified through technical analysis indicators such as support levels, trend lines, or chart patterns. It's essential to have a clear understanding of why you believe DOT/USDT is in a buying zone. This could involve factors such as a pullback from previous highs, consolidation after a rally, or bullish indicators on technical charts.
The Premium Buying Zone is at 8.4 to 8.9: This indicates a specific price range within the buying zone where you believe there is a premium buying opportunity. The premium buying zone could be based on factors such as historical price levels, psychological levels, or significant order blocks. Identifying such zones helps traders focus their buying efforts and potentially capitalize on favorable entry points.

DOT LOWER TIMEFRAME - PICK YOUR POISON
This is the smaller picture compared to the one we have on the higher timeframe
Overall trend long term is bullish I am just showing that this retracement on the lower timeframe has got some opportunity for scalpers and day trader.
OTHER ANALYSIS

DOTUSDT-LONG IDEADOTUSDT was in a bearish short term retracement now the new higher high has been formed if the previous lower high gets broken then trend could be reversed put buy stop above the mentioned point rest of the things are mentioned in chart

Polkadot(DOT): Small Correction + Re-Test?Polkadot has had a nice breakout (where it almost formed Cup&Handle pattern movement) but yet had an early breakout.
We are looking here for a re-test to happen, which should be natural, and yet we want to see a failure of that re-test as well. With that being said, we are looking for a potential opportunity to short!
Swallow Team
3200% a gift for youHello
As you know when tons of people love ETH and BTC and miss the best opportunities like DOTUSDT .
It's my experience in this market and keep a close eye on DOTUSDT .
I delete indicators.
Hold it.
