DOT USDT TARGETPrice (USD)
56 ┤ 🎯 Final Long-term Target
50 ┤ ⚡ Strong Resistance / Major Target
45 ┤ 🎯 Extended Mid-term Target
40 ┤ 🎯 Mid-term Target
35 ┤ ⚡ Mid-term Resistance
30 ┤ 🎯 Mid-term Target
25 ┤
Related pairs

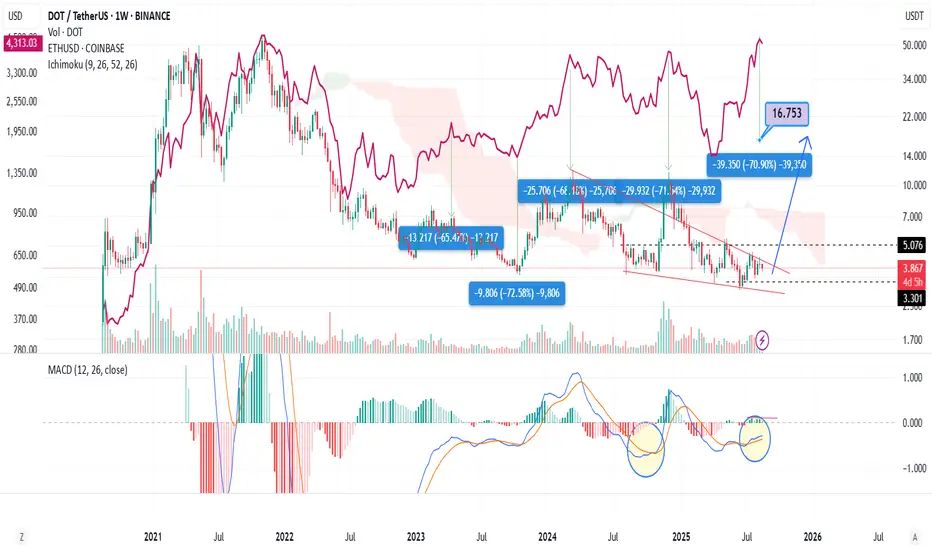
DOT has nearly completed its recovery phase, and even a minor upDOT is about to complete a long-term consolidation and bottoming phase on the weekly chart. The $3.5 – $4.0 range is a critical support zone. A strong breakout from this level could bring $7 first, followed by a $16 target. The MACD indicator supports the bullish signal. However, if there is a weekl
Polkadot (DOT): Support Zone Holding Strong | BullishDOT seems bullish to us, as we are still holding that local support zone and buyers eat up that dip each time the price reaches this zone.
This being said, we are going to look for a strong upside movement as long as we are above that support zone (which low-key looks like a neckline zone as well)

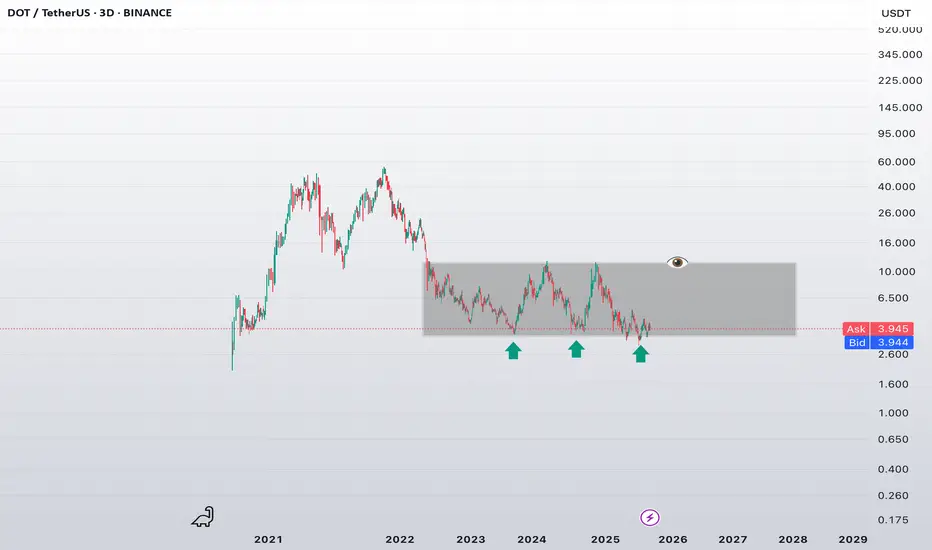
DOT — 4th Test of Major Support. Time to Start Watching Closely?
Polkadot continues to trade within a multi-year accumulation range, with the ~$3.50 level acting as a strategic support zone. We’re now seeing the fourth retest of this base — and once again, buyers are stepping in.
🔍 Structural Notes:
Horizontal range: ~$3.50–$7.50
Support: ~$3.50 — key demand zo
^Bullish DOT needs to confirm above trend lineHopefully Pokladot can break above this line of resistance and confirm above into a new channel in a bullish direction. When in doubt zoom out, the macro time frame looks very bullish on the weekly. We've been in consolidation for a very long time. I do truly believe in this project and will proba

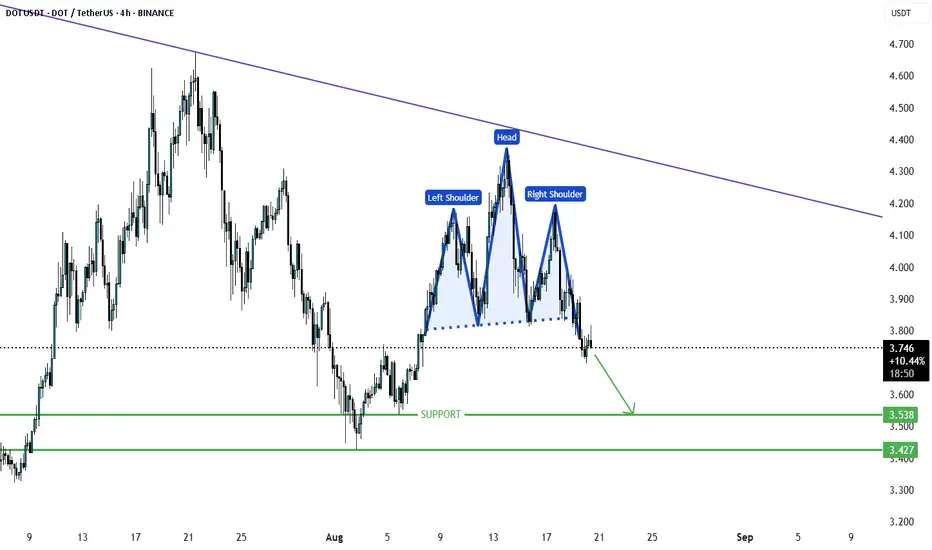
DOTUSD Head & Shoulders Pattern Points to Lower LevelsDOTUSD has recently completed a head and shoulders formation, a bearish chart pattern that often signals further downside. After the breakdown, price retested the neckline, which has now acted as resistance.
From here, DOT is likely to continue lower, with potential downside targets at $3.55 and $3
Polkadot (DOT) Holds $3.70 Support, Eyes Breakout Toward $5.37Polkadot (DOT) has reverted to a critical daily support at $3.70, aligning with the 0.618 Fibonacci retracement. This level is acting as a key higher-low formation in the current uptrend, but price must clear dynamic resistance before a push toward $5.37 becomes likely.
Polkadot’s recent price acti

Elliottqablanam goftam farsi nemishe type kard pas harf nemizanam
inam bekhatere ejbare barname
vali agar fuchers mikhain bardarin ahrom 10 va 2 darsade valet surprise mishin

Polkadot
Polkadot (DOT) Cryptocurrency
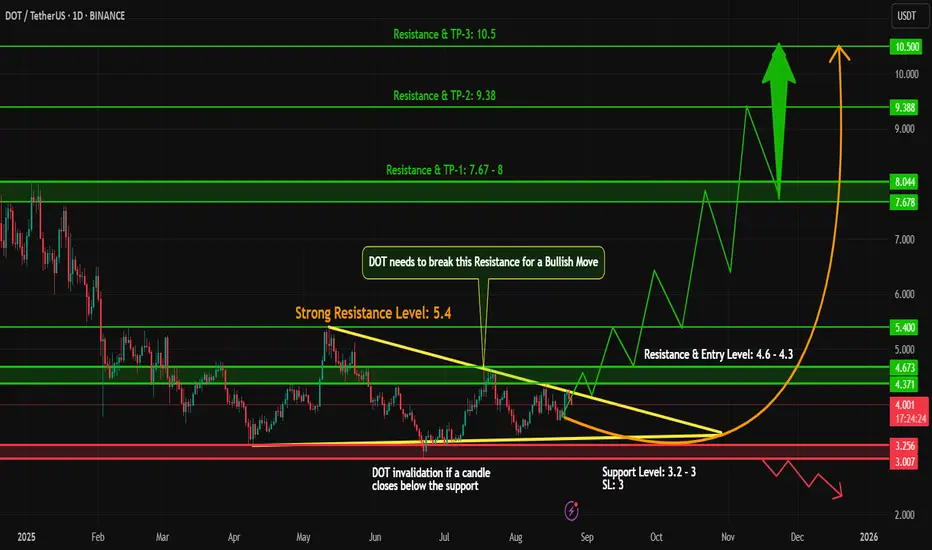
A good opportunity to buy again is in the price range of $3.55 to $3.75.
If the price holds in this area, it could see a strong first-stage growth to around $4.60, and then in the second and third stages, it could reach $5.40 and $6.20, respectively.
This is another go

DOT (Polkadot) | Triangle Breakout Setup Loading!#DOT is currently moving sideways and forming a triangle pattern on the 1D timeframe. At the moment, there are no bearish signs on the chart, which indicates strength in the structure.
Key Points:
#DOT is consolidating within a triangle pattern.
A breakout with strong volume will confirm the next
See all ideas
Summarizing what the indicators are suggesting.
Oscillators
Neutral
SellBuy
Strong sellStrong buy
Strong sellSellNeutralBuyStrong buy
Oscillators
Neutral
SellBuy
Strong sellStrong buy
Strong sellSellNeutralBuyStrong buy
Summary
Neutral
SellBuy
Strong sellStrong buy
Strong sellSellNeutralBuyStrong buy
Summary
Neutral
SellBuy
Strong sellStrong buy
Strong sellSellNeutralBuyStrong buy
Summary
Neutral
SellBuy
Strong sellStrong buy
Strong sellSellNeutralBuyStrong buy
Moving Averages
Neutral
SellBuy
Strong sellStrong buy
Strong sellSellNeutralBuyStrong buy
Moving Averages
Neutral
SellBuy
Strong sellStrong buy
Strong sellSellNeutralBuyStrong buy
Displays a symbol's price movements over previous years to identify recurring trends.
Frequently Asked Questions
The current price of DOTUSDT SPOT (DOT) is 3.768 USDT — it has fallen −5.67% in the past 24 hours. Try placing this info into the context by checking out what coins are also gaining and losing at the moment and seeing DOT price chart.
DOTUSDT SPOT price has fallen by −4.32% over the last week, its month performance shows a −5.14% decrease, and as for the last year, DOTUSDT SPOT has decreased by −21.89%. See more dynamics on DOT price chart.
Keep track of coins' changes with our Crypto Coins Heatmap.
Keep track of coins' changes with our Crypto Coins Heatmap.
DOTUSDT SPOT (DOT) reached its highest price on Nov 4, 2021 — it amounted to 55.030 USDT. Find more insights on the DOT price chart.
See the list of crypto gainers and choose what best fits your strategy.
See the list of crypto gainers and choose what best fits your strategy.
DOTUSDT SPOT (DOT) reached the lowest price of 3.015 USDT on Jun 22, 2025. View more DOTUSDT SPOT dynamics on the price chart.
See the list of crypto losers to find unexpected opportunities.
See the list of crypto losers to find unexpected opportunities.
The safest choice when buying DOT is to go to a well-known crypto exchange. Some of the popular names are Binance, Coinbase, Kraken. But you'll have to find a reliable broker and create an account first. You can trade DOT right from TradingView charts — just choose a broker and connect to your account.
Crypto markets are famous for their volatility, so one should study all the available stats before adding crypto assets to their portfolio. Very often it's technical analysis that comes in handy. We prepared technical ratings for DOTUSDT SPOT (DOT): today its technical analysis shows the strong sell signal, and according to the 1 week rating DOT shows the sell signal. And you'd better dig deeper and study 1 month rating too — it's sell. Find inspiration in DOTUSDT SPOT trading ideas and keep track of what's moving crypto markets with our crypto news feed.
DOTUSDT SPOT (DOT) is just as reliable as any other crypto asset — this corner of the world market is highly volatile. Today, for instance, DOTUSDT SPOT is estimated as 1.59% volatile. The only thing it means is that you must prepare and examine all available information before making a decision. And if you're not sure about DOTUSDT SPOT, you can find more inspiration in our curated watchlists.
You can discuss DOTUSDT SPOT (DOT) with other users in our public chats, Minds or in the comments to Ideas.