DYDXUSDT Forming Bullish PotentialDYDXUSDT is currently showing strong bullish potential as price action is forming a higher-low structure, signaling accumulation before the next breakout. The chart highlights a critical resistance zone where multiple rejections have occurred in the past, but this time volume and investor sentiment
Related pairs


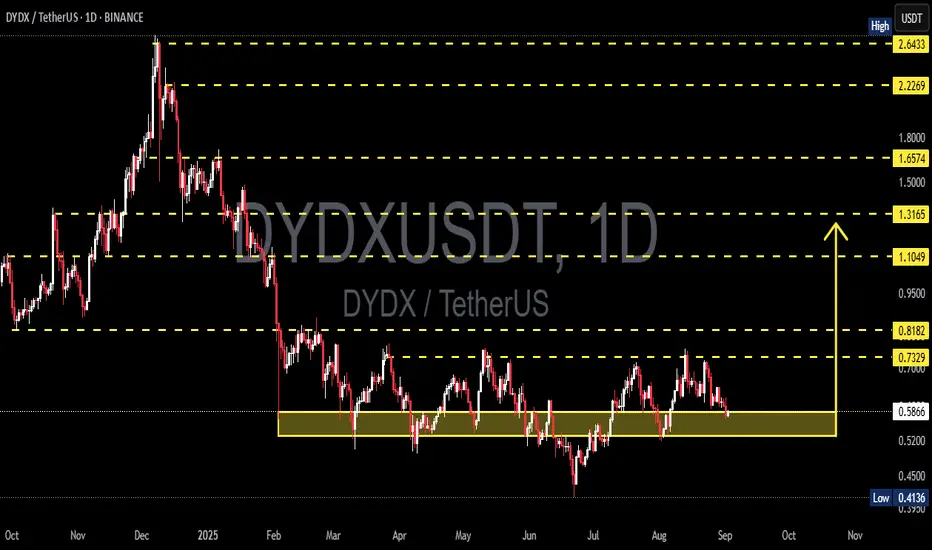
DYDX/USDT — Testing Historical Support: Bounce or Breakdown?Full Analysis:
DYDX is currently standing at a critical decision point. The chart shows price retesting the demand zone $0.50–$0.59 (yellow box), which has acted as strong support multiple times since March, June, and August 2025. This zone remains the last stronghold before price revisits the prev
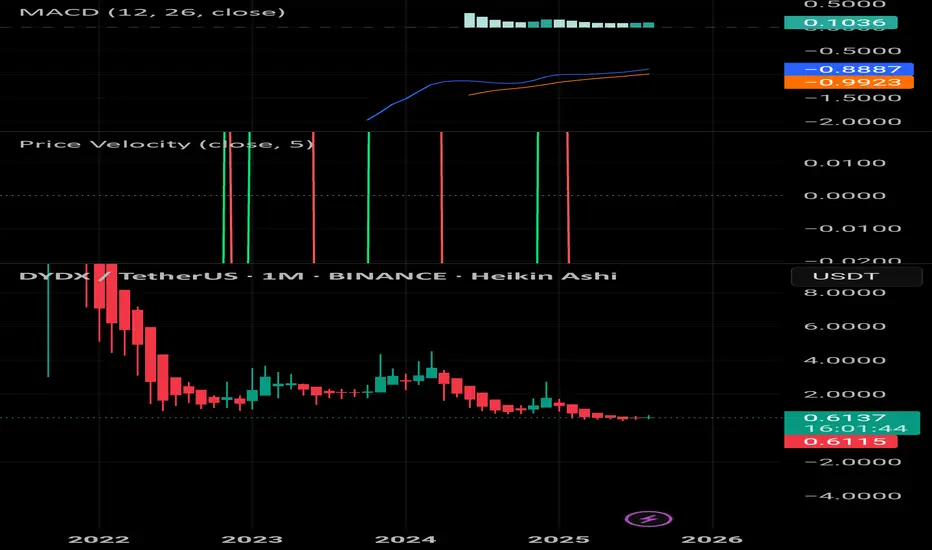
DYDX SET FOR POSITIVE GAINSWatch out from now till the next month or two. Heikin Ashi now green on the monthly.
DYDXUSDT 1D#DYDX chart is showing the potential formation of a Golden Cross on the daily timeframe. We believe it will break above the resistance zone soon. If this happens, the potential targets are:
🎯 $0.8854
🎯 $0.9967
🎯 $1.1552
🎯 $1.3571
⚠️ As always, use a tight stop-loss and apply proper risk management

#DYDX/USDT#DYDX
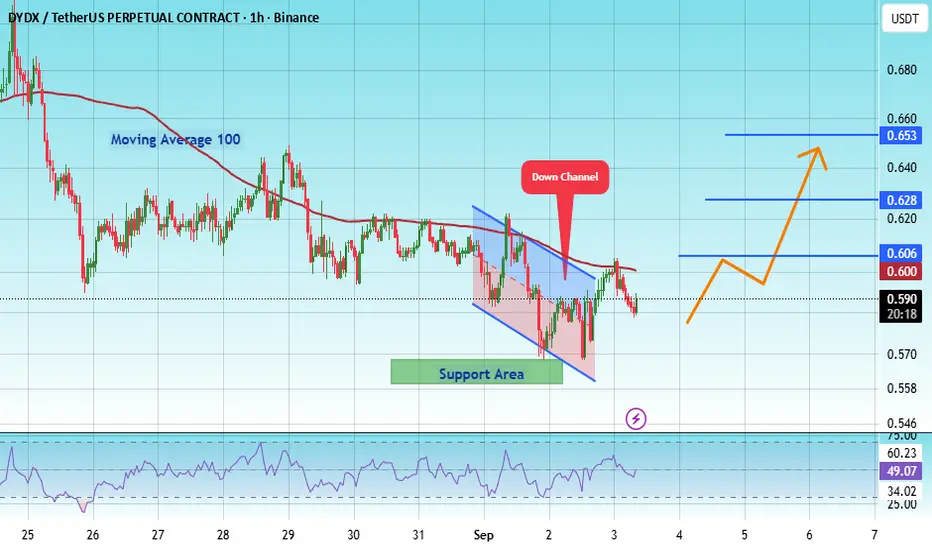
The price is moving within an ascending channel on the 1-hour frame, adhering well to it, and is on track to break it strongly upwards and retest it.
We have support from the lower boundary of the ascending channel, at 0.612.
We have a downtrend on the RSI indicator that is about to break a

#DYDX/USDT Breakout from Falling Wedge | #DYDX
The price is moving within a descending channel on the 1-hour frame, adhering well to it, and is heading for a strong breakout and retest.
We have a bearish trend on the RSI indicator that is about to be broken and retested, which supports the upward breakout.
There is a major support area
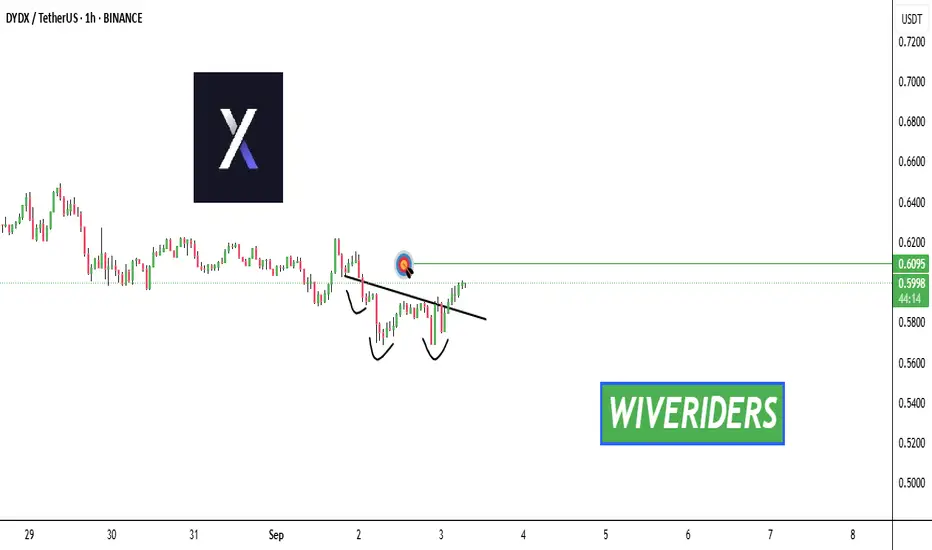
inverted Head & Shoulders pattern🚨 $DYDX Breakout Alert! 🚨
$DYDX has already broken out above the neckline of its inverted Head & Shoulders pattern ✅
👉 The first target is now the green line level 🎯
⚠️ Key point: Watch for retests of the neckline to confirm strength.
👉 This breakout signals bullish continuation with buyers firmly
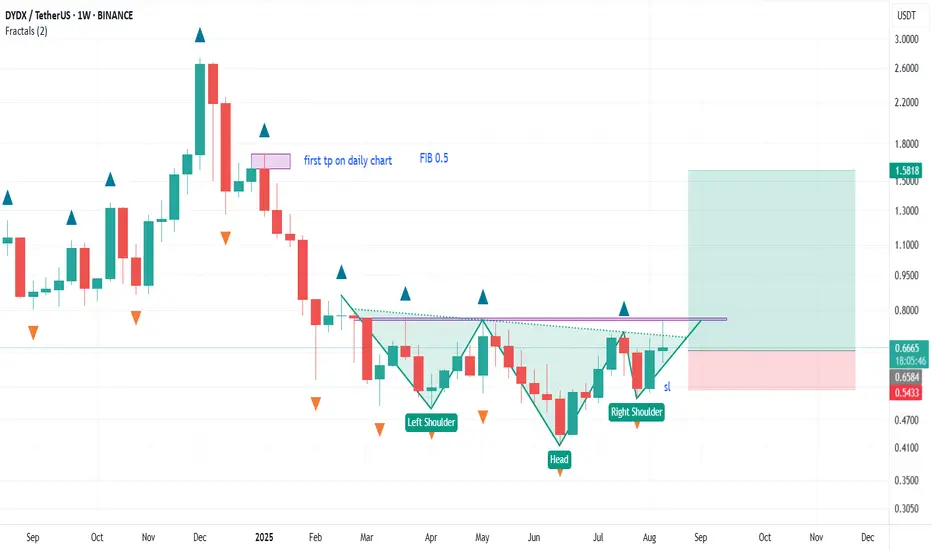
dydx weekly chart as we can see after a long term down trend the price has formed a head and shoulder pattern .
if price can break up the neck line on daily chart we will have the first signal.
SL on weekly chart and weekly strategy is 4 aug candle
TP : 6 JAN CANDLE which is the 0.5 fib ret
for accurate entrance
DYDX LONG SET-UPBINANCE:DYDXUSDT
dydx Looking Bullish , waiting for a small retracement
expecting 40-50% Upside Rally
spot buy only

See all ideas
Summarizing what the indicators are suggesting.
Oscillators
Neutral
SellBuy
Strong sellStrong buy
Strong sellSellNeutralBuyStrong buy
Oscillators
Neutral
SellBuy
Strong sellStrong buy
Strong sellSellNeutralBuyStrong buy
Summary
Neutral
SellBuy
Strong sellStrong buy
Strong sellSellNeutralBuyStrong buy
Summary
Neutral
SellBuy
Strong sellStrong buy
Strong sellSellNeutralBuyStrong buy
Summary
Neutral
SellBuy
Strong sellStrong buy
Strong sellSellNeutralBuyStrong buy
Moving Averages
Neutral
SellBuy
Strong sellStrong buy
Strong sellSellNeutralBuyStrong buy
Moving Averages
Neutral
SellBuy
Strong sellStrong buy
Strong sellSellNeutralBuyStrong buy
Displays a symbol's price movements over previous years to identify recurring trends.
Frequently Asked Questions
The current price of dYdX/Tether (DYDX) is 0.5997 USDT — it has fallen −1.55% in the past 24 hours. Try placing this info into the context by checking out what coins are also gaining and losing at the moment and seeing DYDX price chart.
dYdX/Tether price has fallen by −5.14% over the last week, its month performance shows a 8.05% increase, and as for the last year, dYdX/Tether has decreased by −33.81%. See more dynamics on DYDX price chart.
Keep track of coins' changes with our Crypto Coins Heatmap.
Keep track of coins' changes with our Crypto Coins Heatmap.
dYdX/Tether (DYDX) reached its highest price on Sep 8, 2021 — it amounted to 30.0000 USDT. Find more insights on the DYDX price chart.
See the list of crypto gainers and choose what best fits your strategy.
See the list of crypto gainers and choose what best fits your strategy.
dYdX/Tether (DYDX) reached the lowest price of 0.4136 USDT on Jun 22, 2025. View more dYdX/Tether dynamics on the price chart.
See the list of crypto losers to find unexpected opportunities.
See the list of crypto losers to find unexpected opportunities.
The safest choice when buying DYDX is to go to a well-known crypto exchange. Some of the popular names are Binance, Coinbase, Kraken. But you'll have to find a reliable broker and create an account first. You can trade DYDX right from TradingView charts — just choose a broker and connect to your account.
Crypto markets are famous for their volatility, so one should study all the available stats before adding crypto assets to their portfolio. Very often it's technical analysis that comes in handy. We prepared technical ratings for dYdX/Tether (DYDX): today its technical analysis shows the sell signal, and according to the 1 week rating DYDX shows the sell signal. And you'd better dig deeper and study 1 month rating too — it's sell. Find inspiration in dYdX/Tether trading ideas and keep track of what's moving crypto markets with our crypto news feed.
dYdX/Tether (DYDX) is just as reliable as any other crypto asset — this corner of the world market is highly volatile. Today, for instance, dYdX/Tether is estimated as 3.86% volatile. The only thing it means is that you must prepare and examine all available information before making a decision. And if you're not sure about dYdX/Tether, you can find more inspiration in our curated watchlists.
You can discuss dYdX/Tether (DYDX) with other users in our public chats, Minds or in the comments to Ideas.