Nasdaq - Preparing for another correction!🚔Nasdaq ( TVC:NDQ ) is starting to look weak:
🔎Analysis summary:
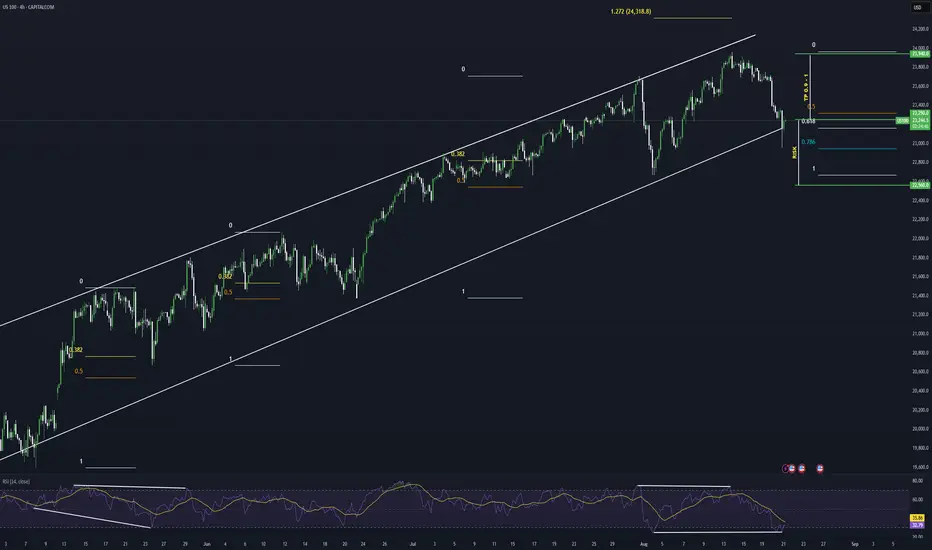
Over the course of the past couple of months, we witnessed an incredible rally on the Nasdaq. Following this previous price action, it is quite likely that we will soon see another correction. This could start with the current retest of the channel resistance trendline.
📝Levels to watch:
$23.000
SwingTraderPhil
SwingTrading.Simplified. | Investing.Simplified. | #LONGTERMVISION
NQCUSD trade ideas

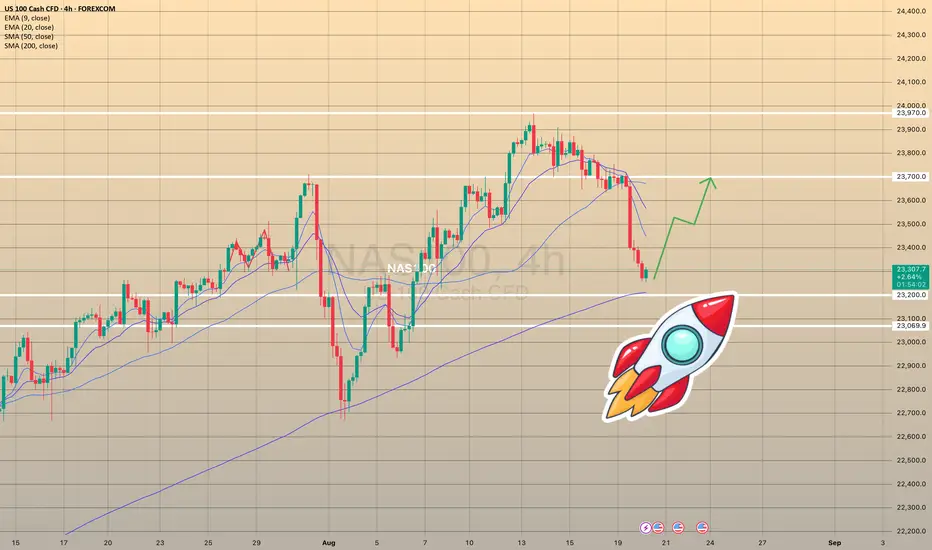
NAS100 falls slightly but conditions are still bullish!NAS100 climbed in a steep ascending trend and my expectation is for a continuation, with an upside target at around 24,000.
It is still clearly moving inside the channel, as predicted previously in my idea:
At 24.000 is where it can become a decision point, where price might correct again, or it pushes more and that’s when we might see the move start to gain more momentum.
But if price breaks below the trendline with conviction, it would invalidate the bullish scenario, suggesting that the uptrend may pause or could even reverse short-term.

Is this the top? SPY/QQQ Plan Your Trade Update For 8-20I know it has been a while since I shared a video.
This video is designed to share the downside risks I see as a potential for the markets IF this big speculative phase unwinds like I think.
Ultimately, you guys are the ones who will be making the trading decisions. I just want you to be aware that the markets are extremely volatile right now and the data is pointing to a very clean Excess Phase Peak (EPP) pattern.
As you are all aware, the EPP pattern suggests that a breakdown in price is likely where price may attempt to target the FLAG LOW.
If that happens, be prepared for a -15% to -20% breakdown in price before the end of 2025 - possibly seeing an even bigger price collapse.
In my opinion, this breakdown is the result of a broad unwinding of excesses related to the Biden economy (free money) and a move towards more reasonable US economic policies.
Overall, this pullback is necessary for the Wave 1 of Wave 5 structure to complete. Once this pullback is complete, the bigger rally phase (Wave 3 of Wave 5) will begin. And get ready for a big rally phase with Wave 3.
So, I hope this video helps you learn how to identify and plan for some of the biggest price swings in the SPY/QQQ, and prepare for even bigger moves in Gold/Silver and Bitcoin.
Get some.
#trading #research #investing #tradingalgos #tradingsignals #cycles #fibonacci #elliotwave #modelingsystems #stocks #bitcoin #btcusd #cryptos #spy #gold #nq #investing #trading #spytrading #spymarket #tradingmarket #stockmarket #silver

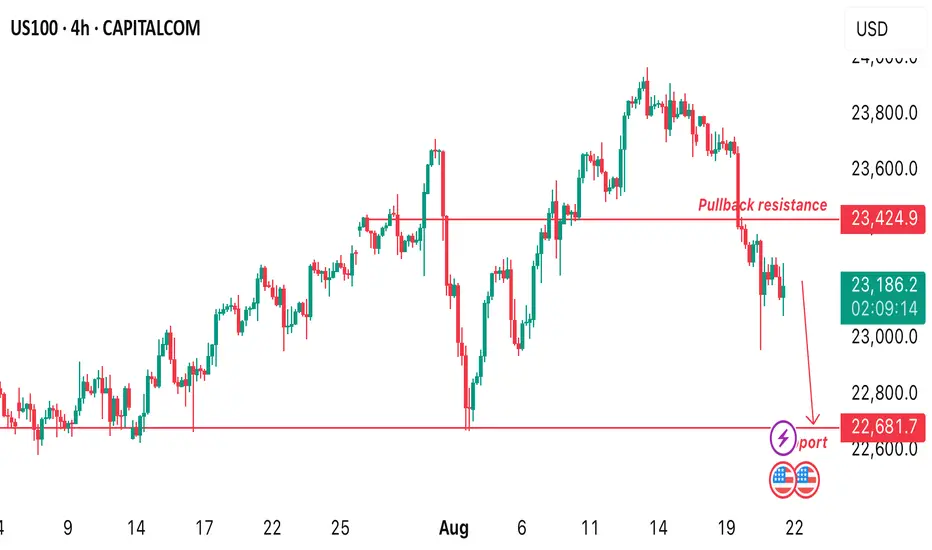
NASDAQ – Is the Top Finally In?In my past two NAS analyses, I argued that the index was overstretched and vulnerable to a deep correction. Even the fact that from the April bottom to mid-August it surged nearly 50% should have raised big red flags — that kind of move rarely sustains without a meaningful pullback.
At this moment, the technical picture has shifted significantly. The index has broken two critical levels:
1. The ascending trendline drawn from the recent low.
2. The horizontal support defined by the previous all-time high.
Losing both of these supports in quick succession suggests the bullish momentum is fading and a top may already be in place.
If this scenario unfolds as expected, selling pressure could intensify in the coming sessions. My first downside target stands in the 22,700 zone, with further weakness possible if the correction develops into a broader risk-off cycle.
Disclosure: I am part of TradeNation's Influencer program and receive a monthly fee for using their TradingView charts in my analyses and educational articles.

NAS100 - Potential TargetsDear Friends in Trading,
Fundamental:
Powell's Jackson Hole Speech today 30mins after NYSE open.
Anything is possible
Pattern = Bearish Pennant:
This pattern indicates a "SHORT".
Watch price reaction at the FVG and PIVOT (Dark Blue).
I sincerely hope my point of view offers a valued insight.
Thank you for taking the time study my analysis.

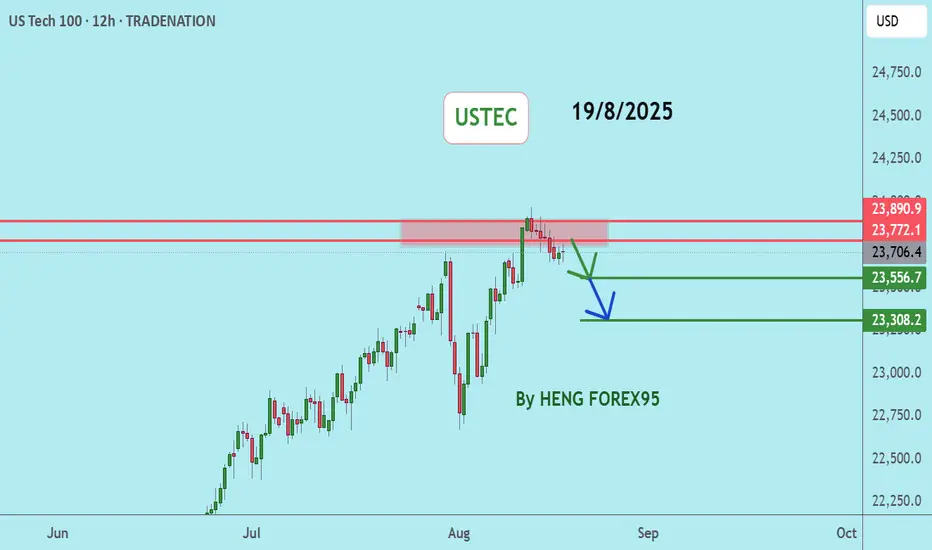
USTECUSTEC price is near the resistance zone 23772 - 238920. If the price cannot break through the 23920 level, it is expected that the price will likely go down in the short term. Consider selling in the red zone.
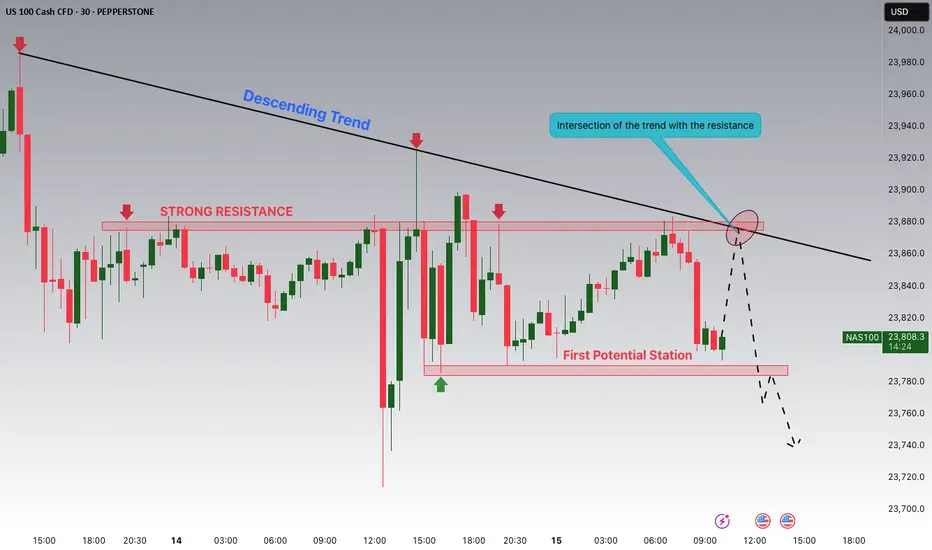
NASDAQ is Nearing the Intersection of The Trend with Resistance!Hey Traders, in today's trading session we are monitoring NAS100 for a selling opportunity around 23,875 zone, NASDAQ is trading in a downtrend and currently is in a correction phase in which it is approaching the trend at 23.875 support and resistance area.
Trade safe, Joe.
NSDQ100 awaits Fed Powwell's tone at Jackson Hole Key Drivers
Powell @ Jackson Hole (10am EST):
July FOMC was hawkish on labour, but payroll revisions weaker since → tone today could soften.
Market focus: whether Powell leans on labour weakness vs still-solid inflation & activity.
Outcome = pivotal for Fed cut expectations and tech valuations.
Macro/Policy Noise:
Halts & policy risks: immigration and visa restrictions could tighten labour supply, indirectly feeding wage/inflation concerns. NIH funding cuts add fiscal uncertainty.
Geopolitical chip tension: Nvidia halting H20 AI chip production under Beijing pressure raises supply-chain risk. Negative for semi names in the NASDAQ-100 (NVDA, AMD, AVGO).
US stance on chipmakers: No forced equity stakes → removes one overhang, but policy risk still high.
NASDAQ-100 Implications
Powell dovish → likely risk-on, tech rally (rate-sensitive growth).
Powell hawkish / inflation-first → risk-off, higher yields weigh on big tech multiples.
Chip news: Nvidia headline is a near-term drag; could spill over to the semiconductor complex (SOX index).
Net read:
Short-term cautious bias into Powell due to Nvidia headline + policy noise.
Direction after 10am EST depends on Fed tone—dovish shift = upside reversal, hawkish = further pressure on NASDAQ-100.
Key Support and Resistance Levels
Resistance Level 1: 23480
Resistance Level 2: 23720
Resistance Level 3: 23950
Support Level 1: 23100
Support Level 2: 22985
Support Level 3: 22740
This communication is for informational purposes only and should not be viewed as any form of recommendation as to a particular course of action or as investment advice. It is not intended as an offer or solicitation for the purchase or sale of any financial instrument or as an official confirmation of any transaction. Opinions, estimates and assumptions expressed herein are made as of the date of this communication and are subject to change without notice. This communication has been prepared based upon information, including market prices, data and other information, believed to be reliable; however, Trade Nation does not warrant its completeness or accuracy. All market prices and market data contained in or attached to this communication are indicative and subject to change without notice.

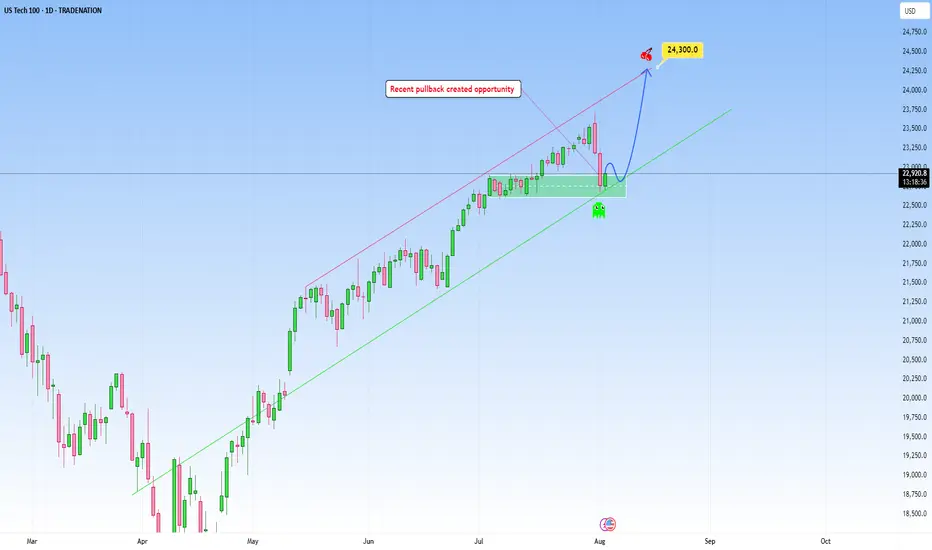
USTEC: Likely continuation following pullbackNAS100 climbed a steep uptrend and my expectation is for a continuation as marked on my chart, with an upside target at around 24,300.
This area here is where it can become a decision point, either price finds support and bounces, or it breaks below, and that’s when we might see the move start to extend lower.
If I were to take a side here, I would definitely choose more upside, but again only price action should determine next move.
But if price breaks below the trendline with conviction, it would invalidate the bullish scenario, suggesting that the uptrend may pause or could even reverse short-term.
Just sharing my thoughts for the charts, this isn’t financial advice. Always confirm your setups and manage your risk properly.
Disclosure: I am part of Trade Nation's Influencer program and receive a monthly fee for using their TradingView charts in my analysis.
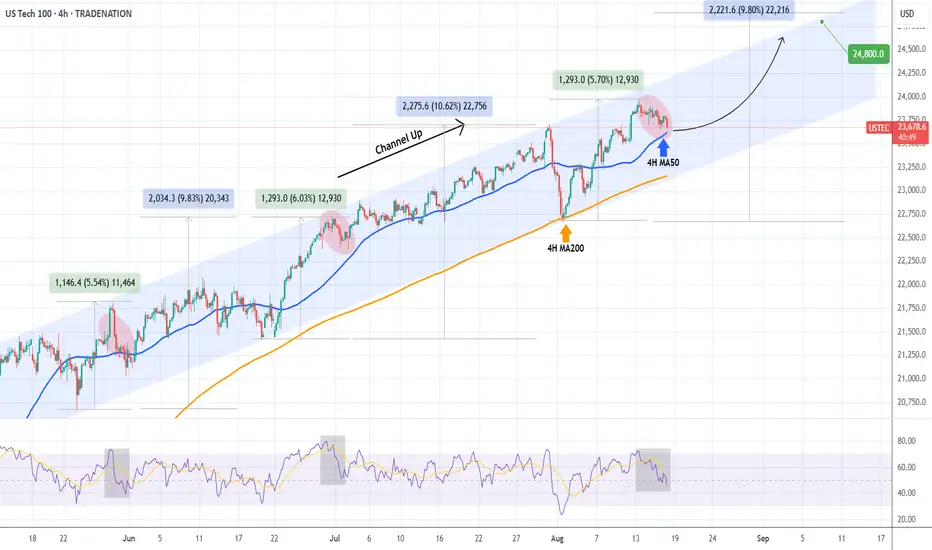
NASDAQ testing its 4H MA50. Will it offer Support?Nasdaq (NDX) has been trading within a Channel Up since May 11 and is approaching its 4H MA50 (blue trend-line) today following a Wednesday initiated pull-back.
Technically this is so far a normal correction for this pattern, which offers a short-term buy signal as the 3 times during those 4 months that it broke convincingly, it rebounded on or close to the 4H MA200 (orange trend-line).
As a result, if the 4H MA50 offers a rebound, we could see a +9.80% rebound from the 4H MA200, the minimum that this Channel Up has delivered upon a Bullish Leg. That gives a Target of 24800.
-------------------------------------------------------------------------------
** Please LIKE 👍, FOLLOW ✅, SHARE 🙌 and COMMENT ✍ if you enjoy this idea! Also share your ideas and charts in the comments section below! This is best way to keep it relevant, support us, keep the content here free and allow the idea to reach as many people as possible. **
-------------------------------------------------------------------------------
Disclosure: I am part of Trade Nation's Influencer program and receive a monthly fee for using their TradingView charts in my analysis.
💸💸💸💸💸💸
👇 👇 👇 👇 👇 👇
NASDAQ Potential Bullish ContinuationNASDAQ price action seems to exhibit signs of potential Bullish momentum as the price action may form a credible Higher Low with multiple confluences through key Fibonacci and Support levels which presents us with a potential long opportunity.
Trade Plan:
Entry : 23250
Stop Loss : 22560
TP 0.9 - 1: 23870 - 23940
USTEC INCOMING BEARISH MOVEMy analysis shows that there's a high chance the bearish move will continue. As we can see the price broke below our Uptrend Channel and made some sort of Double Top signifying a drop in bullish move.
Price then broke our major low, creating CHoC and confirmed a bearish move, now we see that it broke below the Previous low and made a deep retest to the zone, we can anticipate the price will continue going down but we will need candlestick confirmation for that
This is my intake of what will happen, follow for more Technical analysis and don't miss out😉

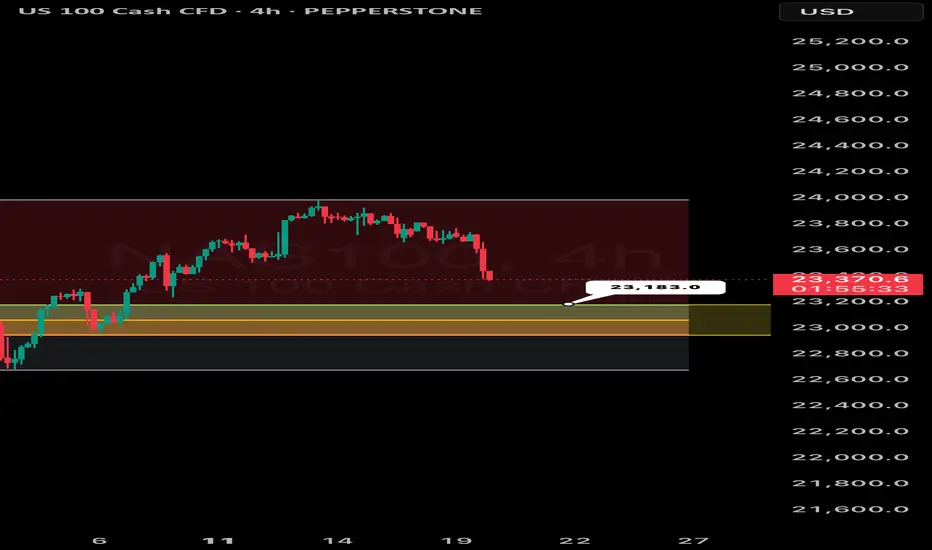
NASDAQ 100 (NAS100) potential reversal The NASDAQ 100 (NAS100 ) on the H4 timeframe it appears to be undergoing a period of consolidation within a defined range. As of approximately 20:46 (based on the timestamp), the index is trading around 23,383.6, having experienced a decline of -1.41% or 334.3 points.
Key Observations:
Recent Downtrend and Support Zone : The price action shows a clear downtrend leading into the current consolidation. The highlighted yellow zone around the 23,100 - 23,300 level seems to be acting as a support zone, preventing further immediate declines.
Resistance Zone : Conversely, an upper red zone around the 23,800 - 24,000 level is acting as resistance, capping the upside for the time being.
Range Bound Movement : The price is currently oscillating between these two defined zones, indicating a period of indecision in the market.
Potential Reversal Area : The fact that the support zone is holding after a significant down move suggests the possibility of a short-term reversal if buyers step in with conviction. However, this needs confirmation with a break above the resistance zone.
Breakout Scenarios :
Bullish Breakout: A sustained break above the 24,000 level could signal a continuation of an upward trajectory, potentially targeting previous highs.
Bearish Breakdown : Possibly, a break below the 23,100 level would likely confirm further downside pressure and could lead to testing lower support levels.
Technical Considerations :
Traders and investors should closely monitor price action within these zones. Look for confirmation signals such as strong candlestick patterns (e.g., bullish engulfing, bearish engulfing) or increasing volume on breakouts to gauge the strength and validity of potential moves.
Conclusion :
NASDAQ 100 is currently in a critical juncture. The consolidation within a potential reversal zone after a downtrend warrants careful observation. The direction of the next significant move will likely be determined by whether the support or resistance zone is broken decisively.
heading 23200, then we see if its a bounce or bearish dropsimple parallel uptrend has been broken, seems like we are heaing 23190 if its broken its a major downtrend.
not financial advice

NAS100 dropped on 1.32% on August 19NAS100 dropped on 1.32% on August 19 as market participants are waiting for Powell's key rate comments
The Nasdaq and S&P 500 dipped on August 19, led by tech stocks, as investors awaited Federal Reserve Chair Jerome Powell’s comments on interest rates at the Jackson Hole symposium (Aug. 21-23). Analysts, including James Cox of Harris Financial Group, suggest markets are bracing for a possibly hawkish stance from Powell. Interest rate futures indicate two 25 bps cuts this year, starting in September. Concerns also rose over AI stocks after OpenAI’s CEO Sam Altman called them a bubble in a recent "The Verge" interview.
The price continued to drop during Asian and early European trading hours and reached the SMA200 on 4-h chart. This moving average is a traditionally strong support. The further rebound towards 23,500.00 level is expected with a final target of 23,700.00.
Nasdaq 100 Analysis: Tech Stocks Face Sell-OffsNasdaq 100 Analysis: Tech Stocks Face Sell-Offs
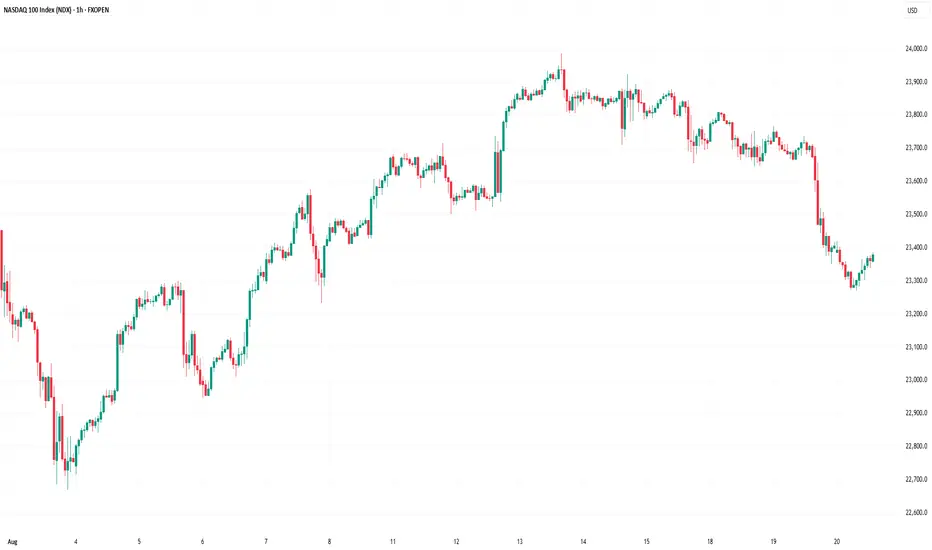
As the chart shows, the Nasdaq 100 index fell by approximately 1.6% yesterday.
According to media reports, bearish sentiment has been fuelled by the approach of key events:
→ the release of the FOMC meeting minutes (today at 21:00 GMT+3);
→ Jerome Powell’s speech at the Jackson Hole symposium on Friday. Market participants are preparing for remarks from the Fed Chair on the trajectory of interest rates.
Notably, the S&P 500 declined less significantly, while the Dow Jones remained virtually unchanged. This suggests that:
→ tech stocks are heavily overvalued due to AI-driven hype;
→ capital shifted yesterday from risk assets (including cryptocurrencies) into so-called safe havens.
Could tech stocks continue to decline?
Technical Analysis of the Nasdaq 100
Analysing the Nasdaq 100 index chart on 5 August, we plotted the main upward channel (shown in blue). It remains valid, as since then the price has:
1→ reached the upper boundary, which (as often happens) acted as resistance;
2→ retreated to the median line, where volatility decreased (a sign of balance between supply and demand), but only briefly.
Yesterday’s low coincided with the lower boundary of the channel.
From a bullish perspective, buyers might rely on:
→ a resumption of the uptrend from the lower boundary (as was the case in early August);
→ support at the 50% retracement level after the A→B impulse (located around the current price area);
→ a rebound from the oversold zone indicated by the RSI;
→ support at the 7 August low of 23,250 (a false bearish breakout remains possible).
On the other hand: the price has confidently broken through the channel median and then accelerated downwards (a sign of imbalance in favour of sellers). This imbalance zone (which, under the Smart Money Concept methodology, is considered a bearish Fair Value Gap) could act as resistance going forward.
Given the pace of yesterday’s decline, we could assume that sellers currently hold the initiative. Should we see weak rebounds (in the style of a dead cat bounce) from the channel’s lower boundary, the likelihood of a bearish breakout could increase.
This article represents the opinion of the Companies operating under the FXOpen brand only. It is not to be construed as an offer, solicitation, or recommendation with respect to products and services provided by the Companies operating under the FXOpen brand, nor is it to be considered financial advice.
US100 MARKET OUTLOOKIf price continues to fall, the next support level would be at 22681.7 if we begin to see a pullback from the current price. The nearest resistance would be at 23518 we’d be monitoring price for a clearer price action before we begin to take trading decisions
NASDAQ holding up on Bulls. OANDA:NAS100USD Price is holding up on buys but what's for rest of this week eh..? Is price bout to break those previous highs and head all the way to the top? What do y'all have in mind traders let me know on the comment session 💯

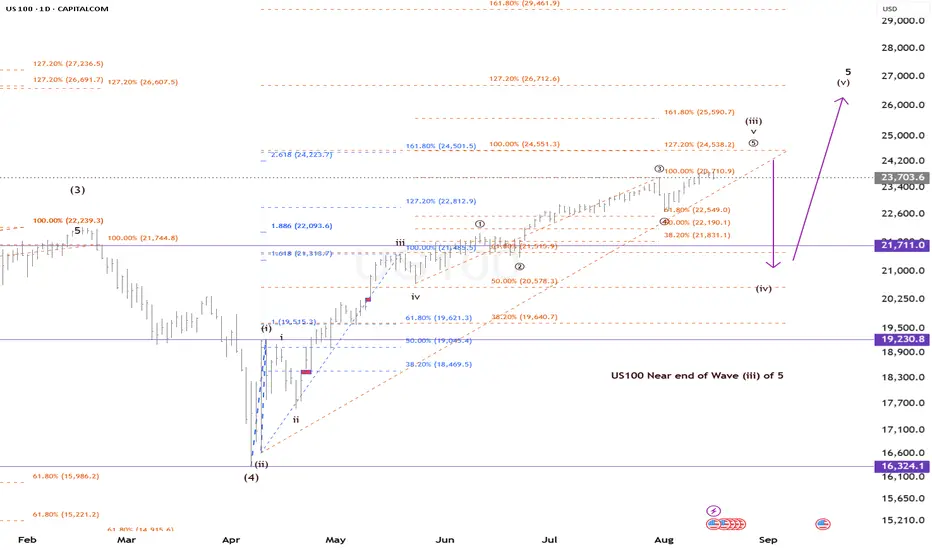
US100 Near End of Wave ((v)) of 3 of (5)Overall Wave Structure (2016–2025):
Wave 1 (or Sub-Wave Extension, 2016–2018): From ~4,266 (Feb 2016 trough) to ~8,109 (Sep 2018 peak). This is often labelled as an impulsive advance, subdivided into five smaller waves, driven by post-financial crisis recovery and tech innovation.
Wave 2 (Correction, Late 2018): A sharp 3-wave (A-B-C) zigzag down to ~6,190, retracing about 38.2% of Wave 1 (Fibonacci level). This aligns with classic Elliott rules for wave 2 corrections being deep but not exceeding the start of wave 1.
Wave 3 (Extended Rally, 2019–2021): The strongest impulse, from ~6,190 to ~16,057 (Nov 2021 peak). Subdivided into five sub-waves, with extensions in sub-wave iii, reflecting the pandemic-era tech surge.
Wave 4 (Major Correction, 2022): A complex 3-wave decline (A-B-C) to ~10,213 (Oct 2022 trough), retracing ~38.2%–50% of Wave 3. Sources describe it as a "setup for higher highs," not the end of the bull cycle.
Wave 5 (Ongoing Advance, 2023–2025): From ~10,213 to current, but really near the peak of wave ((v)) 5(3), with prospect of a deep corrective. Character of the end of wave 5 includes a broadening market, with the main group of drivers of growth being stagnant. Wave 5 is also characterised with euphoria, sometimes things looks rossy, bright and never ending bullishness before an abrupt pivot down.
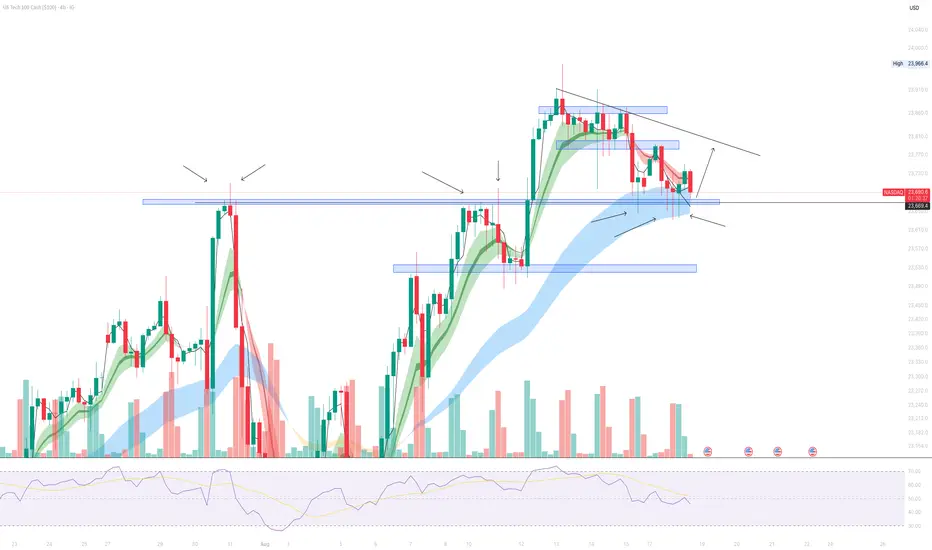
Nasdaq Retest of Previous Highs - REPOST📈 NASDAQ Outlook
The NASDAQ has broken through its previous high, and now the key level to watch is whether price action confirms this zone as new support.
If buyers step in and hold this level, we could see a continuation to the upside—with momentum potentially driving us toward the downward trendline.
Patience is key here as we wait for confirmation before the next move.
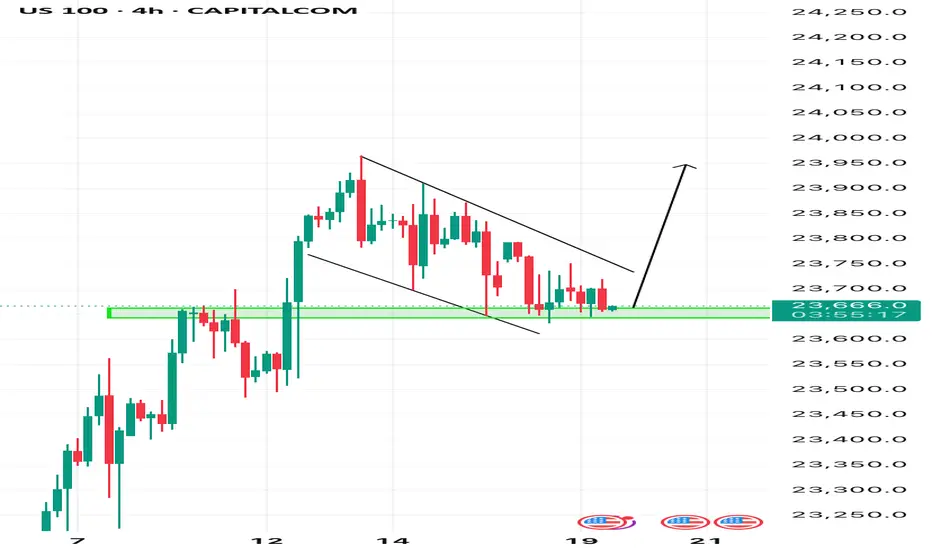
US100 - Bullish Flag setup US100 pulled back to the previous resistance looking to turn it into a support, the pullback comes in a correction manner forming a bullish flag pattern.
NAS100 continues its BULLISH TREND.Resistance is turning into support again.
.The market has reached the exact 0.618 Fibonacci level.
.Price is continuously forming Higher Highs (HHs) and Higher Lows (HLs).
.Go with the market trend.

Nasdaq to 24k!!!I remain constructive on the NASDAQ as we head into the second half of the year. Chair Powell’s remarks at Jackson Hole reinforced that rate cuts are coming, though they will be measured rather than front-loaded. This approach reflects confidence in the economy’s resilience while ensuring inflation continues to trend lower.
Historically, years ending in 5 have shown strong equity market performance under the decennial theory. Combined with improving liquidity conditions and a supportive policy backdrop, the setup favors continued strength in growth and technology-driven sectors.
From a technical perspective, the NASDAQ has already established a hard low near the 22,900 level, which now serves as a strong support zone. Since then, the index has been consistently forming higher highs and higher lows, reinforcing the bullish structure. This price action confirms that buyers remain in control and strengthens the case for continued momentum in the months ahead.
In my view, these factors create a durable foundation for the NASDAQ to remain bullish, with momentum likely to build as markets look ahead to a more accommodative environment.
