1 hour chart After take out at new ATH last week and break trough the 23700 level i think we are in a desending chanel and the breakout will be up.
The market has show alot of support around 23700 level for days now and after a strong elliot vawe 5 up it would go down alot faster if the bullsih trend was over.
Think we have 123 elliot or 12345 elliot vawe forward us now as long as we break out the desending chanel as i think!
Buy = 23700
Target Phase 1= 23900
Target Phase 2= 24000
Stoploss = 23600
Also fib retracment from the top stop at 0.618 directly wich is another strong support
Rsi 14= around 50 level and on 1 hour chart neutral and looks bullsih there to!
NQCUSD trade ideas

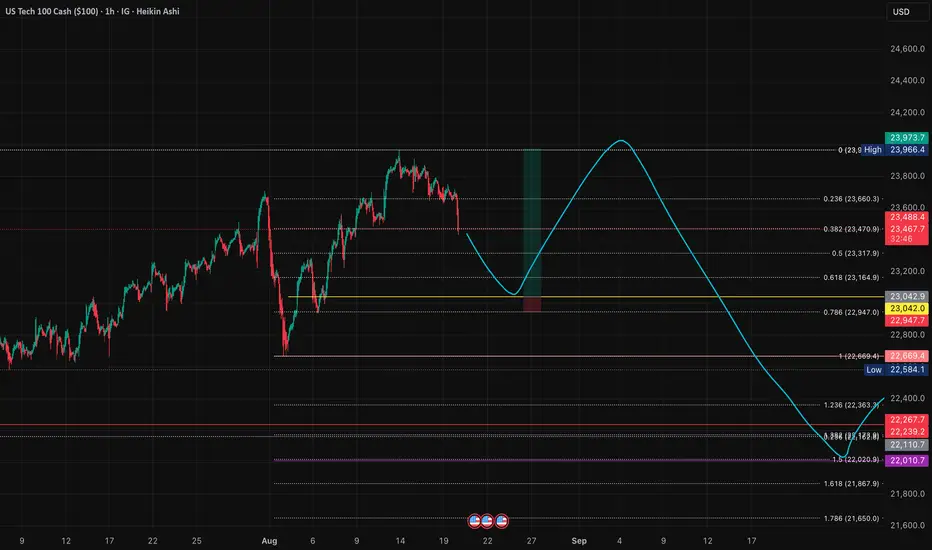
EuphoriaAll time highs in a newer major, more vertical parallel. Likely a roll over and then possibly retest ATH again.

Nasdaq 100 can entering to bear zone In coming days all this level can see
22600
21600
20600
If this level breaks it can touch 18000

comments on this (short) Predictions?Recently, we have been seeing the (Nas) slowly retracing.
Although, we are on a uptrend on higher time frames.
The chances for a swing higher has been decreasing.
On market news along with other pairs, such as (Gold)
is projected to go long. So in theory we might catch
a good retracement on the (NAS).
NSDQ100 corrective pullback supported at 23233Tech drag dominates: The NASDAQ fell -1.46%, its worst day since Aug 1, led by the Magnificent 7 (-1.67%). Nvidia (-3.5%) was the biggest loser and set the tone for semis and AI-linked names.
Index divergence: Despite the cap-weighted S&P falling (-0.59%), the equal-weighted S&P rose (+0.45%), showing the selloff was tech-concentrated rather than broad. That highlights rotation into cyclicals/defensives away from mega-cap tech.
Stock specifics:
Intel (+6.97%) surged on the $2bn SoftBank stake, bucking the chip weakness.
Home Depot (+3.17%) outperformed on earnings, showing consumer/housing resilience—positive for broader equities but less relevant for tech.
Rates backdrop: 10yr UST yields fell -2.7bps to 4.31% after S&P affirmed the US AA+ rating. Lower yields normally support growth/tech, but today’s positioning and rotation outweighed rate relief.
Fed/policy watch:
Treasury Sec. Bessent hinted at Fed Chair decision timing (Powell’s replacement watch).
Markets remain priced for a jumbo cut in September, with focus shifting to Jackson Hole this week—key risk event for Nasdaq given rate-cut sensitivity.
Geopolitics: Noise around Ukraine security guarantees and Switzerland’s peace-talk stance was not market-moving for tech.
Relevance for NASDAQ100 traders:
Yesterday’s selloff was tech-specific, not broad market weakness, implying concentration risk in mega-caps.
Intel’s rally shows idiosyncratic catalysts can break correlation.
Watch Jackson Hole & Fed rate-cut pricing → likely main driver for Nasdaq100 short-term.
Rotation risk: If the equal-weighted S&P keeps outperforming, the Nasdaq may underperform further unless big tech regains leadership.
Key Support and Resistance Levels
Resistance Level 1: 23710
Resistance Level 2: 23950
Resistance Level 3: 24200
Support Level 1: 23233
Support Level 2: 23110
Support Level 3: 22985
This communication is for informational purposes only and should not be viewed as any form of recommendation as to a particular course of action or as investment advice. It is not intended as an offer or solicitation for the purchase or sale of any financial instrument or as an official confirmation of any transaction. Opinions, estimates and assumptions expressed herein are made as of the date of this communication and are subject to change without notice. This communication has been prepared based upon information, including market prices, data and other information, believed to be reliable; however, Trade Nation does not warrant its completeness or accuracy. All market prices and market data contained in or attached to this communication are indicative and subject to change without notice.
NASDAQ Index Analysis (US100 / NASDAQ):The index remains bullish in the long term, while showing a short-term bearish correction on the hourly timeframe. Currently, it is trading near 23,700.
🔻 Bearish Scenario:
If the price breaks below 23,650 and holds, it may extend the decline toward 23,550. A further break could trigger deeper corrections.
🔺 Bullish Scenario:
If the price manages to break and sustain above 23,770, it could push the index higher toward 23,800, and with continued bullish momentum, a retest of the previous high at 23,950 would be likely.


How to determine if the Fed will change target interest rates?In this video, I explain the mechanism of the Fed target interest rates and how to determine if the Fed will cut the target interest rates in September 2025 (or any other FOMC). I also talk about the Overnight Reverse Repo balance sheet and the draining of the balance from a high of 2.55T on 30th Dec 2022 to just 25B as of 21st Aug 2025. I hypothesize a scenario from now till the September FOMC:
1. The Overnight Reverse Repo is completely emptied, meaning the stealth liquidity is gone.
2. The Equity Markets suffers a sharp fall (even a crash).
3. Funds rotate into US treasuries, causing yield to fall.
4. Fed cuts target interest rates without having to monetize the debts.
The most important key takeaway in this video is to understand that in order to know if the Fed will do anything is to see the 3month government bond yield. All the other information are supplementary and provide us information to paint a narrative on how the market will move in the coming weeks.
As aways, keep your risks tight, and Good Luck!

“How I Trade NAS100 with 4H Order Flow + 15M Precision Entry”Here’s my step-by-step process for catching high probability NAS100 setups 👇
1️⃣ Direction from 4H Order Flow
– I only look for trades in the direction of the 4H structure.
– My key levels are 4H OBs and 4H FVGs.
2️⃣ Patience at the Key Level
– No random trades. I wait until price reacts to one of my 4H levels.
3️⃣ 15M Entry Model (MSS + IFVG)
– Once price reacts, I refine entry on the 15M chart using MSS (Market Structure Shift) + IFVG (Inverted Fair Value Gap).
– This keeps risk tight and entries precise.
4️⃣ Risk Management
– I always place stop loss at the invalidation point.
– Targeting a minimum of 1:2 Risk to Reward.
⚡ The edge is simple: Only trade what pays me. Nothing else.
Nasdaq100, DJIA & S&P500 - Quick technical analysisThe top three US indices are near their all-time highs. Will we see new all-time highs?
Let's take a look.
MARKETSCOM:US100
MARKETSCOM:US30
MARKETSCOM:US500
Let us know what you think in the comments below.
Thank you.
75.2% of retail investor accounts lose money when trading CFDs with this provider. You should consider whether you understand how CFDs work and whether you can afford to take the high risk of losing your money. Past performance is not necessarily indicative of future results. The value of investments may fall as well as rise and the investor may not get back the amount initially invested. This content is not intended for nor applicable to residents of the UK. Cryptocurrency CFDs and spread bets are restricted in the UK for all retail clients.

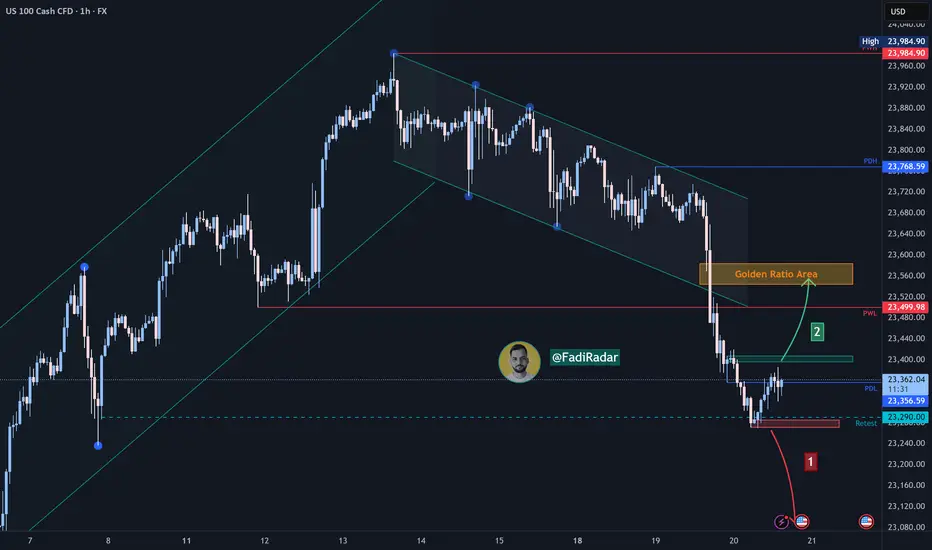
NASDAQ Index (US100 / NASDAQ) AnalysisThe index is moving in a bullish trend on the higher timeframes (Daily – H4), while showing a bearish move on the 1H timeframe. Currently, it is trading near the 23,340 area.
🔻 Bearish Scenario:
If the price breaks below 23,270 and holds, it may head to retest 23,080.
🔺 Bullish Scenario:
If the price manages to break and hold above 23,400, this could support a continuation towards 23,560 (a potential reversal zone – Fibonacci golden area). However, if buying momentum continues, the path could extend towards 23,680.
NASDAQ Index Analysis (US100 / NASDAQ):The index is moving within an overall upward channel in the long term, while showing a short-term bearish trend on the hourly timeframe. Currently, it is trading near the 23,700 level.
🔻 Bearish Scenario:
If the price breaks below 23,650 and holds beneath it, the index may test the 23,550 level. A further break could open the door for deeper corrections toward lower zones.
🔺 Bullish Scenario:
On the other hand, if the price manages to break and hold above 23,800, this could support continued bullish momentum towards a new high at 23,950.

NAS100 - Uptrend Intact, Prefer Pullback LongsPrimary trend remains up. A brief weekly break lower did not hold, so I favor continuation after a dip to let entries load. If we get the pullback into marked demand or trend support, I’ll look for longs targeting the path higher. There is overhead supply near all-time highs, so I will treat that zone as take-profit rather than assume discovery beyond it on first touch.

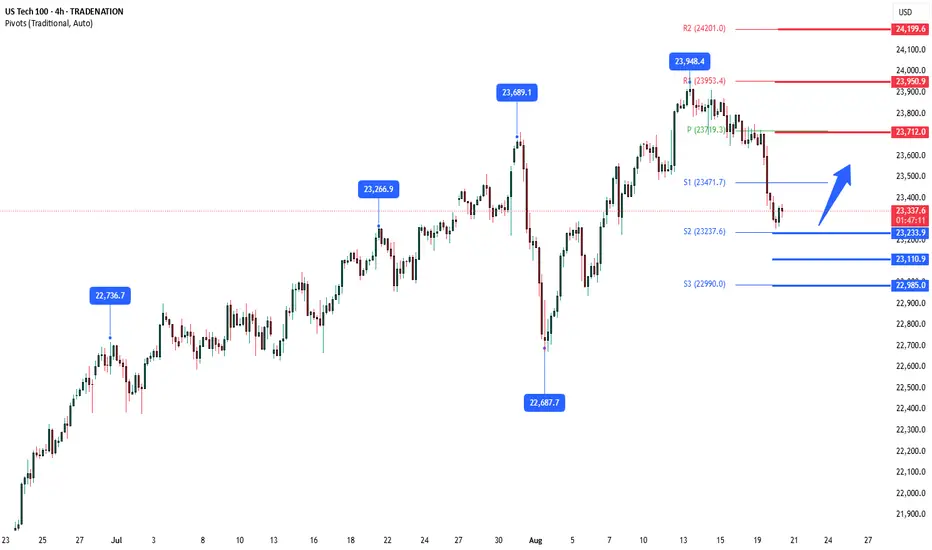
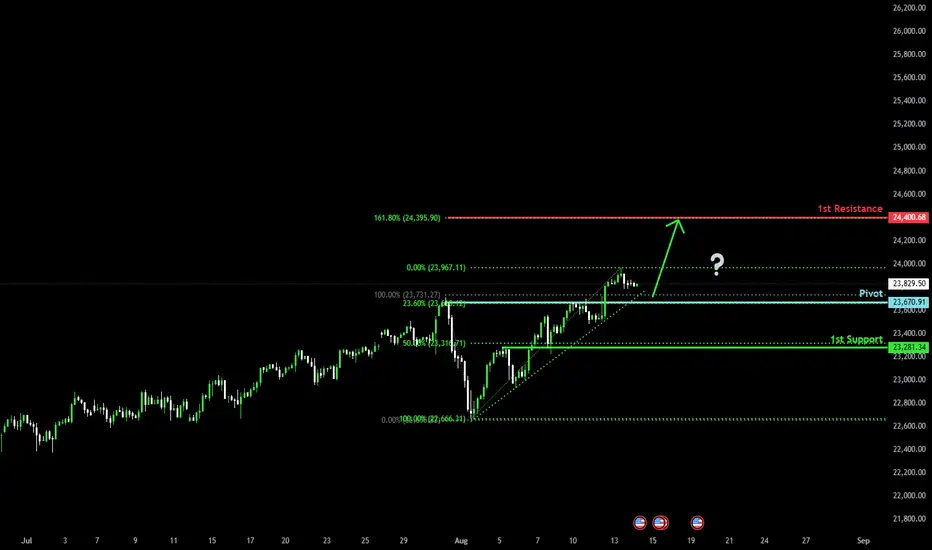
Bullish continuation?USTEC is falling towards the pivot which has been identified as a pullback support and could bounce to the 1st resistance.
Pivot: 23,670.91
1st Support: 23,281.34
1st Resistance: 24,400.68
Risk Warning:
Trading Forex and CFDs carries a high level of risk to your capital and you should only trade with money you can afford to lose. Trading Forex and CFDs may not be suitable for all investors, so please ensure that you fully understand the risks involved and seek independent advice if necessary.
Disclaimer:
The above opinions given constitute general market commentary, and do not constitute the opinion or advice of IC Markets or any form of personal or investment advice.
Any opinions, news, research, analyses, prices, other information, or links to third-party sites contained on this website are provided on an "as-is" basis, are intended only to be informative, is not an advice nor a recommendation, nor research, or a record of our trading prices, or an offer of, or solicitation for a transaction in any financial instrument and thus should not be treated as such. The information provided does not involve any specific investment objectives, financial situation and needs of any specific person who may receive it. Please be aware, that past performance is not a reliable indicator of future performance and/or results. Past Performance or Forward-looking scenarios based upon the reasonable beliefs of the third-party provider are not a guarantee of future performance. Actual results may differ materially from those anticipated in forward-looking or past performance statements. IC Markets makes no representation or warranty and assumes no liability as to the accuracy or completeness of the information provided, nor any loss arising from any investment based on a recommendation, forecast or any information supplied by any third-party.
NAS100 - Market Structure, Confluence & FIBDear Friends in Trading,
How I see it,
Keynote:
I missed the big drop, not sure if investors will try to recover before Friday's
Retail data and Powell speech.
1) I will look for quality scalping Long / Short opportunities till then.
2) I indicated the confluences - price action may rocket or drop
strongly between them.
Let me know if anything is unclear.
I sincerely hope my point of view offers a valued insight.
Thank you for taking the time study my analysis.
NAS100 Bullish OutlookHi there,
The NAS100 on the H2 chart appears bullish, following the (B) sequence to HH (C), then potentially pulling back up to 24,431, with two price targets. Price is stretched and unstable. Volatility seems thin but bullish over the H4 and the daily timeframes.
There will need to be monitoring.
Happy Trading,
K.

NAS100 - Stock Market Waiting for Jackson Hole Leak!The index is above the EMA200 and EMA50 on the 4-hour timeframe and is trading in its ascending channel. If the index corrects downwards towards the specified demand zones, you can buy Nasdaq with appropriate reward and risk.
According to a recent report from JPMorgan, the new U.S. tariffs could have significant repercussions for the American economy. The bank projects that these tariffs may reduce U.S. GDP by as much as 1% while simultaneously pushing inflation higher by up to 1.5%.
This year’s tariff hikes represent the largest increase since World War II, with the effective tariff rate rising to nearly 18%. With the expiration of tariff exemptions on imports under $800, consumer goods prices are expected to climb further.
JPMorgan has warned that both consumers and businesses may struggle to absorb these additional costs, raising the risk of stagflation. Meanwhile, monthly inflation has remained within the 0.3% to 0.5% range, suggesting that the Fed’s preferred inflation gauge could rise toward 3% to 3.5%.
As U.S. tariffs have surged to their highest levels in decades, revenues from these duties hit a record $28 billion in July. According to estimates by the Tax Foundation, tariff revenues could total about $2.2 trillion by the end of this decade. However, this is also expected to trim GDP by around 0.9%.
Research conducted by Yale University indicates that tariff policies could reduce annual household income by approximately $2,400, since part of these tariff costs are passed on to consumers by companies.
At the same time, Berkshire Hathaway, led by Warren Buffett, has made notable adjustments to its investment portfolio:
• It purchased 6.6 million shares of steelmaker Nucor.
• It added 5 million shares of healthcare insurer UnitedHealth.
• It fully divested its holdings in T-Mobile US.
• It trimmed its stake in Apple by 6.7%, reducing its position to 280 million shares.
Meanwhile, Goldman Sachs reiterated its outlook that the Federal Reserve will cut interest rates three times before the end of 2025. The projected reductions include three 25-basis-point cuts in September, October, and December. Additionally, two further cuts are expected in 2026, bringing the terminal rate down to the 3%–3.25% range. Markets have already increased their bets on a September rate cut. Recent weakness in inflation and employment data has paved the way for such accommodative policy measures.
Federal Reserve Chair Jerome Powell is scheduled to deliver a speech at the Jackson Hole Symposium on August 22, 2025—an event that has become an unofficial policy-setting platform. Analysts at Morgan Stanley expect Powell will attempt to temper market expectations for a 50-basis-point cut in September. Given the political pressures and mixed economic signals, Powell may only endorse a 25-basis-point cut, or potentially push back against easing altogether.
Any of these outcomes could disappoint markets, especially if Powell fails to deliver clear guidance. His speech may therefore play a decisive role in shaping U.S. monetary policy for the remainder of the year and could drive heightened volatility across markets.
Although this week’s economic calendar features several important housing and manufacturing reports, the spotlight will remain firmly on the Fed. On Tuesday, July housing starts and building permits data will be released. Wednesday brings the FOMC’s July meeting minutes, speeches from key Fed officials Waller and Bostic, and the official kickoff of the annual Jackson Hole Symposium.
On Thursday, markets will digest a packed set of data, including the Philadelphia Fed manufacturing index, weekly jobless claims, the preliminary August S&P Global PMI, and July existing home sales.
The highlight of the week will be Friday, when all eyes turn to Jerome Powell. His annual Jackson Hole speech is expected to provide fresh clues about the Fed’s policy trajectory—guidance that could strongly influence market direction in the weeks ahead.

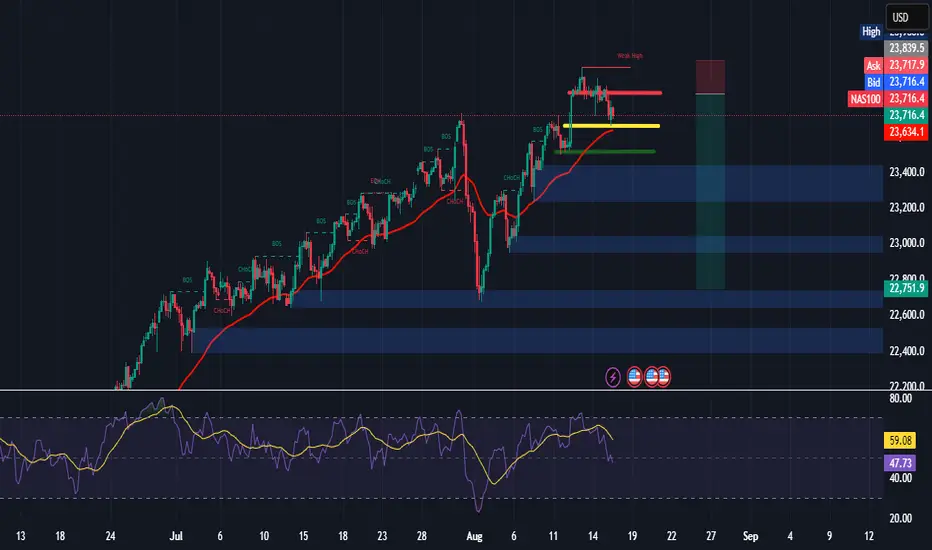
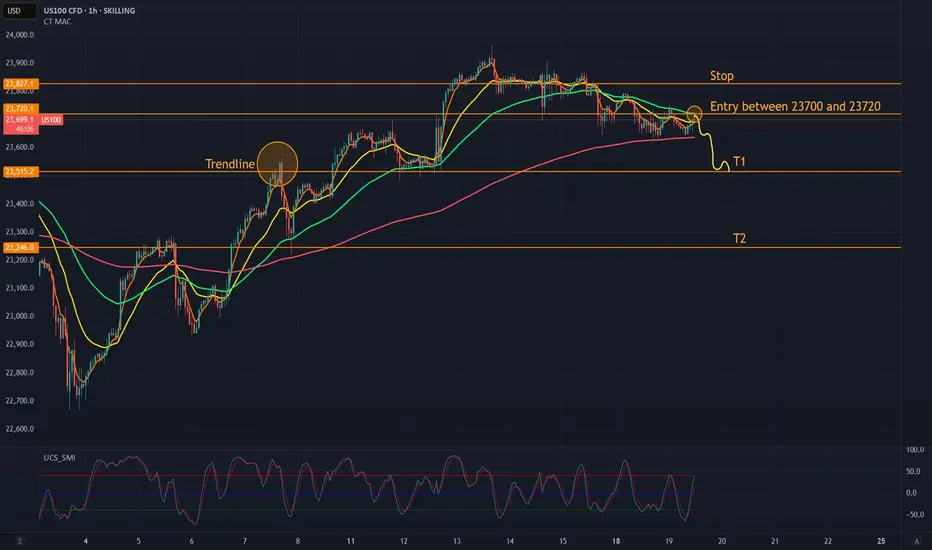
US100 – Short Setup Based on Visible WeaknessThe Nasdaq 100 (US100) is currently trading around 23,700 and has shown clear signs of weakness in the past few hours.
On the 1-hour chart, the price has tested the area between 23,700 and 23,720 multiple times but failed to break through. Moving averages (yellow, green, and red lines) are flat or turning downward, which signals that bullish momentum is fading.
Trade Setup
Entry Zone: 23,700 – 23,720
This area has acted as resistance several times, meaning the price keeps bouncing off it without breaking higher.
Stop Loss: Above 23,827
This is the most recent clear high on the chart. If price breaks above this level, the setup is invalid.
Target 1 (T1): 23,515
This level acted as support on August 13 and 15. Price bounced here twice, making it a realistic first target.
Target 2 (T2): 23,246
This level was support on August 8 and 9 and could be reached if T1 breaks.
Why Short?
Price is below the 21 EMA on 4h timeframe (yellow line): This is a sign of weakening trend strength.
Price rejected multiple times at the moving averages: Buyers failed to push higher.
No new highs: Even after several attempts, price could not break above 23,827.
What supports the short idea right now
Tech under pressure: Meta and Palantir are both trading lower after weak follow-ups on AI and earnings momentum. This drags on overall sector sentiment.
No new highs: The market failed again to break above the last swing high at 23,827, which strengthens the case for continued consolidation or downside.
Dollar strength creeping in : Ongoing geopolitical tension (Ukraine, Trump talks) is pushing the USD up slightly – this tends to weigh on tech stocks.
Jackson Hole caution : Markets are waiting for Powell’s comments later this week. Until then, many traders stay risk-off, which favors downside movement or at least weak buying.
Summary
📉 Short entry: 23,700 – 23,720
⛔ Stop: Above 23,827
🎯 T1: 23,515
🎯 T2: 23,246
No financial advice – just my personal trade idea based on what the chart shows and the current macro situation.
And don’t forget: the market has two moods – “not yet” and “too late.” :D
NASDAQ: 10:1 R/R Setup - One More High Before Major CorrectionSharing my current outlook on NASDAQ with a high-probability setup offering exceptional risk-reward. 📊
**🎯 The Setup:**
I'm expecting one more push to new all-time highs from the yellow line around 23,000. This would offer a **10:1 risk-to-reward ratio** with the stop loss just below the recent low. 🚀
**📍 Yellow Line Logic:**
This level represents my experience-based zone just shy of the 0.786 Fibonacci retracement. I've observed that when price reaches the 0.786 level, it tends to result in a complete reversal more often than not. This yellow line sits in that "sweet spot" where buyers typically step in. 🎯
**📈 Chart Structure Support:**
The overall chart pattern suggests a higher probability of making new highs rather than a complete reversal from current levels. The structure is bullish despite the recent pullback. ✅
**🔄 Bigger Picture Scenario:**
After the anticipated new high, I expect a significant retracement back toward the previous high (red line area). However, this would likely be just a healthy correction before the bull run resumes for the remainder of the year. 📉➡️📈
**🧠 Key Insight:**
Sometimes the best trades come when the market gives you that "one more push" setup. The risk is small relative to the potential reward, making this a compelling opportunity if the setup materializes. 💡
📈 **This trade setup offers a risk-to-reward ratio of 10:1.** Without including fees, the breakeven win rate for this trade would be approximately 9.09%. Knowing these figures in advance helps me avoid emotional trading. 🧠
💡 **Pro Tip**: If you often find yourself trading based on emotions, I recommend doing this type of pre-planning and quantifying your setups before execution — it can be a simple yet highly effective improvement. ✅
---
**Trading is simple.** You don't need multiple indicators or dozens of lines on your chart. A clean and simple chart often works best — it keeps your decisions consistent and reduces uncertainty. Sure, it might not look flashy, and my analysis may seem a bit "plain" compared to others… but that's how I like it. If you find this analysis useful, feel free to follow me for more updates.
---
*Disclaimer: This post is for general informational and educational purposes only. It does not constitute financial advice, investment recommendation, or a service targeting specific investors, and should not be considered illegal or restricted information in any jurisdiction.*
NASDAQ Technicals
NASDAQ (NAS100) Technical Analysis
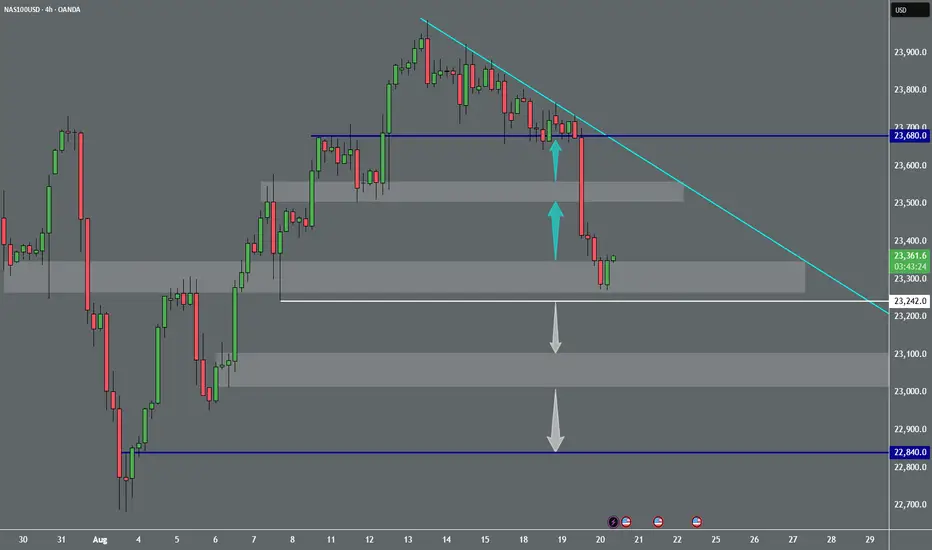
Based on the 4 hour chart, NASDAQ (NAS100) is currently showing range bound price action, indicating a period of consolidation after a recent downtrend. This price behavior suggests a tug of war between bulls and bears, with neither side able to decisively break through key support or resistance levels.
Key Levels and Price Zones
The market is trading within a defined range. The key support zone is identified around 23,055 to 22,958. This is a critical area, as a clean break below it would signal a continuation of the previous bearish trend. The primary resistance zone is located between 23,309 and 23,418. This zone must be broken and held for a potential bullish reversal to be considered.
Bullish and Bearish Scenarios
* Bullish Scenario: For a bullish trend to resume, the price needs to break above the 23,418 resistance level. A confirmed breakout with a subsequent retest of this level as support could open the door for a move towards the higher resistance at 23,736. Traders should watch for a strong bullish candle closing above this zone and an increase in buying volume to confirm the breakout.
* Bearish Scenario: The bearish outlook remains intact as long as the price stays below the resistance zone. A break below the support zone around 22,958 would be a significant bearish signal. This could lead to a further drop toward the lower range's support at 22,690. A strong bearish candle closing below the support zone would provide confirmation.
Risk Management and Final Thoughts
Given the current consolidation, traders should be cautious about initiating new positions without clear confirmation. The most prudent approach is to wait for a definitive breakout above resistance or a breakdown below support. Trading within the range can be highly volatile and is generally considered higher risk. Placing stop loss orders outside of the key support and resistance zones is crucial to manage potential risks effectively. The current technical screenshot of NAS100 is one of indecision, and a significant move is likely on the horizon once one of the boundaries is breached.

NAS100/TEC100 - TIME TO GO LONG Team
time to enter LONG NAS at 23500-23540
Stop-loss: Below 23,460 (clear channel support).
First target: 23,620–23,640 (scalp partials).
Main target: 23,680–23,700 (if momentum carries)
LETS GO

US100 Bulls Eye 0.618 Fib Zone with Flag Formation & TrendlineUS100 is showing a powerful confluence of bullish signals. Price is currently resting at the 0.618 Fibonacci retracement level, aligned perfectly with a key trendline support. A bullish flag pattern is forming, suggesting potential continuation to the upside. Adding to the setup, a 30-minute bullish divergence is visible.

Technical Analysis for NAS100Closing Price: 23,716.40 (16th Aug 2025, 2:05 AM UTC+4)
Analysis Methods: Japanese Candlesticks, Harmonic Patterns (ABCD, M/W), Elliott Wave, Wyckoff, Gann Theory (Time/Square of 9/Angles), Ichimoku, RSI, Bollinger Bands, VWAP, Moving Averages (MA/EMA/SMA/WMA).
1. Long-Term Trend (Weekly/Monthly)
Elliott Wave:
NAS100 is likely in Wave (V) of a multi-year bull cycle (Wave III peak: 24,500 in Jul 2025, Wave IV correction to 22,800).
Target: 24,800–25,200 for Wave V completion (1.618 extension of Wave I).
Gann Price Forecasting:
Square of 9: √23,716.40 ≈ 154.00 → Key resistance at 155² = 24,025, then 156² = 24,336.
Major Support: 153² = 23,409 (Gann 45° angle).
Ichimoku (Weekly):
Tenkan/Kijun: Bullish crossover (Tenkan: 23,200 > Kijun: 22,900).
Cloud: Price above thick Senkou Span (23,000–23,300) – bullish momentum.
Moving Averages:
Monthly EMA(50): 22,500 (primary trend support).
Swing Outlook: Bullish but extended. Final Wave V rally possible to 24,800–25,200.
2. Medium-Term Swing (4H/Daily)
Harmonic Patterns:
Bearish ABCD on 4H:
A: 23,900 → B: 23,400 → C: 23,800 → D: 23,730–23,750 (1.272 BC extension).
Bullish Bat (M Pattern) on daily: Potential reversal zone near 23,400 (0.886 XA retracement).
Wyckoff Phase:
Distribution signs above 23,700:
Upthrust at 23,780 (15th Aug) on declining volume.
Lack of demand above 23,750.
Gann Theory:
Time Window: Aug 19–21 (Square of 9 date cluster) for reversal risk.
Price-Time Squaring: 23,716 aligns with Aug 16 – watch for consolidation.
Indicators:
RSI(14) + Bollinger Bands (Daily):
RSI: 67 (neutral-bullish, not overbought).
Price testing upper BB(20,2) at 23,750 – band expansion suggests volatility.
VWAP (Daily): 23,600 (swing support).
Swing Trade Setup:
Short near 23,750 (ABCD target) → Target 23,400. Stop-loss: 23,850.
Long near 23,400 (Bat + Gann 153² support) → Target 24,000. Stop-loss: 23,300.
3. Intraday Outlook (5M–4H)
Key Levels:
Resistance: 23,750 (Gann 1x1 angle), 23,800 (psychological).
Support: 23,650 (VWAP), 23,600 (Kijun Sen), 23,500 (200-EMA).
Indicators:
Ichimoku (1H):
Tenkan: 23,710, Kijun: 23,680 → Price straddling Kijun (neutral bias).
Cloud: Thin bullish cloud (23,650–23,670) – intraday support.
RSI + Bollinger Bands (1H):
RSI(14): 60 (neutral).
Price pinned to upper BB(20,2) – overextended above 23,730.
VWAP + MAs:
VWAP: 23,650 (intraday baseline).
EMA(20): 23,700 (dynamic resistance).
Candlestick Patterns:
4H Shooting Star at 23,780 (15th Aug) → Bearish reversal signal.
1H Bearish Engulfing below 23,720 – confirms short-term weakness.
Gann Intraday Squaring:
Time Cycles: 10:00–12:00 UTC+4 (geometric volatility window).
Price Harmony: Breakdown below 23,700 targets 23,650 → 23,600.
Intraday Trade Plan:
Sell below 23,700 → Target 23,650 (VWAP) → 23,600 (1H cloud).
Buy above 23,750 only if RSI <65 → Target 23,800.
Stop-Loss: 30–40 points risk.
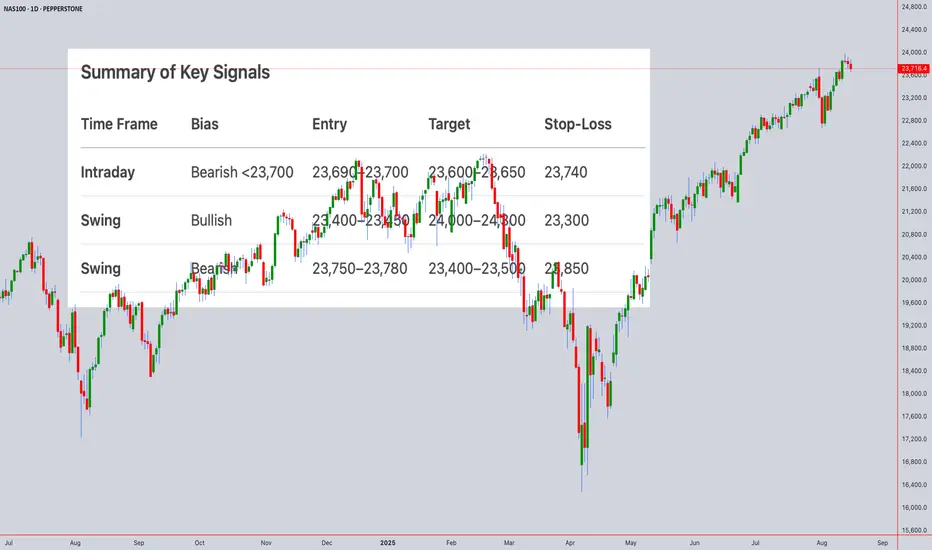
Summary of Key Signals
Time Frame Bias Entry Target Stop-Loss
Intraday Bearish <23,700 23,690–23,700 23,600–23,650 23,740
Swing Bullish 23,400–23,450 24,000–24,300 23,300
Swing Bearish 23,750–23,780 23,400–23,500 23,850
Critical Events Ahead:
Gann Reversal Window: Aug 19–21 (watch for tech earnings/Fed minutes).
Daily Close >23,800 invalidates bearish ABCD and targets 24,025.
Risk Note: NAS100 is sensitive to interest rate expectations. Tight stops advised in FOMC blackout period.
For those interested in further developing their trading skills based on these types of analyses, consider exploring the mentoring program offered by Shunya dot Trade . (world wide web shunya dot trade)
I welcome your feedback on this analysis, as it will inform and enhance my future work.
Regards,
Shunya.Trade
world wide web shunya dot trade
⚠️ Disclaimer: This post is educational content and does not constitute investment advice, financial advice, or trading recommendations. The views expressed here are based on technical analysis and are shared solely for informational purposes. The stock market is subject to risks, including capital loss, and readers should exercise due diligence before investing. We do not take responsibility for decisions made based on this content. Consult a certified financial advisor for personalized guidance.