Impulsive waveImpulsive first wave is forming .. This is just the beginning of strong bullish move .
Stock fundamental & financial analysis is very strong
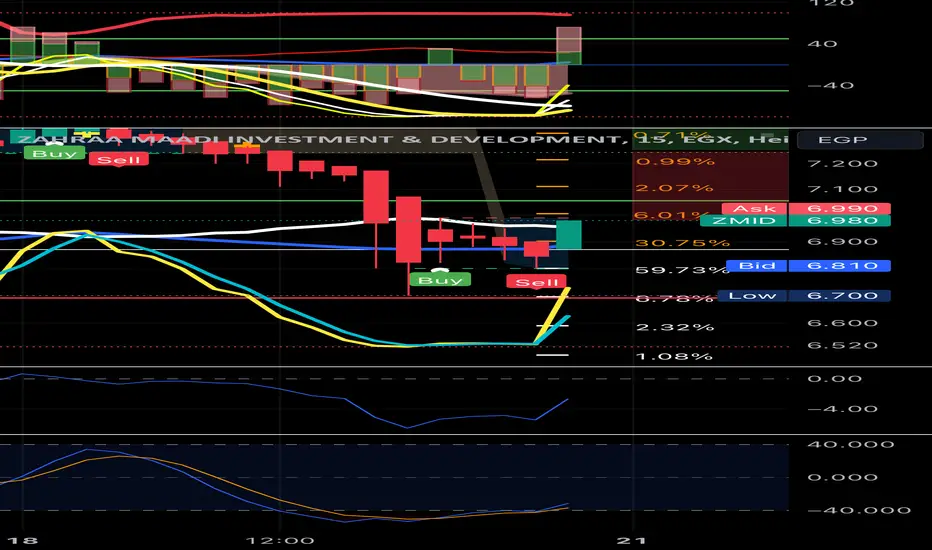
Zahraa Maadi Investment & Development
No trades
442.54 M EGP
734.83 M EGP
255.57 M
About Zahraa Maadi Investment & Development
Sector
Industry
CEO
Mohammed Ahmed Ibrahim Ghanim
Website
Headquarters
Cairo
Founded
1980
Identifiers
2
ISINEGS21171C011
Zahraa Maadi Investment & Development engages in the real estate sector. Its activities include real estate development, housing, and construction. The company also engages in tourism and investment projects. Zahraa Maadi Investment & Development was founded on June 2, 1980 and is headquartered in Cairo, Egypt.
Related stocks

Zmid Break-&-Go Continuation Plan.Entry Trigger
4.40 EGP+
Stop-Loss
4.18 EGP — beneath 9 EMA (daily) & last micro-base
Target 1
4.60 EGP
Target 2
4.80 EGP
Target 3
5.20 EGP — weekly supply April 2022
Wait for either the 4.40 breakout confirmation or an orderly pull-back to 4.05-4.10 (low prob for now). Anything in-between → ❌

With green engulfing candle i will buy Hello Traders,
as we all know this company did a lot of achievements in the last 2 years in the contracting and development projects with no noticeable price move,
i can see increasing in the volume and change in the way the price move which indicates some buying purchasing power at the back keeps h


Waleed zaki is a wolf Final target 4.4
Resistance 3.96
Tic tac
Short trade
Don't forget support and follow

Zahraa Maadi Egypt : A quick trade opportunity1-hour chart, the stock EGX:ZMID is preparing to rebound from the lower channel line R.
The target should be the upper line (around 7.6) passing through some resistance levels.
Technical indicator RSI is supporting this view.
Stop loss below 7.05 should be considered.

ZMID Zahraa Maadi Investment & DevelopmentThe stock has an imaginary support level at 5 Egyptian pounds and is currently trading in a resistance range between 6.30 and 6.5 Egyptian pounds, forming a flag pattern. If it breaks above the 6.70 Egyptian pound level during any weekly session, it could reach 7 Egyptian pounds, followed by 7.2 Egy

Positive outlookBuying signals on the 5 minutes chart; watch the performance on 5 minutes timeframe. Especially if volume continues .

ZMID wants to breakout !!?- probably still has a daily 5% ceiling.
- It may consolidate in the channel.
-Good entry is probably around 7.40-7.80
- Make your own decision, size accordingly and manage risk.

See all ideas
Summarizing what the indicators are suggesting.
Oscillators
Neutral
SellBuy
Strong sellStrong buy
Strong sellSellNeutralBuyStrong buy
Oscillators
Neutral
SellBuy
Strong sellStrong buy
Strong sellSellNeutralBuyStrong buy
Summary
Neutral
SellBuy
Strong sellStrong buy
Strong sellSellNeutralBuyStrong buy
Summary
Neutral
SellBuy
Strong sellStrong buy
Strong sellSellNeutralBuyStrong buy
Summary
Neutral
SellBuy
Strong sellStrong buy
Strong sellSellNeutralBuyStrong buy
Moving Averages
Neutral
SellBuy
Strong sellStrong buy
Strong sellSellNeutralBuyStrong buy
Moving Averages
Neutral
SellBuy
Strong sellStrong buy
Strong sellSellNeutralBuyStrong buy
Displays a symbol's price movements over previous years to identify recurring trends.
Frequently Asked Questions
The current price of ZMID is 5.780 EGP — it has increased by 1.04% in the past 24 hours. Watch Zahraa Maadi Investment & Development stock price performance more closely on the chart.
Depending on the exchange, the stock ticker may vary. For instance, on EGX exchange Zahraa Maadi Investment & Development stocks are traded under the ticker ZMID.
ZMID stock has fallen by −2.01% compared to the previous week, the month change is a −4.41% fall, over the last year Zahraa Maadi Investment & Development has showed a 69.50% increase.
ZMID reached its all-time high on Aug 25, 2021 with the price of 15.048 EGP, and its all-time low was 0.279 EGP and was reached on May 21, 2007. View more price dynamics on ZMID chart.
See other stocks reaching their highest and lowest prices.
See other stocks reaching their highest and lowest prices.
ZMID stock is 2.08% volatile and has beta coefficient of 1.16. Track Zahraa Maadi Investment & Development stock price on the chart and check out the list of the most volatile stocks — is Zahraa Maadi Investment & Development there?
Today Zahraa Maadi Investment & Development has the market capitalization of 5.79 B, it has decreased by −2.47% over the last week.
Yes, you can track Zahraa Maadi Investment & Development financials in yearly and quarterly reports right on TradingView.
ZMID net income for the last quarter is 186.36 M EGP, while the quarter before that showed 167.48 M EGP of net income which accounts for 11.27% change. Track more Zahraa Maadi Investment & Development financial stats to get the full picture.
Zahraa Maadi Investment & Development dividend yield was 6.23% in 2024, and payout ratio reached 45.20%. The year before the numbers were 1.71% and 34.14% correspondingly. See high-dividend stocks and find more opportunities for your portfolio.
Like other stocks, ZMID shares are traded on stock exchanges, e.g. Nasdaq, Nyse, Euronext, and the easiest way to buy them is through an online stock broker. To do this, you need to open an account and follow a broker's procedures, then start trading. You can trade Zahraa Maadi Investment & Development stock right from TradingView charts — choose your broker and connect to your account.
Investing in stocks requires a comprehensive research: you should carefully study all the available data, e.g. company's financials, related news, and its technical analysis. So Zahraa Maadi Investment & Development technincal analysis shows the neutral today, and its 1 week rating is buy. Since market conditions are prone to changes, it's worth looking a bit further into the future — according to the 1 month rating Zahraa Maadi Investment & Development stock shows the buy signal. See more of Zahraa Maadi Investment & Development technicals for a more comprehensive analysis.
If you're still not sure, try looking for inspiration in our curated watchlists.
If you're still not sure, try looking for inspiration in our curated watchlists.