EIGEN Analysis (8H)The price seems to be in the corrective wave B, likely in the final corrective sub-wave of the larger wave B. From the green zone | which is a flip zone overlapping with the trendline | we expect a rejection to the upside, initiating wave C.
We are looking for buying opportunities around the green
Related pairs

EigenLayer Daily view| DeFi’s Ethereum Restaking Power💀 Hey , how's it going ? Come over here — Satoshi got something for you !
⏰ We’re analyzing EIGEN on the 1-Day timeframe , this coin ranks 132 on CoinMarketCap. It’s a restaking project on the Ethereum network, highly valued and reputable in the DeFi space, and backed by well-known Ethereum develop
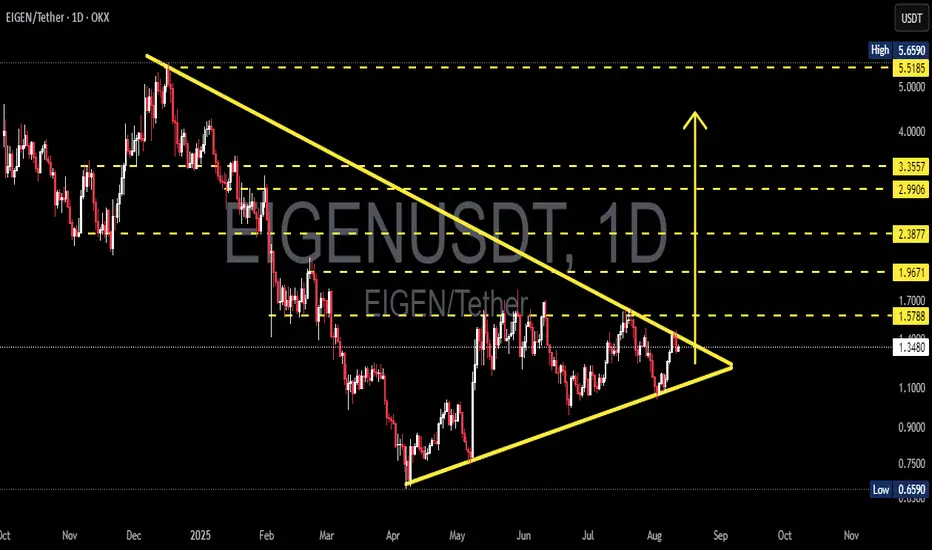
EIGEN/USDT — Symmetrical Triangle: Breakout Imminent?Summary
The daily chart shows a symmetrical triangle pattern (descending resistance from Dec–Aug and ascending support from April). Price is currently around 1.36 USDT, squeezing into the narrow apex zone — this suggests high volatility is likely once a breakout occurs. Statistically, this pattern
Is Eigen making us experience a scenario we've forgotten?Could Eigen be giving us a minor version of Ethereum's 2020 explosion?
The support that started the uptrend turns into resistance in the downtrend. (red line)
and a second strong support/resistance point (Blue line)
a long first cycle, a shorter second cycle, and a shorter final cycle
and the

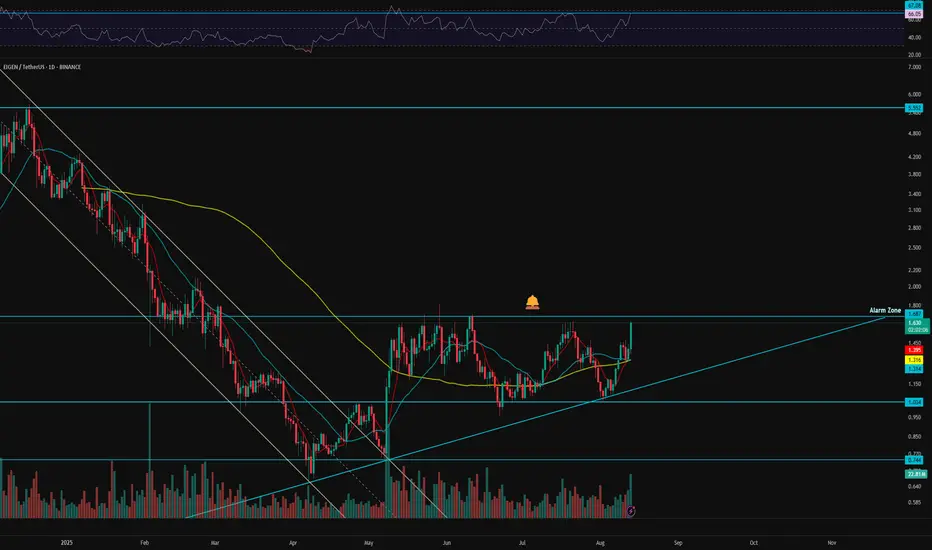
Eigen bullishBreakout the downtrend line, now you can watch the resistance if rejected no need to watch this setup.

EIGEN / USDT : Keep a close watch on retest processEIGEN/USDT – Bullish Breakout Potential
EIGEN has broken the descending resistance trendline, signaling a possible upward move. The current breakout shows strong bullish momentum with a target of around 0.830 USDT, offering a potential 52.73% gain. Keep an eye on this level for possible retest and

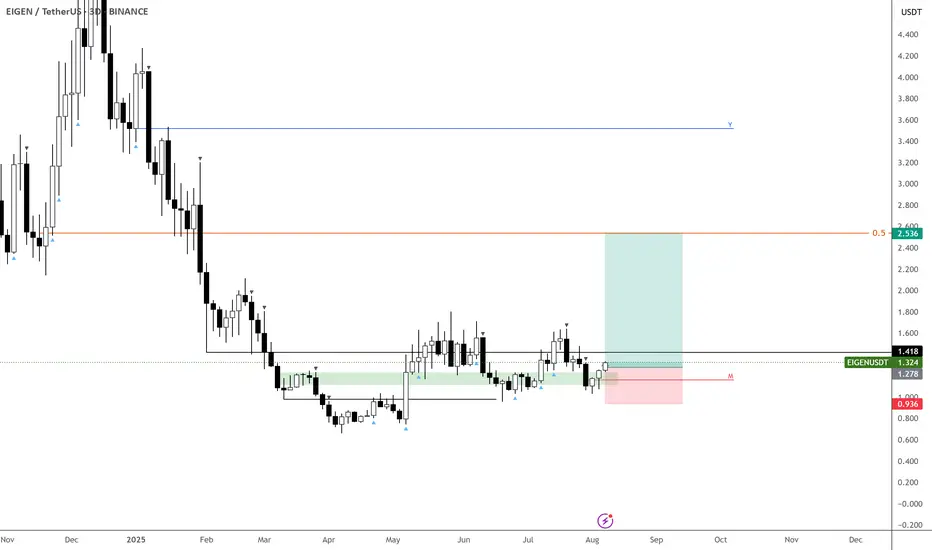
Back at $EIGEN - Ready for a Move!
Price has been basing nicely around $1, and it finally looks ready to make a move.
I’m leaning bullish here — this has the setup to start outperforming, with a clear path toward $2.50 if momentum kicks in.
BINANCE:EIGENUSDT
EIGEN/USDT TestingDemand Zone – Rebound or Breakdown Ahead?🧠 Technical Analysis:
🔸 Market Structure:
The price is currently sitting around 1.15 USDT, right above a key demand zone (highlighted in yellow) that has been tested multiple times since March 2025.
This area between 1.00 – 1.20 USDT acts as a major support zone.
🔸 Key Resistance Levels:
1.430

EIGENUSDT 1D#EIGEN is pulling back to retest both the broken descending trendline and the daily SMA50, which are converging with a key support zone. So far, this level is showing signs of strength.
📌 We're entering a position here, and will add more near the $1.096 support level if price dips further.
In case

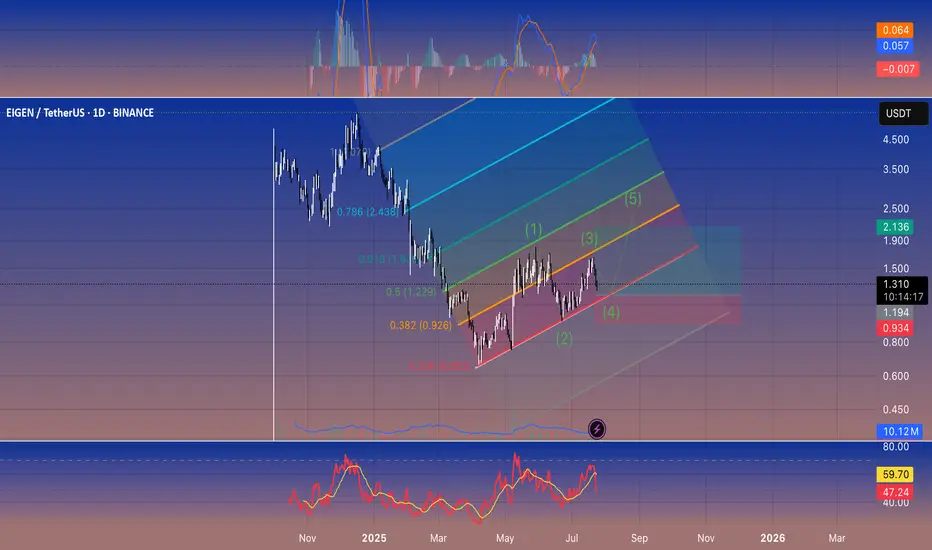
EIIGEN 1D – wave 4 dip loading zone (1.30 → 1.20) before a push idea TL;DR
• structure: HH/HL since June low (\~1.05). I’m labeling current move as wave (4) inside an ascending channel.
• plan: buy/scale in on the red box 1.30–1.20 (0.5–0.618 retrace of the June leg).
• targets: 1.62 / 1.97 / 2.13–2.43 (midline + 0.786 fib) for wave (5).
• invalidation: daily cl
See all ideas
Summarizing what the indicators are suggesting.
Oscillators
Neutral
SellBuy
Strong sellStrong buy
Strong sellSellNeutralBuyStrong buy
Oscillators
Neutral
SellBuy
Strong sellStrong buy
Strong sellSellNeutralBuyStrong buy
Summary
Neutral
SellBuy
Strong sellStrong buy
Strong sellSellNeutralBuyStrong buy
Summary
Neutral
SellBuy
Strong sellStrong buy
Strong sellSellNeutralBuyStrong buy
Summary
Neutral
SellBuy
Strong sellStrong buy
Strong sellSellNeutralBuyStrong buy
Moving Averages
Neutral
SellBuy
Strong sellStrong buy
Strong sellSellNeutralBuyStrong buy
Moving Averages
Neutral
SellBuy
Strong sellStrong buy
Strong sellSellNeutralBuyStrong buy
Displays a symbol's price movements over previous years to identify recurring trends.
Frequently Asked Questions
The current price of EIGEN / TetherUS (EIGEN) is 1.296 USDT — it has fallen −3.30% in the past 24 hours. Try placing this info into the context by checking out what coins are also gaining and losing at the moment and seeing EIGEN price chart.
EIGEN / TetherUS price has fallen by −2.96% over the last week, its month performance shows a −0.96% decrease, and as for the last year, EIGEN / TetherUS has increased by 332.00%. See more dynamics on EIGEN price chart.
Keep track of coins' changes with our Crypto Coins Heatmap.
Keep track of coins' changes with our Crypto Coins Heatmap.
EIGEN / TetherUS (EIGEN) reached its highest price on Dec 17, 2024 — it amounted to 5.659 USDT. Find more insights on the EIGEN price chart.
See the list of crypto gainers and choose what best fits your strategy.
See the list of crypto gainers and choose what best fits your strategy.
EIGEN / TetherUS (EIGEN) reached the lowest price of 0.300 USDT on Oct 1, 2024. View more EIGEN / TetherUS dynamics on the price chart.
See the list of crypto losers to find unexpected opportunities.
See the list of crypto losers to find unexpected opportunities.
The safest choice when buying EIGEN is to go to a well-known crypto exchange. Some of the popular names are Binance, Coinbase, Kraken. But you'll have to find a reliable broker and create an account first. You can trade EIGEN right from TradingView charts — just choose a broker and connect to your account.
Crypto markets are famous for their volatility, so one should study all the available stats before adding crypto assets to their portfolio. Very often it's technical analysis that comes in handy. We prepared technical ratings for EIGEN / TetherUS (EIGEN): today its technical analysis shows the strong sell signal, and according to the 1 week rating EIGEN shows the sell signal. And you'd better dig deeper and study 1 month rating too — it's sell. Find inspiration in EIGEN / TetherUS trading ideas and keep track of what's moving crypto markets with our crypto news feed.
EIGEN / TetherUS (EIGEN) is just as reliable as any other crypto asset — this corner of the world market is highly volatile. Today, for instance, EIGEN / TetherUS is estimated as 9.95% volatile. The only thing it means is that you must prepare and examine all available information before making a decision. And if you're not sure about EIGEN / TetherUS, you can find more inspiration in our curated watchlists.
You can discuss EIGEN / TetherUS (EIGEN) with other users in our public chats, Minds or in the comments to Ideas.