DOLLARThe US Dollar Index (DXY) Yearly Support and Potential Sell-Off to 96 Zone: Role of 10-Year Bond Yields and Interest Rates
1. Technical Outlook: DXY Support Breakdown and 96$ Target and Critical Support Levels.
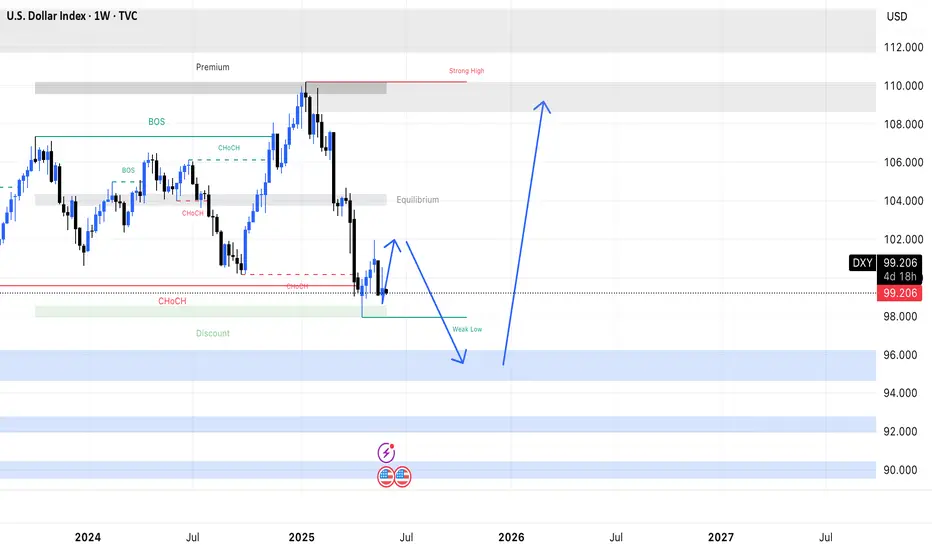
The DXY recently breached the 200-week moving average (200-WMA), a key multi-year support level, signaling a potential trend reversal .
A sustained break below 98.00 could trigger a steeper decline toward 96.00-95$ long-term uptrend ascending trendline acting as 6months support floor connecting 2008, 2011 and 2020, . However, analyst projections also highlight the 96–95 zone as a plausible target if Fed rate cuts and macroeconomic headwinds persist .
Current Context (May 2025):
The DXY is testing 98.4 on weekly charts, with bears eyeing lower supports amid weakening USD sentiment .
A drop to ascending trend line on 6months would align with forecasts tied to Fed policy shifts and global currency strength .
2. 10-Year Bond Yield and Interest Rate Dynamics
Direct Relationship with the Dollar:
The 10-year Treasury yield and USD share a strong correlation: higher yields attract foreign capital, boosting dollar demand, while lower yields weaken the currency .
As of May 2025, the 10-year yield hovers near 4.54%, down from peaks but still elevated compared to global peers .
Impact of Rate Cuts and Policy Divergence:
Fed Rate Expectations: Markets price in five Fed rate cuts by late 2025, which would reduce yield advantages and pressure the dollar .
Policy Divergence: The ECB and BoJ are expected to maintain or ease policies, while the Fed delays cuts, temporarily supporting USD. However, prolonged easing could reverse this advantage .
3. Key Drivers of Dollar Weakness Toward 96-95 ascending trendline
Bearish Factors:
Yield Decline: A drop in the 10-year yield (e.g., due to Fed cuts or recession fears) would erode USD appeal. For every 1% decline in yields, the DXY could fall 3–5% .
Risk Sentiment: A "soft landing" scenario or rally in risk assets (stocks, commodities) may reduce safe-haven USD demand .
Tariff and Geopolitical Risks: Escalating US-China/EU trade tensions could weaken the USD if global growth fears dominate .
Bullish Counterpoints:
Hawkish Fed Surprises: Strong US data (e.g., inflation, jobs) may delay rate cuts, keeping yields and the dollar elevated .
Safe-Haven Flows: Renewed geopolitical/market turmoil could revive USD demand despite lower yields .
4. Summary: Interplay Between Yields, Rates, and DXY
Factor Impact on DXY
10-Year Yield Rises Strengthens USD (investor inflows)
10-Year Yield Falls Weakens USD (capital outflows)
Fed Rate Cuts Pressures USD (narrows yield gap)
ECB/BoJ Easing Supports USD (policy divergence)
Path to 96: A combination of Fed rate cuts, declining 10-year yields, and stronger global currencies (EUR, JPY) could drive the DXY toward 96–95 .
Reversal Risks: Hawkish Fed pivots or safe-haven demand amid crises may stall the decline.
Conclusion
The DXY’s potential drop to the 96–95 zone hinges on sustained declines in the 10-year Treasury yield and Fed rate cuts, compounded by technical breakdowns. While policy divergence and safe-haven flows offer temporary USD support, broader macroeconomic shifts (e.g., tariff risks, global growth) could accelerate the sell-off. Traders should monitor yields, Fed rhetoric, and technical levels on demand floor and supply roof for confirmation of bearish or bullish momentum
USDX trade ideas


The tariff legal zig-zagWith different US courts firing "shots" at each other over the legality of tariffs, the market is taking a bit of a pause from accelerating further. Let's dig in!
DJ:DJI
TVC:SPX
TVC:NDQ
TVC:DXY
Let us know what you think in the comments below.
Thank you.
77.3% of retail investor accounts lose money when trading CFDs with this provider. You should consider whether you understand how CFDs work and whether you can afford to take the high risk of losing your money. Past performance is not necessarily indicative of future results. The value of investments may fall as well as rise and the investor may not get back the amount initially invested. This content is not intended for nor applicable to residents of the UK. Cryptocurrency CFDs and spread bets are restricted in the UK for all retail clients.


DXY | Harmonic Patterns | Technical Analysis. Recovery Underway?TVC:DXY
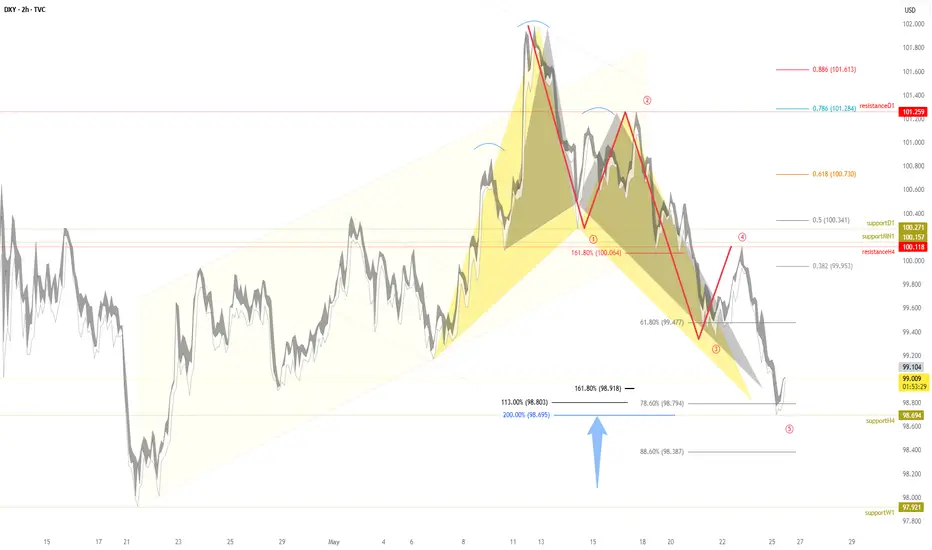
Over recent sessions, I’ve been highlighting a critical zone for the TVC:DXY between $98.70 and $98.80 , where several important technical patterns are forming that could signal the start of a rebound after the recent decline.
➡️ The dollar broke below the Head and Shoulders neckline at $100.27 , hitting the default target I projected at $98.69 , which corresponds to the 200% Fibonacci extension. This is a classic confirmation of the breakdown and subsequent drop.
➡️ However, since reaching this level, the TVC:DXY has begun to form strong bullish patterns:
Bullish Crab Pattern at the 161.8% Fibonacci extension, projected at $98.91
Bullish Alt-Bat Pattern at the 113% Fibonacci extension, at $98.80
These emerging bullish setups suggest a solid potential reversal, indicating that the TVC:DXY might be preparing to recover.
🎯 The default targets for these bullish patterns are around $99.95 , aligning with key resistance zones and Fibonacci confluence.
Summary: The TVC:DXY has completed the expected downward move from the Head and Shoulders pattern and is now showing clear technical signs of a possible reversal. The price action in the coming sessions will be critical to confirm whether the index can sustain this recovery toward higher levels.
Safe Traders,
André Cardoso
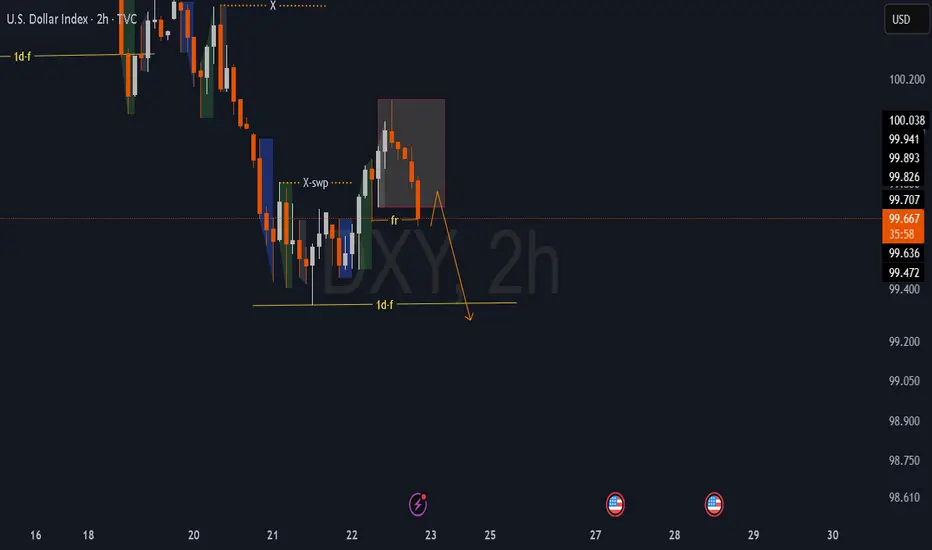
BULLISH REVERSALThe frame of a possible trade
On the Daily time frame, going back to what we can identify as the parent move
price gapped to the upside, filled with wicks and candles, price moves to the upside
leaving short-term lows(STL)
Price retraced and took liquidity at STL
On the Daily time frame, price expands violating a Daily Sell-side Imbalance Buy-side Inefficiency
05/29/25 Price gapped up, taking out liquidity at a STH
If this price action implies bullishness, then price will have to take/deliver some form of sellside
This is happening ahead of the Core PCE Price Index Data release on Friday 30/05/25


USDX-NEURAL SELL strategy 6 hourly chart GANNThe index is under pressure, and it has moved as expectation since I started my travels. However, am cautious selling right now, as there is some room to see minor recovery before lower. Also we are near a previous bottom.
Strategy SELL @ 99.00 - 99.25 and take profit near 96.50 for now.

DXY Short-Term Reversal Zone in SightUS Dollar Index (DXY) is approaching a strong support zone at 98.90–98.00, which has historically acted as a base for bullish reversals. The price is now testing the lower bound of this zone after a steady downtrend from the 101.94 high.
Key Technical Structure:
Support Zone: 98.90–98.00 (tested 3+ times)
Double Bottom Potential forming if bulls hold the zone
Upside Targets:
101.94: Key horizontal resistance
103.50: Swing high from early April
Scenarios to Watch:
🔹 Bullish Rebound:
Price bounces off 98.90–98.00 support
Confirmation: Break and close above 100.50 near-term resistance
Could fuel move back to 101.94, possibly 103.50
🔹 Bearish Breakdown:
Daily close below 98.00 would invalidate bullish setup
Opens downside to 97.00 and even 95.50
Macro Drivers to Watch:
FOMC speakers and interest rate guidance
US jobless claims or inflation surprise
Risk-off sentiment (benefits USD) vs. continued global risk appetite
Conclusion:
DXY is trading at a make-or-break support zone. Watch for clear bullish reaction or bearish breakdown before committing. The setup favors a bounce unless 98.00 fails.

DXY Aiming for Lower LowsHi,
DXY is bearish on the 1-hour chart, headed toward the 98.901 area, potentially aiming for 97.912 with an extended drop to 96.114.
Price volatility is moving in line with price momentum across both lower and higher timeframes, suggesting strong bearish sentiment at this time.
If the price reverses and breaks above 101.000, the setup will be invalidated.
Happy trading,
K.
Not trading advice

DXY Bearish Setup: Sell from Supply Zone to 99.100 TargetTrend: 📉 Bearish Bias
Key Zones & Strategy:
🔶 Supply Zone (Sell Area)
📍 100.584 – 100.906
⚠️ Price may face selling pressure here
🔵 Entry Point:
🎯 100.584 (bottom of supply zone)
🔴 Stop Loss:
❌ 100.906 (just above resistance)
🟢 Target Point:
✅ 99.100
📉 Aligned with lower support line
Technical Indicators:
📏 Descending Channel
🔽 Price moving within parallel downward trend lines
📊 EMA (70) – Orange Line
🔁 Acting as dynamic resistance
Trade Setup Summary:
📌 Sell in the Supply Zone
🛑 Stop Loss: 100.906
🎯 Target: 99.100
⚖️ Good Risk-Reward Ratio
Warnings & Tips:
⚡ Watch for Breakouts:
If price breaks above 100.906 ➡️ 📈 Bearish idea invalid
📰 Check News Events:
FOMC, CPI, or other USD events may cause volatility


Dollar Poised for Further Losses as Confidence Erodes – Key LeveThe U.S. dollar is under mounting pressure, with a combination of fundamental and technical factors pointing toward deeper weakness. Investor trust in the U.S. economy is waning, evidenced by a wave of insider selling from top U.S. CEOs. Their net reduction in equity holdings signals caution at the highest levels.
The U.S. bond market is also flashing warning signs. Rising debt issuance, high interest costs, and concerns over long-term fiscal discipline are pushing risk premiums higher—not as a vote of confidence, but as a red flag. These pressures reduce the dollar’s attractiveness, especially with global alternatives gaining traction.
Geopolitically, renewed tariff discussions—particularly against China—raise concerns over trade frictions and global growth, adding to bearish sentiment.
On the technical side, the break below the 100.50 level on the dollar index (DXY) has confirmed downside momentum. The monthly chart signals a bearish structure, with lower highs and lower lows forming. If selling continues, the next major target lies near the 90.00 zone—a level last seen in early 2021.
