ENA short to $0.4910Just now opened a short on ENA. Aiming for $0.4910
Seems likely to dump further based on DTT analysis- Learn more on X.
Sl: $0.5435
Roughly 2 RR from my entry
ENAUSDT trade ideas

ETHENA Potential Double Bottom Setup UnfoldingEthena (ENAUSDT) is currently developing a possible double bottom reversal structure, with price rebounding firmly from the lower boundary zone. This key support has now produced a bullish reaction, guiding price action toward the upper neckline resistance of the pattern.
A successful breakout above the neckline will confirm the double bottom formation and validate the bullish reversal scenario. This setup aligns with classic accumulation behavior often seen at market bottoms. If confirmed, the projected targets have been clearly mapped on the chart for your strategic positioning and risk management.
Watch the neckline zone closely it holds the key to short-term trend reversal or continued range behavior.
Share your thoughts in the comments.

ENAUSDT tradeWe can see how a bullish flag is formed on ENAUSDT. I opened a position close to upper line expecting to see a pump since BTC.D started forming downtrend and bounced from a strong resistance 62% level and EMA-200 on 1-D chart
Ethena (ENA) Bullish Structure Intact as EMA Confirms UptrendBINANCE:ENAUSDT continues to flash bullish technicals. A 50-day/100-day EMA crossover just confirmed, while the 100-day is nearing the 200-day; a setup that previously led to sustained rallies. ENA also trades inside a well-formed ascending channel, currently challenging resistance at $0.65. A clean breakout could push the price toward $0.70, with the full channel breakout target set near $1.13 (1.618 Fib extension).
Backing the structure is a bullish OBV divergence: while BINANCE:ENAUSDT price made a lower high, volume momentum made a higher high, indicating hidden accumulation. Meanwhile, whale wallets increased holdings by over 30% in 7 days, showing institutional support. Support holds near $0.60, and a break below would invalidate the bullish thesis.

ENA / USDT#ENA / USDT
Iam expecting big returns from ETH and its related coins in this season
This chart is also looking good
Another Potential round bottom pattern under formation
Keep an eye

Ethena Poised for 29% Rally Toward Crucial 0.75 Target Hello✌️
Let’s analyze Ethena’s price action both technically and fundamentally 📈.
🔍Fundamental analysis:
Every $1B rise in USDe means more demand for ENA tokens as collateral. With $290M revenue, ENA shows strong, steady growth potential 🚀.
📊Technical analysis:
BINANCE:ENAUSDT is approaching a critical daily support zone that also coincides with a key level on the daily chart 📉. If this support holds firm, we could see a strong 29% rally toward the 0.75 target 🎯. This setup offers a clear risk-reward for traders watching closely.
✨We put love into every post!
Your support inspires us 💛 Drop a comment we’d love to hear from you! Thanks, Mad Whale

Ena short to $0.5180Just now opened up a short position on ENA. Ena seems like a pair that wants to pump but at the moment I just think its relatively too high and likely will dump down further before correction.
Based on my DTT analysis- Direction, Target and timing it'll probably dump back to $0.5180
That's the direction and target and in terms of timing it'll probably start to do so anytime now given my analysis is correct.
Sl: 0.6127
Tps on chart
Time sensitive

Ethena Bullish Momentum Builds, Eyes 30% Rally to $0.85Hello✌
Let’s analyze Ethena’s upcoming price potential 📈.
BINANCE:ENAUSDT has demonstrated strong bullish momentum recently, supported by positive fundamental developments 📈. The price is currently near key daily and Fibonacci support levels. If these hold, a potential 30% upside targeting $0.85 looks likely 🚀.
✨We put love into every post!
Your support inspires us 💛 Drop a comment we’d love to hear from you! Thanks , Mad Whale

#ENAUSDT In a simple weekly view,
it is quite clear that a break of the red arrow resistance line will pave the way for a touch of the ceiling,
so watch and wait.

Ena short back to 0.51 this week0.6060 stoploss
Market likely to start falling soon based on my DTT analysis. Structurally price is high overall , started to break back below 4hr support levels, downtrend on 1hr tf and high on daily tf

ENA/USD: BBTrend Suggests Latent Bullish Momentum UnfoldingSince June 29, the BBTrend (Bollinger Band Trend) indicator on ENA’s daily chart has shown a steady series of growing green bars. This expansion signals increasing underlying bullish momentum, even as the token’s price trended mostly downward over the past week.
However, today’s 10% rally marks the strongest upside move in that entire period—potentially signaling the start of a reversal. In technical terms, when BBTrend bars expand during price consolidation, it often precedes a breakout. That appears to be playing out now. If this renewed momentum sustains, ENA could be setting up for further upside in the sessions ahead.

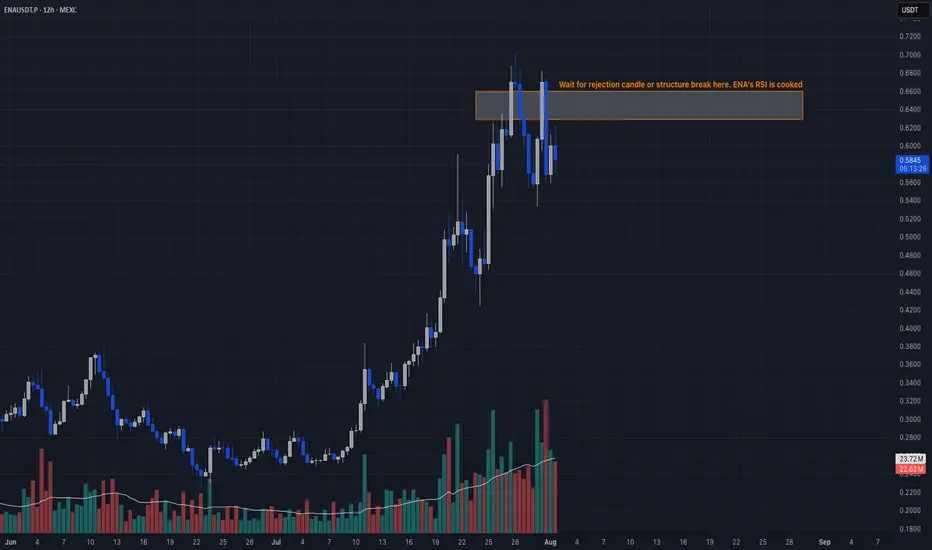
Overbought + Reversal Signal📣 Yo legends!
ENA got jacked on steroids lately, exploding in TVL and open interest like it’s headed to $10. But RSI at 82? Declining OI? That’s not strength, that’s a leverage hangover waiting to happen. Time to fade the party. 🥴
🔥 TRADE SETUP
Bias: Short
Strategy: Overbought + Reversal Signal
Entry: $0.63 – $0.66
SL: $0.71
TPs: $0.5446, $0.50, $0.42
Why?
– RSI 82 on daily = overheated
– Open interest dropping fast after topping $1.35B
– Funding collapsing → longs unwinding
– HTF sweep + LTF CHoCH confirmed.
Candle Craft | Signal. Structure. Execution.
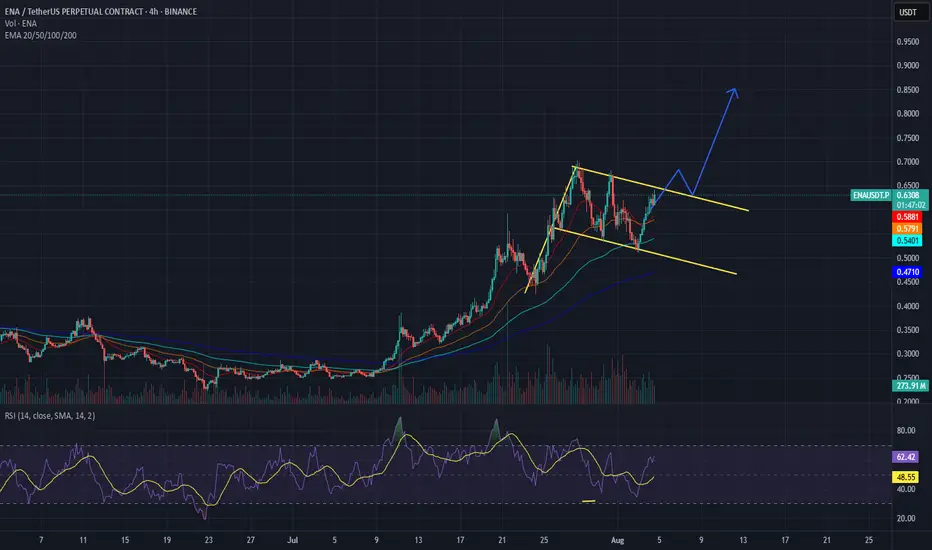
ENAUSDT 4H Chart Analysis | Bullish Breakout Setup in FocusENAUSDT 4H Chart Analysis | Bullish Breakout Setup in Focus
🔍 Let’s dive into the ENAUSDT perpetual contract and analyze the recent price action, spotlighting key technical signals and a potential breakout scenario.
⏳ 4-Hour Overview
The 4-hour chart shows ENAUSDT consolidating above a critical ascending trendline, with price action tightening into a symmetrical triangle formation. Multiple attempts to break down have resulted in a fake breakout, as indicated by low volume during the breakdown — a classic sign of seller exhaustion.
🔺 Bullish Breakout Setup:
On the upside, a confirmed breakout above the $0.6800 resistance could pave the way for a bullish continuation towards the $0.8000 target zone. The structure suggests increasing buying pressure as long as price holds above the trendline and key support ($0.6050).
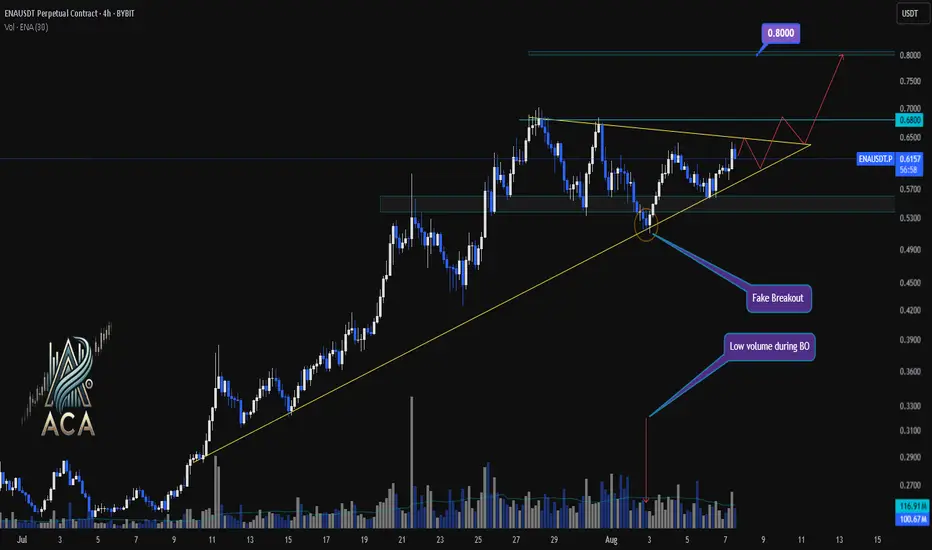
📊 Key Highlights:
- Price retested the ascending trendline; buyers defended it aggressively.
- A fake breakout with low volume suggests trap for bears and quick recovery by bulls.
- The next major resistance comes at $0.6800, with a projected target at $0.8000 upon breakout.
- Short-term support sits at $0.6050. Price action above this level remains constructive.
🚨 Conclusion:
Watch for a decisive move beyond triangle resistance. A high-volume breakout above $0.6800 could trigger a sharp move toward $0.8000. Bulls are building momentum — keep an eye on volume to confirm breakout strength.
Long ENAbuy at monthly open range 0.3-0.4 btw
RSI sLH
Strong fundamental coin
wait and accumulate
last Chance buy now Lock in DYOR

ENA Faces Strong Selling Pressure, Bulls Struggle to Hold GroundENA/USD shows a bearish shift in market sentiment on the daily chart. The Balance of Power (BoP) indicator has turned negative, currently at -0.35, suggesting that sellers are firmly in control and outweighing buying interest.
The BoP reflects the strength between buyers and sellers, indicating who holds the upper hand over a given period. A negative reading signals that selling pressure is driving prices lower, with sellers overpowering any bullish attempts to push the market upward.


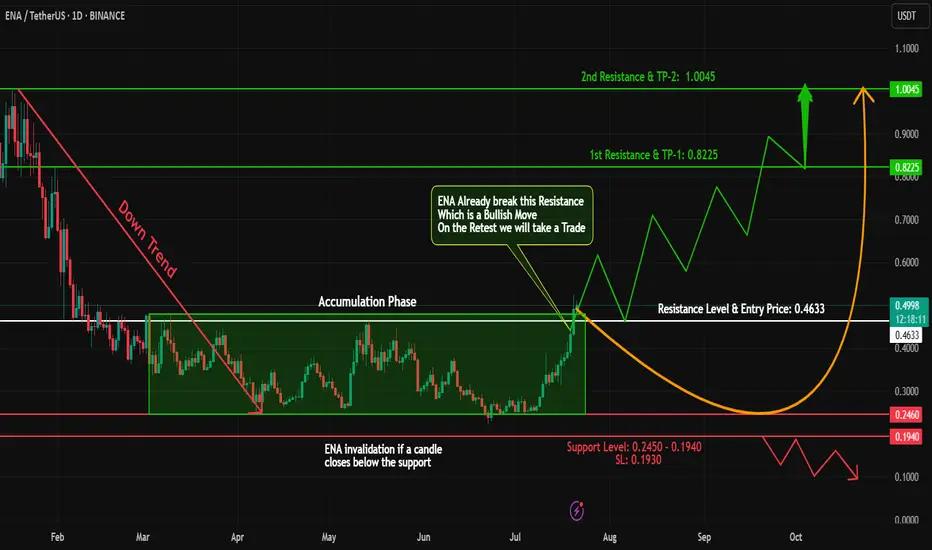
ENA Breakout Alert – Bullish Opportunity Ahead!#ENA has shown a classic accumulation + breakout structure!
🔹 Phase 1: Downtrend – From 1.00 to 0.25, #ENA went through a steep correction.
🔹 Phase 2: Accumulation – Price consolidated for a while, forming a strong base.
🔹 Phase 3: Breakout – #ENA has now closed a daily candle above the accumulation zone – a strong bullish signal!
📊 Trade Plan:
✅ Long Entry: At CMP or on a retest of the breakout zone
🎯 Targets: 0.80 - 1
🛡️ Stop Loss: Just below the accumulation zone
⚠️ Risk Management is key – stay smart and disciplined!
💬 What’s your take on #ENA’s next move? Share your thoughts below!
🧠 Follow for more breakout setups, trend analysis & educational content.
#ENA #CryptoBreakout #Accumulation #Altcoins #TradingView #CryptoAnalysis #TechnicalAnalysis #TrendReversal
ENA 8H +164% From Trend Entry, But Can Support Hold?The MACD Liquidity Tracker Strategy caught a clean +164.38% move on ENA after price reclaimed both the 60 and 220 EMAs with MACD momentum flipping bullish.
The entry came just as consolidation ended and trend expansion began — no early exits, no chop. Price is now testing the 60 EMA again, which has acted as dynamic support throughout the run.
If bulls defend this zone, continuation remains on the table. But if it cracks, a deeper pullback could be in play.
📊 Strategy Settings:
MACD: 25 / 60 / 220
EMA Filter: 60 & 220
Mode: Normal
Timeframe: 8H
Educational analysis. Let’s see how this plays out.

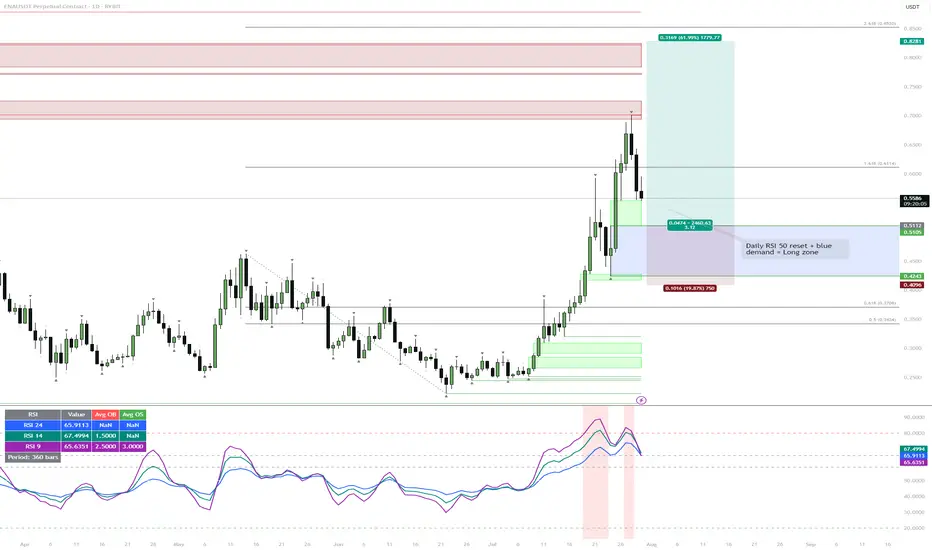
ENA | Waiting for the Daily RSI 50 ResetWatching for price to drop into the blue demand zone while the daily RSI resets to the 50 level. If both conditions align, that's the next high-probability long setup.
Reasoning:
Strong rally has left RSI elevated, so a cool-down is likely.
The blue zone lines up with the prior breakout and consolidation, so it's a logical area for buyers to step in.
A confluence of demand and neutral RSI usually provides the best R:R for trend continuation.
#ENA worth keeping an eye worth to keep an eye here on ENA, currently at weekly/monthly resistance zone, if breaks further then different story However if we do get that retrace will be worth to trade for good R:r setups

ENA is the cleanest chart I've ever seenThis is the first token among all my reviews that is in harmony with all indicators of purchases, liquidity, and everything else. But first things first:
➡️ First, purchase volumes are in harmony with the price. As the price rises, so do purchase volumes, signaling growing interest in the token.
➡️ Second, the Money Flow indicator also shows harmony with the price, signaling inflows of new liquidity into ENA. This indicates a growing number of traders and holders.
➡️ However, the price of ENA, as a less liquid token, has been growing rapidly and strongly recently. During its growth, it formed two gaps at the levels of $0.564 - $0.480 and partially closed at $0.461 - $0.400. As we know, in 99% of cases, gaps close sooner or later.
➡️ But just look at this support level starting at $0.494. There is a whole queue lined up to buy the token at the slightest correction. So there is certainly no need to worry about buybacks during the correction.
📌 Conclusion:
I will definitely be taking a position in ENA. But first, I will wait for the gap to close, because the price has probably not yet reached its peak and will be even higher in the coming months. But it is too risky to buy at the local peak.
As soon as the price closes the first GAP and reaches support at $0.484, it will become extremely attractive to buy, and it will potentially form a higher low there if it maintains its bullish momentum.
🔥 Subscribe to see more trading ideas for the hottest tokens on the market!

Ena short to $0.5962Just opened a short on Ena. Aiming for $0.5962
Sl: $0.6405
Should be able to get at least 2RR still.
Time sensitive

ENAthe daily closed inside THE CLS RANGE
This means that the price will likely revert, into the OB as shown in the chart (which is my entry)
Im confident in targeting the full range as the liquidity is stored there + ENA tapped the daily OB today which is generally bullish.
And
As we all know, market chases liquidity.
Goodluck
