swap zoneAfter the recent break out the resistance zone and a small correction, we will see the continuation of the trend.(RBR)
Market insights

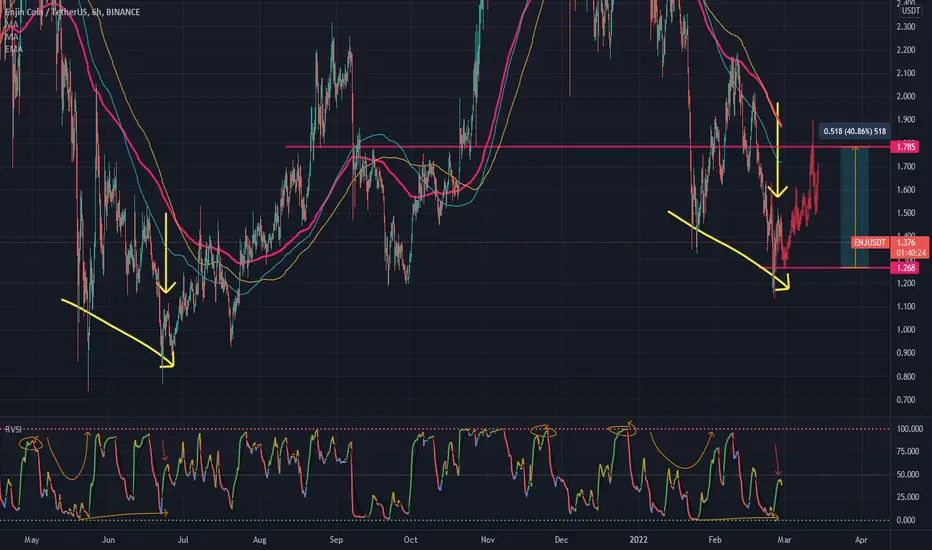
Enjin - Bullish signals on the DAYchartHi all,
Now that BTC has slowly made some moves in the direction of higher prices we see some altcoins to move further up as well. Enjin has been in an downtrend for a while a pretty good bounce up to $2.18 a few weeks ago after which it dropped back to as low as $1.30 ranges which also works as a very strong support (see the green bar over the width of the chart)
Now, the reason I am bullish on Enjing is because the chart is clearly showing some bullish signals:
1) The price on the DAILY timeframe has formed a falling wedge, which is bullish
2) The RSI has showed bullish divergence (price goes down, RSI moves up)
3) The MACD lines showed a bullish cross on the D chart as well.
We already see Enjin pushing out some green candles with the 50D MA coming up (red line) which it will face around $1.60. As soon as it passes that resistance I believe prices can be seen in the $2 range again. I will certaintly keep an eye on how the chart continues the develop.
#notfinancialadvice

Still in the correction wave, around 1.0On daily chart
Enjin Coin BINANCE:ENJUSDT is in the correction wave ABC.
Wave A might be at 1.0 within the fourth wave has been progressing which has target in range 1.7 - 1.9
After that, the fifth wave will be end wave A
Wait and see
My ideas helpful, plz hit a button like to support me. Thanks!

Falling Wedge on ENJIf we are able to break the falling wedge, we could see a big break out here. Keep in mind. Key Demand Level is highlighted here.

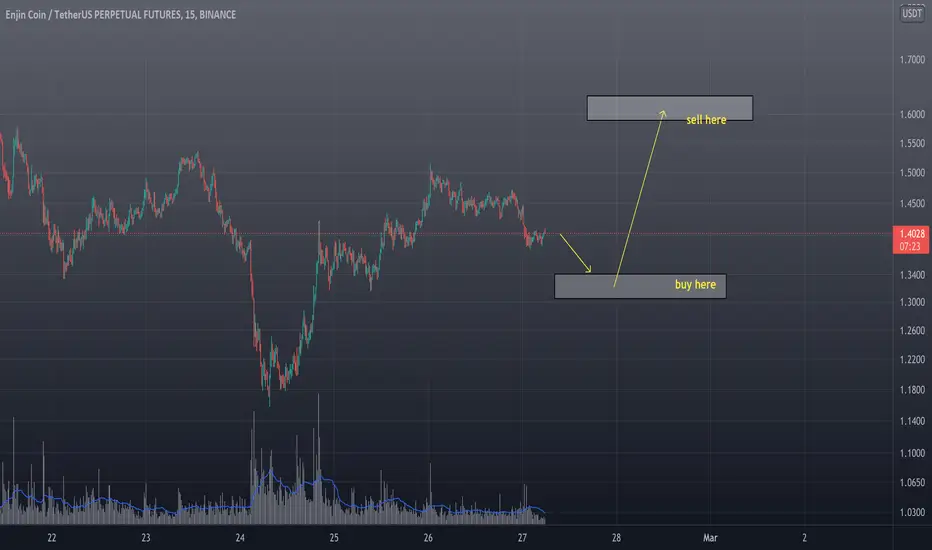
ENJ 15M LONG (Metaverse)ENJ analysis If this scenario works out, you can purchase ENJ around the 1.3145 - 1.2963 range because BTC is now sideways.
You can set your stop loss at $1.28.
Leverage is advised. 10-20 If you're making a profit, always use SL+.
This is simply our take on ENJ.
#ALWASYDYOR
#DYOR
#FUTURE

ENJ scalp tradeRange scalp trade with very little risk given the state of the move before;< Expecting a pullback

ENJ ; simple bottoming fractalENJ ; simple bottoming fractal
last enj idea was sound asf. hit that 200ema and rejected right back down. (linked)
the btc fractal im looking at is showing a double bot, or even a slightly lower low, and usually ENJ dumps HARD so that SHOULD mean a lower lower on ENJ too..
lets see how she plays out!
Very good supportAfter the recent fall of the market, the price of thin currency also decreased, but it has been supported in a good area. I think the two drawn areas will be taken back soon.


#ENJUSDT 4H Chart
Price is still moving in a downtrend after getting rejected from the 4h supply and it is currently bouncing from the 2h demand zone. MACD is still showing bearish momentum, RSI is sold and EMAs are not clear. Price needs to break above $1.47 to consider longing otherwise we would expect price at the 1h demand zone at $1.27.

SELL ENJENJ looks at breaking the m15 channel, where we target our short entry at 1.50 with X10 leverage.
Short-term trade with tight SL at 1.54
Three levels of TP, where we close partially our position
TP1: 1.47
TP2: 1,438
TP3: 1.401

The #ENJ is close to static resistance.The #ENJ is close to static resistance.
#ENJ Needs a bit of correction.
Ichimoku and 100EMA resistance is strong.
Needs to break the downtrend line.
See price $ 2 coming soon.

Easy just Follow i drawing be wise and be careful
buy in the area
and sell in the exactly same area a drawing

ENJ/USDTHi,,
Rest with a triple wave after a full ascending motion (microwaves specified).
Currently, with the divergence that you see with the yellow arrow on the chart and indicators, we have an upward movement that is forming a microwave 4 of a C wave.
We have to wait and see if the price chooses route 1 or route 2 ......
However, since there is a general downward trend, it is not recommended to enter into a trade against the trend.
tell me your ideas.....
Please tell me your ideas...

ENJ/USDT 2 HOUR ANALYSIS Welcome to this quick Update, everyone.
If you are reading my updates for the first time do follow me to get more complex charts in a very simplified way.
I also post altcoin setups on Spot, Margin, and Futures .
I have tried my best to bring the best possible outcome in this chart.
ENJ/USDT is making this bullish expanding Triangle pattern.
Entry: $1.43- $ 1.45
Targets- $1.5170 - $1.58- $1.625 - $1.69 - $1.7360
LEVERAGE-5X - 10X
Stop Loss: $1.39
What's your thought on this?
Do hit the like button if you like this update and share your views in the comment section.
Thank you
#PEACE

#ENJ is #PULLBACK to #bearish #trendline
ENJ/USDT is GET the good setup for SHORT POSITION by PULL BACK to bearish trend line in 15M Time F
You Can get This Position With 6X LEV
GOOD LUCK & Don't Forget to set the SL & TP

ENJ/USDT 1HOUR UPDATE BY CRYPTOSANDERSWelcome to this quick ENJ/USDT analysis.
I have tried my best to bring the best possible outcome to this chart.
Hello Everyone
ENJ/USDT is making this bullish expanding Triangle pattern. and retest the green zone
Entry: $1.42- $ 1.44
Targets- $1.5170 - $1.58- $1.625 - $1.69 - $1.7360
Stop Loss: $1.35
with leverage:- 5x to 10x
Remember:-This is not a piece of financial advice. All investment made by me is under my own risk and I am held responsible for my own profit and losses. So, do your own research before investing in this trade.
Happy trading.
Sorry for my English it is not my native language.
Do hit the like button if you like it and share your charts in the comments section.
Thank you...

ENJIN 300%+ LONGEnjin looking great here, as we can see the divergence printed and in previous examples we have a move. We also have a fibb in play as per the image, for more finer details see my YT channel.
Previous entry was here:

ENJUSDT is testing the Daily SupportThe price is creating a descending channel on the daily timeframe and had a breakout from the dynamic support and bear flag.
Now the price is testing important daily support on 1.4$
How to approach?
We are monitoring the price, we expect a bounce around 1.6$. If the price got liquidity and the market is going to lose the current support and flip it in new resistance, we can apply our rules to open a new short position
–––––
Follow the Shrimp 🦐
Keep in mind.
🟣 Purple structure -> Monthly structure.
🔴 Red structure -> Weekly structure.
🔵 Blue structure -> Daily structure.
🟡 Yellow structure -> 4h structure.

Remember. patience!No emotions, patience and self-confidence. Doesn't go as planned, no problem, on to the next one (:


ENJUSDTGeneral Guide:
1.) Anything above price is a resistance, anything below is support.
2.) Proceed with caution when taking a trade based off of this chart.
3.) Make a copy of it to watch it in real-time. Click the share button, then "Make it Mine"
4.) It is very risky to set limit orders, I advise you to set alarms and when it hits, check how it reacts.
5.) Watch the BTC pair closely as price will generally follow that pair.
6.) Definition of Terms:
Bearish/Bullish Order Block (OB) - Price rejects or bounces respectively.
(Monthly/Weekly/Daily) Liquidity - Where retail stop loss orders are.
pm/pw/pd/pr - Previous Month/Week/Daily/Range
VAH/VAL/POC - Value Area High/Low and Point of Control (70% of traded volume in a range)
OTE - Optimal Trade Entry
Rectangles - Liquidity Pools
Diagonals - Probably a Fib Resistance Fan, Pitchfork or Pitch fan
nPOC - Naked Point of Control
Eq - Price Equilibrium
Single Prints - Liquidity Voids
