EPIC : Risky signal...Hello friends🙌
🔊Due to the good price growth, we have found important support points for you.
Now, due to the price correction, we have found buy points for you and you can buy with risk and capital management and move with it until the goals we have set for you.
🔥Follow us for more signals🔥
*Trade safely with us*
EPICUSDT trade ideas

EPIC/USDT 1H Setup – Bearish Flag Breakdown Incoming? We’re currently observing EPIC/USDT on the 1-hour chart, and the price action is following a classic bearish structure.
🔹 The trend remains strongly bearish overall.
🔹 The market is currently in a retracement phase, forming a new Lower High (LH).
🔹 A clear bearish flag pattern has formed, typically signaling continuation to the downside.
🔹 Once price breaks the Lower Low (LL) support, we expect bearish momentum to resume.
📌 Trade Setup Breakdown:
Pair: EPIC/USDT
Timeframe: 1H
Trend: Bearish
Divergence: None
Pattern: Bearish Flag
Bias: Bearish
Strategy: Sell Stop at LL Breakout
🔻 Entry Price (EP): 1.662
🔴 Stop Loss (SL): 1.938
🟢 Take Profit (TP1): 1.386
⚖️ Risk:Reward Ratio: 1:1
💼 Why This Setup Works:
✅ Clear bearish flag within a downtrend
✅ Retracement forming Lower Highs — classic continuation structure
✅ Breakout of LL confirms bearish momentum
✅ Clean risk-to-reward structure with tight SL and precise TP
💬 What’s your take on EPIC/USDT?
Do you see the same continuation forming? Share your thoughts below 👇
🔔 Don’t forget to follow me for more clean, high-probability trade setups, patterns, and price action plays. Let’s trade smart together! 💹
#EPICUSDT #CryptoTrading #BearishFlag #PriceActionSetup #CryptoAnalysis #1HChart #TrendContinuation #TechnicalSetup #TradeSmart #CryptoSignals #BearishStructure #SellSetup #RiskReward #TradingStrategy #ChartPatterns #BreakoutTrade #CryptoBearish #TradingViewIdeas #CryptoTraders #TradeWhatYouSee #SmartEntry #SwingTradeCrypto #CryptoCommunity #AltcoinAnalysis

Epic Chain to $19.00Epic Chain rallied two weeks ago, surpassing all resistances. We may see sideways movement and another pump to the previous high of $19.00

EPICUSDT.P LONGThe price broke down the symmetrical triangle but we will not plan for short as we are already long biased so we will only look a good place to buy. Until the price retest the triangle bottom with a bearish candle and strong volume.
Why I planned this trade? As we all know we are already in a kind of bull run and this is most probably a fakeout and i think price will bounce back from our entry point.
Lets wait and watch only trade when see any bullish candle and bullish momentum at our entry level.
Follow me and support me please.

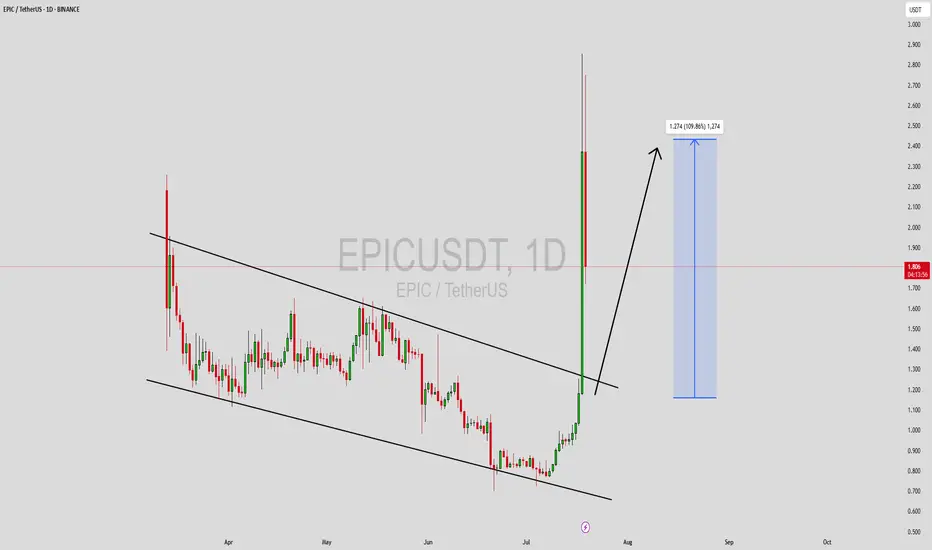
EPICUSDT Forming Falling WedgeEPICUSDT is carving out a textbook falling wedge pattern, a highly reliable bullish reversal setup that often signals a sharp breakout once selling pressure subsides. As price action contracts within converging trendlines, it reflects diminishing bearish momentum and growing interest from buyers. With volume remaining healthy throughout this phase, the conditions are aligning for a breakout that could lead to an impressive 80% to 90%+ gain.
This pattern gains credibility from its formation at the lower end of a broader downtrend, suggesting that early accumulation may already be underway. Traders familiar with wedge breakouts will note that confirmation from a strong bullish candle breaking above the upper trendline would be a powerful entry signal. If followed by continued volume engagement, this move could gain rapid traction.
Investor sentiment toward this project is also strengthening, adding a layer of narrative support to the technical setup. Rising engagement from both retail and larger market participants points toward renewed confidence in the project’s fundamentals. A successful breakout could therefore become a magnet for additional inflows, potentially amplifying the upside move.
For breakout-focused traders and technical enthusiasts, EPICUSDT presents a compelling risk-reward opportunity. Watch closely for a confirmed breakout above the wedge boundary—if it materializes, it may mark the beginning of a significant mid-term rally.
✅ Show your support by hitting the like button and
✅ Leaving a comment below! (What is You opinion about this Coin)
Your feedback and engagement keep me inspired to share more insightful market analysis with you!
EPIC Battles Key Trendline After Dual Structure Shift⏱️ On the 2H chart, CSE:EPIC recently broke out of a descending channel ✅—a bullish signal in the short term.
However, momentum stalled right at the lower boundary of a larger symmetrical triangle ❌, where price is now facing rejection.
This zone is pivotal — reclaiming the triangle could spark another leg up, while continued rejection might drag price lower once again.
👀 A tight setup with conflicting signals — watching this one closely.
Will the bulls regain control or does downside pressure take over?
Not financial advice. BINANCE:EPICUSDT

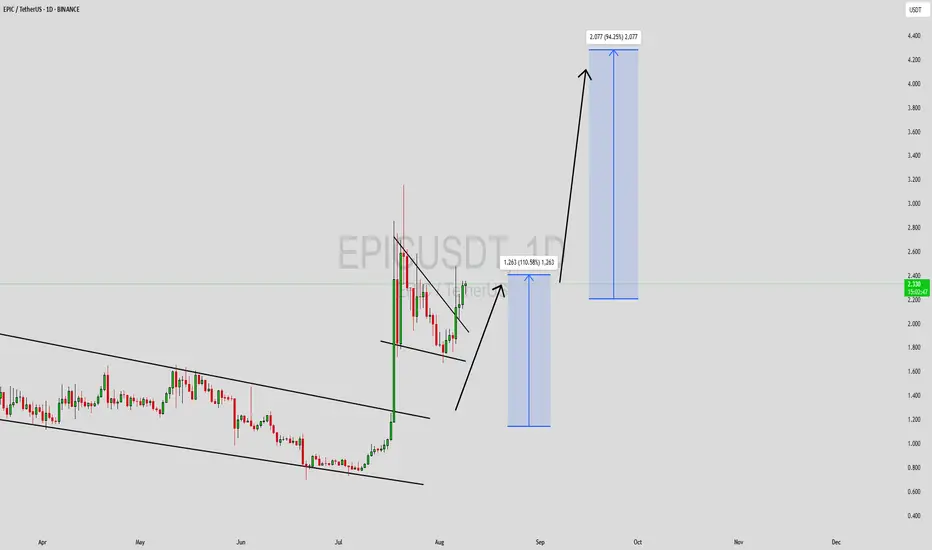
EPICUSDT Forming Descending ChannelEPICUSDT is currently trading within a well-defined descending channel pattern, which typically represents a period of consolidation before a breakout to the upside. This pattern is characterized by lower highs and lower lows, often indicating a temporary pullback in a larger bullish structure. As the price nears the bottom of the channel and begins to show signs of strength, many technical traders view this as a prime area for accumulation. With rising volume and renewed interest, EPIC may soon break above the channel resistance, initiating a strong bullish reversal.
Historically, descending channels have preceded major rallies when supported by increasing volume and bullish sentiment. The recent price action in EPICUSDT shows early signs of such a reversal. The asset has tested key support levels multiple times without breaking lower, which strengthens the argument for a bottom being formed. If the breakout confirms, the technical projection suggests a potential gain of 90% to 100%—a target that aligns with prior resistance levels and Fibonacci retracement zones.
EPIC is gradually gaining attention from the crypto community and investors alike, particularly due to its unique positioning in the altcoin space. As fresh capital flows into high-potential small caps, coins like EPIC can experience exponential growth. With DeFi, privacy, or utility-based narratives driving demand, EPIC could benefit from a wave of interest as market momentum shifts back in favor of altcoins.
✅ Show your support by hitting the like button and
✅ Leaving a comment below! (What is You opinion about this Coin)
Your feedback and engagement keep me inspired to share more insightful market analysis with you!
Epic to the moonEpic just reach fibo 1.618 and tested fibo 1 just now..
Time to heading to fibo 2.
Next tp is 3.16

Epic Chain 212% Move Mapped —The 2025 Altcoins Bull MarketThe altcoins market bull market is fully confirmed and this confirmation comes as soon as Bitcoin hit a new all-time high. When Bitcoin is strong, bullish yet sideways, the altcoins market tend to grow. The altcoins are growing now, some pairs growing three digits within hours and that's because Bitcoin continues to consolidate near resistance. This same dynamic will only strengthen and is set to continue for months.
Epic Chain (EPICUSDT) already hit bottom and is ready to grow. Here we have a very easy 125% target, a fast, strong and easy bullish wave. It is likely to go way beyond this target but this is based on the short-term. It will go beyond because the altcoins are producing over 50% in their first hour or two of the initial bullish breakout. More than 100% within days and the potential for the entire bull market will be 20-30X on average.
You've been warned. This is a friendly reminder.
Prepare and maximize profits. Do whatever it is necessary to make the most of this opportunity, it only happens once every four years. This is the 2025 bull market bullish momentum building up. Just as promised. You will be happy with the results.
Namaste.

Epic scalp short to $1.4778 areaJust now opened a scalp short position on epic. Targeting $1.4778 area for a 2RR approximately.
My stop is $1.5548

Epic pump to $1.58 today!Gm
Just went long on Epic/usdt.
Anticipating an epic pump to $1.58 area
Roughly 4RR
1.4299 stop or lower

EPIC New Update (8H)EPIC appears ready for a rejection to the downside and a drop.
Maintaining the supply zone, it could drop further.
The marked demand zone could potentially reject the price back upward again.
Do not enter the position without capital management and stop setting
Comment if you have any questions
thank you

Epicusdt short to 1.3149Just now opened a short position on Epicusdt. Took a scalp long on it last night which played out very well. Overall though I was expecting it to just correct up to then dump back down.
So this is the continuation trade t o the downside that am not attempting
see chart for more detail
Roughly 2.7-3RR trade

Epicusdt scalp longTook a long position on Epicusdt. Targeting 1.3527.
Expecting price to correct back up before new york session to then dump back down.

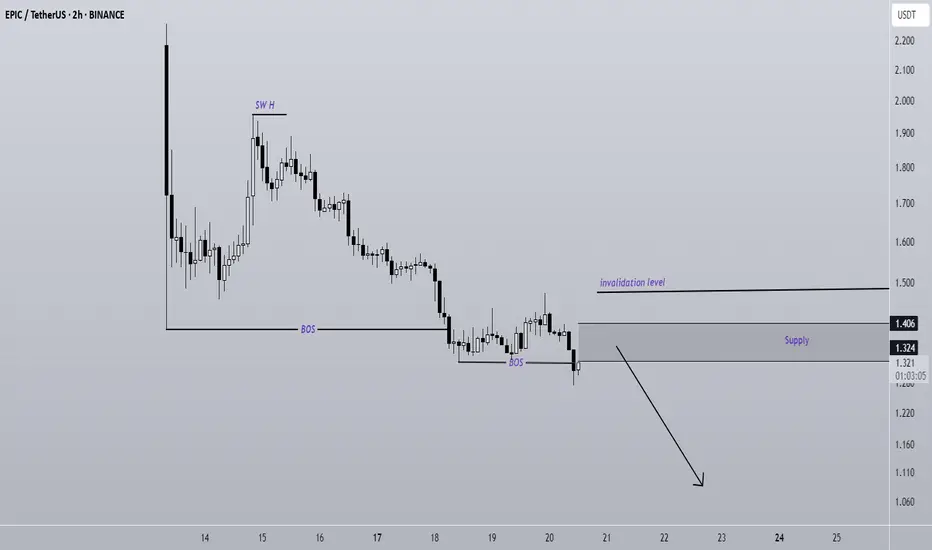
EPIC Is Bearish (2H)It has a bearish structure and is forming a trading kink, which acts as a supply zone. We expect a rejection to the downside from this supply area.
When your profit exceeds 10%, break even and secure some profits.
A daily candle closing above the invalidation level will invalidate this analysis.
A daily candle closing above the invalidation level will invalidate this outlook.
Do not enter the position without capital management and stop setting
Comment if you have any questions
thank you
EPIC/USDT Futures: Descending Triangle Breakout or Breakdown?Crypto Futures Technical Analysis (EPIC/USDT - 15m Chart)
1. Trend Direction:
The price is forming a descending triangle, indicated by the downward-sloping yellow trendline.
The trend is bearish, with lower highs being formed, suggesting strong selling pressure.
2. Key Support & Resistance Levels:
Support: Around $1.652 - $1.683 (highlighted in purple), where price recently bounced.
Resistance: At $1.819 - $1.85, near the descending trendline.
3. Potential Breakout or Reversal Points:
If the price breaks below the $1.652 support level with strong volume, a further drop is likely.**
If the price bounces and breaks above $1.819, it could confirm a bullish breakout.
4. Entry & Exit Points:
Long Entry: If price bounces off $1.652 - $1.683 with bullish confirmation.
Take Profit (TP): Near $1.819 - $1.85.
Stop Loss (SL): Below $1.652 (around $1.630).
Short Entry: If price fails to break $1.819 and rejects the descending trendline.
TP: Near $1.652 or lower.
SL: Above $1.85.
5. Risk-Reward Assessment:
The chart shows a risk-reward ratio greater than 1:2, making the long trade attractive if price holds support.
Watch volume spikes for confirmation—high volume on a breakout confirms strength.
Final Thoughts:
Bullish scenario: A break and close above $1.819 could trigger an uptrend.
Bearish scenario: A breakdown below $1.652 could push the price lower.
Monitor for candlestick confirmation (e.g., bullish engulfing, doji, or hammer at support).
Would you like a more detailed breakdown or strategy suggestions? 🚀

EPIC Is Building An Uptrend! Hey Traders, in today's trading session we are monitoring EPICUSDT for a buying opportunity around 1.75 zone, Epic is trading in an uptrend and currently is in a correction phase in which it is approaching the trend at 1.75 support and resistance area.
Trade safe, Joe.
