ETC Late on rallyAlts made a strong rally today but ETC still waiting for his moment.
Bears definitely fighting to keep ETC down, not sure they will win this time if BTC stays bullish.
Waiting for a move very soon.
Happy Tr4Ding !
Trade ideas

ETCBTC-Random I often like picking a loser from the Binance Loser filter & seeing if there is any potential or any opportunity. I’m eyeballing this. We’ll see if it develops further. Aloha!

ETCBTC News rally or Bullish RSI Divergence? You decide.See callout bubbles. Always measure your risk and be okay with being wrong ; ) Wait patiently and get the price that you want. Use the market. Don't let the market use you.

ETC/BTC - A big pictureIn celebration of today's Coinbase listing, here are some of my thoughts on on ETC. I'm bullish. Chart says it all.

Etherum Classic (ETC) Great Volume... Additional Bullish Action!Etherum Classic (ETCBTC) has shown huge gains since bouncing from bottom on 14th August @ 0.001714, reaching today as high as 0.002317 with huge volume building up.
This can definitely mean the start of something. ETC is showing signs of additinoal bullish action coming.
We have the biggest volume on the daily candle today of all time, on Binance, with the exception of the 12th June 2018.
You can expect an additional 30% gain in the coming days/weeks, and even more additional bullish action if the cryptocurrency market turns green... Which seems to be the fact, since Bitcoin is preparing for a new wave up...
Check the comment section for my latest Bitcoin Trade Idea.
Thanks a lot for reading...
Namaste.


ETCBTC looks beautiful.A mega bull run about to ensue for ETCBTC pair. I don't care what btc does. this one is going to go bonkers.
GOod luck

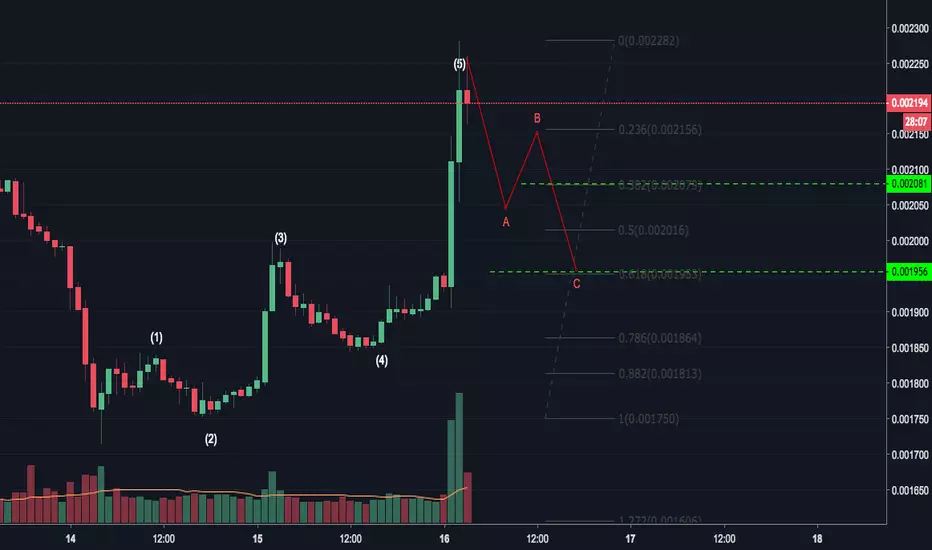
$ETC & coinbase listingPlacing some long order on the retracement
that's some really low order but i don't like buying the green
We might had 5th waves and about to do an ABC correction, but with this kind of event i'm not sure the retracement will be that deep
ETC breaking out of the downtrendETC has had a short pump in anticipation of the Coinbase listing. Now with the 'bleu app' - for main stream retail investors, its likely a second pump will follow but first what seems likely is a small correction upwards when we break out of this downtrend. Also bounching of the longer trendline and staying in the greater pennant that is getting close to being finished. If BTC would make a dive i still think ETC would be fine for now but the fact it has only gone down a bit in the last 90 days where other coins have been hammered is something to keep your stoplosses on for.

ETC, A Nice Shorting OpportunityEven though we are near a significant support ETC shows a strong downtrend energy and I believe we can take some risk to harness it. So let's Short ETC .
We can watch these levels for a reversal:
0.00185
0.001325
But I suggest you to follow the trend and see where it goes before its energy exhausts.
And as usual, let's be humble and admit that we can be wrong. The best way to express this is setting a Stop Loss . Mine would be at 0.0025081 .


ETC/BTCChart says it all.
If you're into stops, I'd keep a loose stop loss here.
Alpha is shaking this market to death.
Alts should stop bleeding after BTC gets a direction.
Whether it breaks 6k and continues bear or doesn't and begins uptrend, alts should be shaken out enough.

Ethereum classic waiting for growthWaiting from etherclassic up to the next levels 0,0036-0,0041-0,0052-0,0062-0,0072-0,009-0,0105-0,0125.

Short ETCETC has completed the pump, will now be on the buy zone 24xxx, maybe go deeper in the 22xxx-23xxx area because we are in the bearmarket market will be a big impact.


ETC - Price AnalysisETC price has retraced and begun to form a falling wedge / bull flag.
Stochastic RSI - Bottomed out and although there hasn't been a bull cross yet, I would recommend watching some of the smaller time frames to look for volume confirmation that would cause the signal line to crossover.
RVI - The relative volatility index indicates that price volatility has been driven down.
Kumo - Further confirms the lessened volatility as seen on the RVI
Tenkan/Kijun - Both have begun ranging which tells us that price momentum has begun decreasing
Due to the lessened volatility, oversold conditions, continuation chart pattern, I would expect to see the price break to the upside of the flag and possible extend to the .618 fib level near the 0.002510 price range.
However, if a tops break fails to occur, I would expect the price to find support above the .236 fib level at one of the two green support lines drawn.


Ethereum Classic . Still On. [200%+ Profits Opportunity]The past 4 days was one of the sweetest for both ETC holders and the developing team. By default this reversal trend which happened on the past 4 days was actually expected as we earlier, in mid June, reported on our telegram channel that Coinbase was planning to list ETC and that it would be a very good opportunity for the coins holders. But most crypto traders didn't give much attention on the listing and didn't expect the coin to show this much progress specially because of the overall current market situation. As we have seen its reversal move though, ETC touched the 50% retracement level at around 296k sats. By this the wave which started to make a progress showed a very well volume backed up move. At this point the 1D chart showing that it needs a consolidation and will show us some correctional waves upto the 23.6% fib retracement level and will most likely start its 3rd wave creation towards the 78.6% level if volume keep moving like it did for the past days since the tweet from the Coinbase team. Therefore we expect some correctional moves for short term investment. But the weekly chart really looks like fine and a great opportunity for a longer term accumulation.
Indicators that confirms the elliottwaves creation are mainly the volume is looking very good for the time being. RSI is at 69 which shows that the trading possibility needs some patience till the correction gets its bottom. Both the 50EMA and 89EMA are still below the price. Which actually showed some up moves while the price corrects.
Fundamental reasons for long term accumulation signal is mainly the tweet that has been made by Coinbase on Friday which stated that
"Our engineering team is beginning final testing of Ethereum Classic on Coinbase products. We expect final testing to be completed by Tuesday, August 7, at which point we expect to announce that we’re ready to accept inbound transfers of ETC.https://t.co/l7smcSY3q8 "
on their twitter page.
Accumulation Zone : 225000 sats - 245000 sats
Stop Loss : 170000 sats
Possible Targets
T1 : 267900 sats
T2 : 295200 sats
T3 : 322500 sats
T4 : 361400 sats
T5 : 410900 sats
Good Luck.
Legal disclaimer:
Information on this channel is our team's analyst's "opinion" based on data available at this point in time. These opinions are not recommendations to buy or sell securities/commodities and cryptocurrencies. Trading and investing is a risk and you should not rely on this data to make any financial decisions. You must consult a financial advisory licensed by regulatory agencies in your legal jurisdiction. All information stated here and in our reports don't guarantee any possible profits or losses. Please do consider to do your own due diligence and research when making any kind of a transaction with financial implications. With Regards. TeamTWA.
