Trade ideas


ETCCrypto Report
ETC has been steadily going down. It is currently at support if that support is not held then it is headed to $20 support level. That drop will be another 17% down. Any quick run up in ETC will just be faded. So ETC has to start basing to show some strength.

ETC Normal cyclesDont panic this is normal for etc. etc will keep going down keep in mind a rebound is still in the works before the year is over


ETC in short-termHi everyone
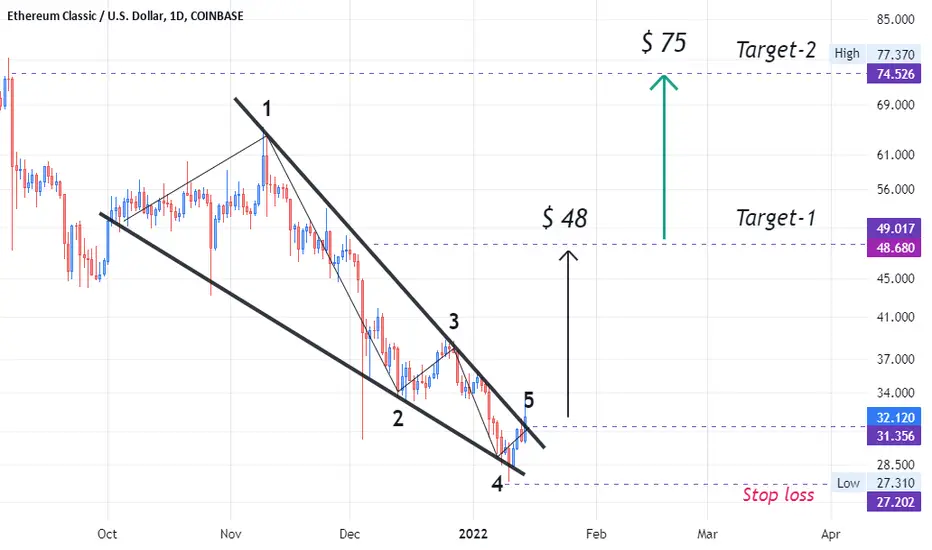
A Possible scenario is shown in the chart (there is buying pressure, falling wedge pattern).
Long term analysis:
ETC and Dogecoin Correlation
Seems, the composite operator changes the price behavior!
ETC bottoms outAll ETC indicators have deviated from the bottom
There will be a rebound in demand in the short term
In the short term, I am optimistic about etc
Follow me to take you to achieve financial freedom

Is $32 the new support for ETC?ETC been falling ever since May 2021 with a peak of $175. I believe we are in huge upswing. I believe ETC just broke its first downtrend and is testing $32 as the new support. I believe it will have a rally bounce from $32 and finally break from $34 resistance. If not ETC probably retest $29 but I doubt that.

Ethereum Classic (ETC) - January 15Hello?
Welcome, traders.
If you "follow", you can always get new information quickly.
Please also click "Like".
Have a nice day.
-------------------------------------
(ETCUSD 1W Chart)
Above the 16.722 point: the uptrend expected to continue
Above 36.305 point: Expected to create a new wave.
A stop loss is needed to preserve the profit and loss as it declines from the 36.305 point.
However, if it does not fall below the downtrend line, it is expected to rise, so trade cautiously.
At this point, it needs to rise at least 42.1 points to turn into an uptrend.
However, to accelerate the uptrend, you need to break out of the downtrend line.
-------------------------------------
(ETCBTC 1W chart)
Above 0.000970-0.001374 section: expected to continue upward trend
Above 0.001816-0.002334 section: Expected to create a new wave.
Since it fell from the 0.000970 point, it is entering the mid- to long-term investment area.
Therefore, it is important to keep the price above the 0.000629 point.
------------------------------------------
We recommend that you trade with your average unit price.
This is because, if the price is below your average unit price, whether the price trend is in an upward trend or a downward trend, there is a high possibility that you will not be able to get a big profit due to the psychological burden.
The center of all trading starts with the average unit price at which you start trading.
If you ignore this, you may be trading in the wrong direction.
Therefore, it is important to find a way to lower the average unit price and adjust the proportion of the investment, ultimately allowing the funds corresponding to the profits to be able to regenerate themselves.
------------------------------------------------------------ -------------------------------------------
** All indicators are lagging indicators.
Therefore, it is important to be aware that the indicator will move accordingly as price and volume move.
However, for the sake of convenience, we are talking in reverse for the interpretation of the indicator.
** The MRHAB-O and MRHAB-B indicators used in the chart are indicators of our channel that have not been released yet.
(Since it was not disclosed, you can use this chart without any restrictions by sharing this chart and copying and pasting the indicators.)
** The wRSI_SR indicator is an indicator created by adding settings and options to the existing Stochastic RSI indicator.
Therefore, the interpretation is the same as the traditional Stochastic RSI indicator. (K, D line -> R, S line)
** The OBV indicator was re-created by applying a formula to the DepthHouse Trading indicator, an indicator disclosed by oh92. (Thanks for this.)
** Support or resistance is based on the closing price of the 1D chart.
** All descriptions are for reference only and do not guarantee a profit or loss in investment.
(Short-term Stop Loss can be said to be a point where profit and loss can be preserved or additional entry can be made through split trading. It is a short-term investment perspective.)
---------------------------------

ETC, rising from the bottom.The following content is machine translation:
Formally, it rebounded after repairing the lower shadow line on December 4.
Today's strong rise broke the downtrend line.
The indicator macd is golden fork, and the energy column rushes to the zero axis.
It is expected to continue to rise and see more.


Bullish Flag ETC $600 End of the year?Its been over 8 months since ETC leg up to $175. We have touch the bottom probably 4 times. Is it time for reversal. ETC has form what it looks to be a bullish flag. Ripe for a strong leg up 1.618 fib suggest $280 minimum. Higher fib suggest $500 or $600.

Next Goal Is To Improve Reward:Risk RatioTo improve Reward:Risk Ratio, wait for pull backs. Wait for pull backs to the Horizontal Support & Resistance Level, Fibonacci Retracement Level, EMA 10 Level, EMA 20 Level, and Trend Line Level.

ETC - Long-Term and Short-Term Plan!Hello everyone, if you like the idea, do not forget to support with a like and follow.
ETC is approaching a strong support zone 25-30 in green so we will be looking for buy setups.
Long-Term: right
on DAILY, ETC is forming a channel in blue but the upper trendline is not valid yet, so we are waiting for a new swing high to form around it to consider it our trigger swing. (projection in purple)
Since ETC is sitting around the lower blue trendline and support, we will also be looking for buy setups on lower timeframes.
Short-Term: left
on H4, ETC is forming a trendline in red but it is not valid yet, so we are waiting for a new swing high to form around it to consider it our trigger swing. (projection in purple)
Trigger => Waiting for that swing to form and then buy after a momentum candle close above it (gray zone)
Meanwhile, until the buy is activated, ETC would be overall bearish can still trade lower.
Good luck!
All Strategies Are Good; If Managed Properly!
~Rich


Will ETC Coin Price Rise To New High?The weekly technical chart of the ETC coin price has been seeing a consolidated move. Ethereum classic price on the daily chart is looking to jump beyond $50. The upside momentum of ETC may see a setback near $45. In contrast, the bounceback zone of the coin can be found around $30. On coming to the daily chart the coin has been fluctuating near its 20 DMA. If the asset price sees a momentum to a new high then a new high to a new high can be seen. ETC/BTC pair can also see move to a new high in the future.

ETC - Potential Bullish Reversal!Hello everyone, if you like the idea, do not forget to support with a like and follow.
ETC is sitting around a strong support zone in green so we will be looking for buy setups.
on DAILY: ETC is forming a channel in red but the upper trendline is not valid yet, so we are waiting for a new swing high to form around it to consider it our trigger swing. (projection in purple)
Trigger => Waiting for that swing to form and then buy after a momentum candle close above it (gray zone)
Meanwhile, until the buy is activated, ETC would be overall bearish can still trade lower till the lower green support before going up.
Good luck!
All Strategies Are Good; If Managed Properly!
~Rich

ETC Best case scenario for 2022With ETC expected too get too 1000 this year this is my expectation. This is all speculation but if it plays out like it should this should show around how it could play out

Ether ImmutableGood old forgotten ETC
The original ethereum
Code is law
Buy it below 10 bucks
Hold to 3 figs again
NOT TARDING ADVICE

ETC - Hidden Bullish Divergence on the 2week chart!Before reading, get rid of your moonboy mentality and no emotions for dips/corrections! Cannot rule bearish scenarios! Dips are for buying!!
People are so focused on the hourly/daily timeframe that they get emotional on every dip! Take a step back to the weekly/monthly timeframe and see why I'm so bullish now. Stop looking at the short-term dips/rise. Short term is irrelevant for the move that is coming!
You can't be emotional in these markets (stocks, forex, crypto, real estate, etc.). You will lose this game following the news and doing what the majority does. News creates emotions. Everything you need to know are on the charts. News is manipulated by the elites, and they take advantage of our emotions. Stop listening to the news and pay more attention to the charts. Don't follow the majority, because the majority will lose in the end! Also, don't buy the hype when everyone is buying. instead buy the fear when everyone else is selling
Everything is on the chart! Cryptocurrencies are on the verge of exploding higher. Dips/Corrections are normal and needed in a bull market and are buying opportunities! Huge gains opportunity in the coming months! Never trade blindly. Use multiple indicators to make calculated decisions. Trade with no emotions!
Facts:
1. Price and Oscillator (RSI) are creating a "Hidden Bullish Divergence"!
2. RSI - Highly oversold on the 2week. Also creating a hidden bullish divergence compared to price!
3. Stochastic RSI - Awaiting bullish cross and above the 20 level for bullish confirmation!
4. In 2017, ETC dipped to the 0.618. Present time, we dipped again to the 0.618!
Buy Level: Best opportunity is $31 (highly likely we would reach down there again
Sell Leve: $200-300
"If you can't beat the fear, do it scared!"
"Be fearful when others are greedy, and greedy when others are fearful!" - Warren Buffet.
"Markets are a device for transferring money from the impatient to the patient. - Warren Buffet
"Show me the charts, and I'll tell you the news." - Bernard Baruch
"The secret to investing/trading is figuring out how rich you want to be and how poor you're willing to become."
"If you want to live like the 5% of the population who are hugely successful, then don't act like the 95%!"

ETCETC has finally broke resistance and claimed the 36.75. It is holding strong above the 36.75. A break above 38 can take ETC to 41 and then 45. The major resistance is at 45.

ETC Best ScenarioTake position after breakout and closing candle.
It's just for education.
I will be happy to use your comments.

ETCETC is in a falling wedge which is a bullish pattern. If it can break above the 36 level resistance then it will most likely head to 41 and potentially 44 level. The trend is still bearish on the daily. So any run up will only be a lower high. I'm long on short term.
