ETCUSDETCUSD
A new Buy signal will be triggered if the price manage to break above 80.00 level, which will open the way to new targets around 94.00 followed by 107.00
The SL will be 71.00 after breaking above mentioned level above 80.00
Trade ideas

$ETC Quick Technical Analysis - FIb to the upside? After this morning reversal, fibs were able to be seen clearly and the daily did not close in danger territory. All crypto seems to be reversing in this matter but we still need major bullish closures for the rest of the week to stay on this track.
$ETC Tapping the 78.6 fib at around $46 USD was mucho importante. Retesting that price is better for us to make this next leg up HUGE.
I Will keep $BTC and $ETC monitored as well.
P.S. Elon, please just keep quiet on this hopeful next leg up.

Ethereum Classic (ETC) formed bullish Gartley for upto 162% moveHi dear friends, hope you are well and welcome to the new update on Ethereum classic coin.
The previous trade setup of ETC produced more than 1400% rally:
Now this time daily time frame chart, the price action of the ETC has completed the final leg of another Gartley pattern.
Buying and sell targets:
Buy between: $82.30 to $57.10
Sell between: $102.14 to $149.77
Stop loss:
The maximum extent of potential reversal zone to $57.10 can be used as stop loss.
Possible profit and loss ratio:
As per the above targets, this trade has a profit possibility up to 162 % and a loss possibility is 31%.
Note: Above idea is for educational purpose only. It is advised to diversify and strictly follow the stop loss, and don't get stuck with trade.


ETCUSD try to quit panic sellingThe advisor marketMiracle generated an input signal for ETCUSD at a price of 71.17 USD con target 98,97 price that I see slightly to rise for the obstacles present in the diagram.
The chart is compatible with the signal, the marketSentiment is rather negative yet but cryptos are famous for changing it very very quickly.
This idea is based on a signal generated by the advisor Marketmiracle, down on this page you will find the link to the page of signals of the advisor that you can see for free without any cost or registration.

ETC FractalI'm still bullish despite this setback. Notice similar capitulation wick right before rebound which was part of previous structure. Also notice how it backtested for the firs time ever and held critical historical support (previous ATH) and how it made a higher low by doing so - most altcoins made a lower low (ETH included) at the same time! This means potential Hidden Bullish Divergence on daily timescale is still in play. No reason to panic here, it's solid.


ETC.786 retracement around 57-58. I’m buying yes it crashed a lot lower. Was bought up instantly. Starting to rebuy ETC here. Was stopped out at breakeven when I bought at 84$

Possible Bottom- Although not confirmed yet, Ethereum started a strong rejection of it's previous high, and it's 50 period moving average.
- In my opinion, it's likely we will see higher highs and higher lows on the 4h time frame within the upcoming weeks.
- If that's the case, in my opinion, it will likely slowly continue to the upside, a bull run to the $300s is likely.


ETC/USD BULLISH TRIANGLE BREAKOUTETC is forming a nice bullish triangle and we could possibly see it break to the upside. However, a break to the downside could see it retrace quite a bit. Most cryptos are pulling back right now.


ETC to 500 LONGI have been tracking ETC since about 2$ and I think the end target for the season will be around 500$. we are in the last portion of an accumulative coil, rounding bottom on a cup. lets see the squeeze :)

Possible move for ETC !!The buying position is between $ 92 and $ 93, this idea will be considered only if we manage to break that resistance from $ 89. Good luck!!


Inverted h&s with negative momentum decreasing Still looks to be in this giant flag?
Possible inverted head and shoulders.
Negative momentum decreasing.
MACD looking to pop over.
EMAs converging.
If Elon can stay off his phone for a few minutes maybe we can see a pattern play out.
Be patient.
Trade smart.

ETC Falling Wedge with Hidden Bullish DivergenceBreakout and backtest complete, higher low and Hidden Bullish Divergence on daily timescale. Dropping volume on the way down adds to sellers' exhaustion argument. Targets: top of the structure, measured move confluent with psychological resistance and 1.618 fib level. By far my favorite crypto chart right now, showing very similar set of variables to BCH trade that got us 100% returns 2 weeks ago.

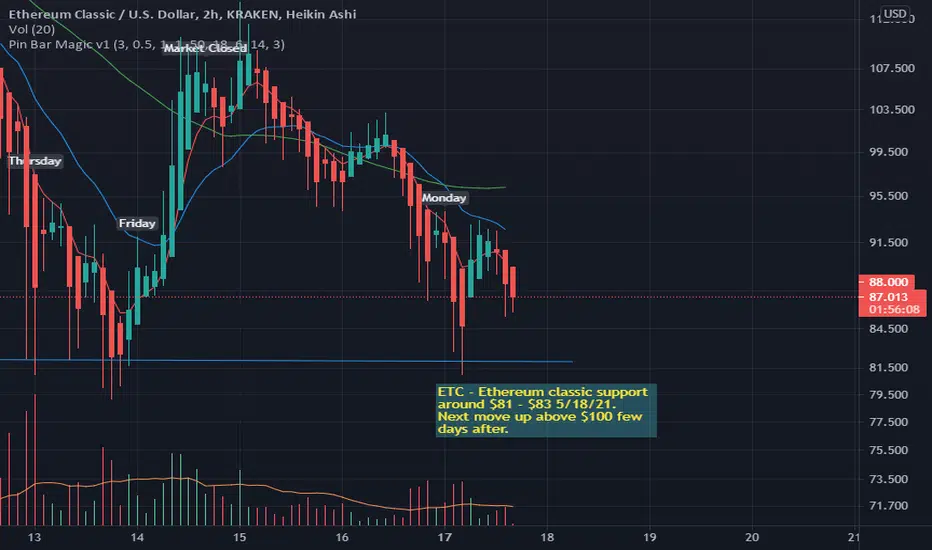
ETC - Ethereum classic support around $81 - $83 5/18/21ETC - Ethereum classic support around $81 - $83 5/18/21. Next move up above $100 few days after.
Just an idea, Not Financial Advice. Your trades can go to $0.00, do your homework!!