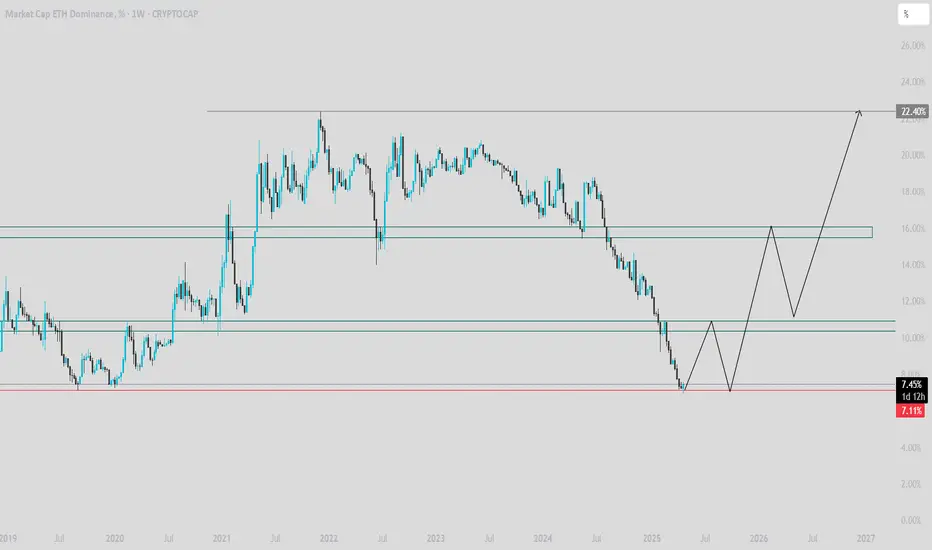
Ether dominance projectionThis is another indicator for the altseason that everyone is expecting.
Once this starts lifting to the upside we can say that an altseason is brewing .Until then we can only watch and accumulate alts at these lower prices.
Key data points
Previous close
—
Open
—
Day's range
—
About Market Cap ETH Dominance, %
Coin
Born only a few years ago in 2015, Ethereum has grown into an established blockchain with an even more established native coin. Some might think it's all just hype, but the chart we've prepared here says otherwise — it displays Ethereum's dominance over the whole crypto market (the ratio of ETH market cap to the cumulative crypto market cap). If the line goes up, ETH is rising in value against other coins, and it might be a sign for you to reconsider your portfolio decisions. If it goes down, well, up to you what to do with that.
I WARN EVERYONEAltcoin Crash Started March 2024. The Road Down Is Open, Altcoins May Suffer and Fall Another 90%. Expect 2025 to Be Bearish. Harmonic patterns may see ETH dominance fall by 3-4%. Be careful.
My ideas are confirmed -
1.
2.
3.

ETH Dominance#ETH is approaching its All time low dominance of 7.09%.
Eth is declining every day as compared to #btc.
Will history repeat itself by reversing from this zone?
Or
#Ethereum will be doomed!
C
Share your views???

ETH.D potential major bounce incoming!!Expect a reversal on ETH.D here very soon. We have hit major support levels. Sentiment has not been this low for years. BTC and Total Alts also showing strength. Keep an eye on the ETH.D chart.

Ethereum Dominance Possible Doing Like ThisDoing sweep low under 7% and maybe ETH around 1100 and then accumulation phase before back to the range and testing another resist

ETH.D at bottom!This is the buy zone and there would be fluctuations at the bottom.
you can see probable pathway clearly.
THERE WILL BE A PROLONGED ALT SEASON.

ETH.DOMINANCE Bullish divergenceIn ETH.DOMINANCE chart show clear bullish divergence on daily timeframe which means ETHUSD and ALTCOINS in bullish momentum in coming days. Stay focus on bullish side and ready for uptrend.

ETH.DInterest in the Ethereum network continues to decline.
Recently, the network has mainly been used for gambling with meme coins.
I see no meaningful use for humanity.

ETH Dominance Very Dominant Downtrend (RSI)The RSI on ETH.D shows a large channel with a strong bearish favor
Currently RSI is in oversold area
I expect on this Weekly chart RSI to reverse and possible one day even get out of this extremely bearish state
Weekly

Eth.dEthereum dominance is in weekly demand, the market may turn in favor of Ethereum altcoins at any moment, be patient.

See all ideas
Summarizing what the indicators are suggesting.
Oscillators
Neutral
SellBuy
Strong sellStrong buy
Strong sellSellNeutralBuyStrong buy
Oscillators
Neutral
SellBuy
Strong sellStrong buy
Strong sellSellNeutralBuyStrong buy
Summary
Neutral
SellBuy
Strong sellStrong buy
Strong sellSellNeutralBuyStrong buy
Summary
Neutral
SellBuy
Strong sellStrong buy
Strong sellSellNeutralBuyStrong buy
Summary
Neutral
SellBuy
Strong sellStrong buy
Strong sellSellNeutralBuyStrong buy
Moving Averages
Neutral
SellBuy
Strong sellStrong buy
Strong sellSellNeutralBuyStrong buy
Moving Averages
Neutral
SellBuy
Strong sellStrong buy
Strong sellSellNeutralBuyStrong buy
Displays a symbol's price movements over previous years to identify recurring trends.