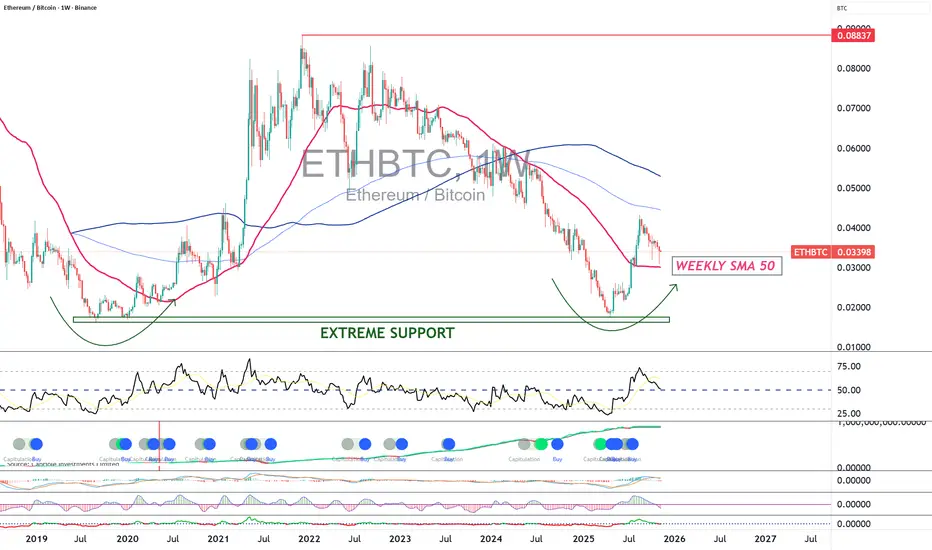
Ethereum could once again outperform BTCFrom a technical perspective, the ETH/BTC ratio appears ready to resume its upward movement after several weeks of consolidation. Both timeframes — daily and weekly — point to a bullish scenario for Ethereum against Bitcoin.
On the daily chart, the ratio is trading in an uptrend established since
Related coins
ETH / BTC - 3 rising valleysNice 3 rising valleys here on ETH / BTC with the usdt pair putting in a daily 3 bar play. If Ethereum starts to run here on the pair, that would be a positive sign for risk, and another piece of the puzzle for an "alt season". Usually leading patterns like this have a little trickery to them before


Potential ETH rallyWith a clear break and retest of weekly trend line.
A possible potential wave C or wave 3 rally
We might be heading for a strong bull move across all alt coins

ETH/BTC – Weekly Fractal Repeating the 2020 SetupThe chart currently shows a highly similar structure to the Ethereum/Bitcoin weekly pattern from late 2020, right before the major altcoin season.
2020 Pattern Recap
• A clear S9 Buy signal triggered on 16 Nov 2020
• Price broke above the red Ichimoku cloud, confirming a major trend shift
• A retra

#ETH_BTC (Large Cap Confidence relatively to #BTC)#ETH/BTC
In Next 2 to 3 months this Analysis must work. We can predict a start of a Altcoin Season in December 2025.

ETH/BTCHere is the range I'm looking at for the ETH/BTC pair. A bounce in this box means buying Ethereum will be more profitable than Bitcoin.

Short trade
📘 Trade Journal Entry
Pair: ETHBTC
Direction: Sell-Side Trade
Date: Thu 30 Oct 25
Time: 12:00 pm
Session: NY Session PM
Timeframe: 1 Hour
🔹 Trade Details
Metric Value
Entry 0.03498
Profit Level (TP) 0.031992 (+ 8.75 %)
Stop Level (SL) 0.03523 (– 0.71 %)
Ri

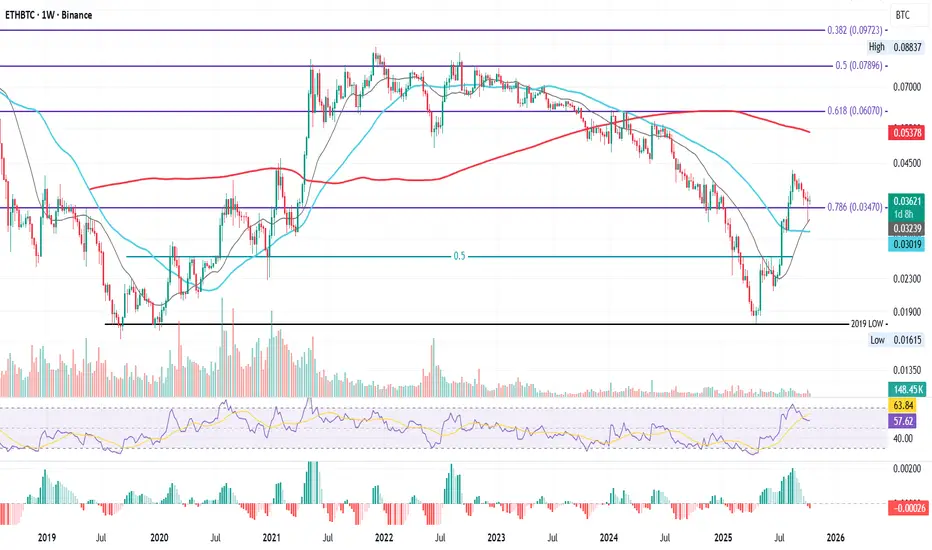
ETHBTC Weekly Series – Tracking the Shift, Week by WeekETHBTC Weekly – Confluence at the 0.786 Fib
This is ETHBTC on the weekly, now retesting one of the most important Fibonacci levels on the chart: the 0.786 Fib at 0.03470.
This time, price isn’t testing it alone. Just below, we have the 21-week MA and 50-week MA, both providing strong confluence. L
Ethereum is deciding where it wants to live.This is not a trade idea, this is a long term concept, most of my portfolio is swing when bull market comes (monthly/yearly) not trade (daily/weekly).
This is a solid question that will have to be played out in the upcoming years, Ethereum keeps changing its monetary policy and right now has less s

See all ideas
Summarizing what the indicators are suggesting.
Oscillators
Neutral
SellBuy
Strong sellStrong buy
Strong sellSellNeutralBuyStrong buy
Oscillators
Neutral
SellBuy
Strong sellStrong buy
Strong sellSellNeutralBuyStrong buy
Summary
Neutral
SellBuy
Strong sellStrong buy
Strong sellSellNeutralBuyStrong buy
Summary
Neutral
SellBuy
Strong sellStrong buy
Strong sellSellNeutralBuyStrong buy
Summary
Neutral
SellBuy
Strong sellStrong buy
Strong sellSellNeutralBuyStrong buy
Moving Averages
Neutral
SellBuy
Strong sellStrong buy
Strong sellSellNeutralBuyStrong buy
Moving Averages
Neutral
SellBuy
Strong sellStrong buy
Strong sellSellNeutralBuyStrong buy
Displays a symbol's price movements over previous years to identify recurring trends.