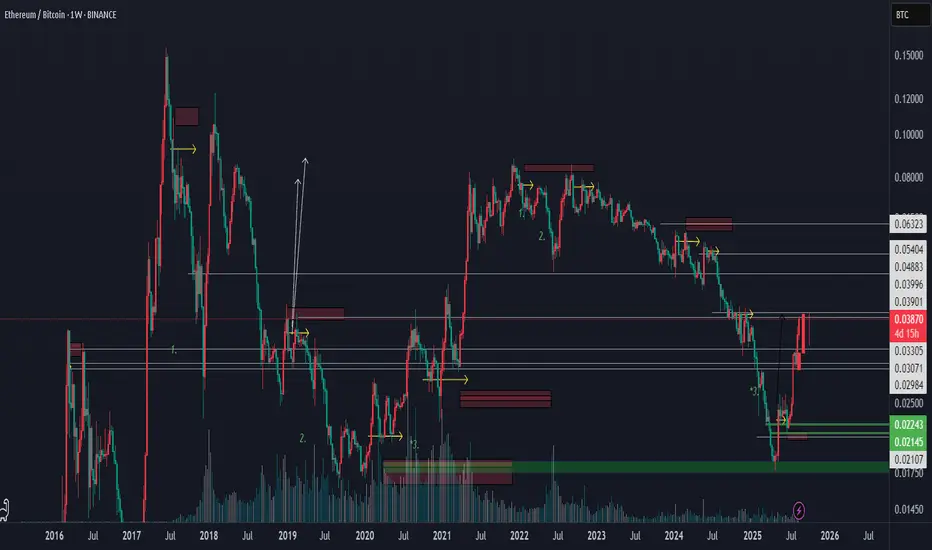
ethbtc [W] - 2019 shelf retest & long exit (April to Aug 25)So we've had a pretty eventful 2025 so far for eth . For most wanting to know why eth moves have been so aggressive and to quote an old mentor "Gung-Ho", all we need to do really is take a look at ETHBTC.
Historically alts have had their moments in relation to their strength (or weakness) against bitcoin. this time is no different.
To key my chart, the yellow lines show the point of control or gain/failure for any given local spot. the red and green bands are by extension a couple of points above or below that mark. These bands represent 'slippage' or liquidity points provided by either algo (standard deviations), stop losses and failure of trend.
To be fair the size of the band is relative to the volatility of the underlining pair. In this example i believe it should fall within the 3.2-->13.6% range. enough to liquidate or margin call all positions from 20x to 5x. This represents the majority of open interest in any given point.
My goal is always to observe the point of control and look to rebound from these initial liquidity hunts. April 2025 gave us this opportunity and cleared the bench. For those late to the party the market offered us a juicy little v-bottom setup. from there on you had exits all the way up to the liquidity band sitting just above the support shelf created all the way back in 2019.
By no means am I claiming the move is 100% done, but if you check volume, I'd say 80%+ has exited, and so am I.
NEXT: rotate back into BTC primarily and watch.
Sentiments not all that great in the real world, but at least this move has some definitive-ness to it. Peace out
#btc #eth #ethbtc #2025 #alt #mstr #goingup-goingup
ETHBTC trade ideas
Will Ethereum and Altcoins Continue to Grow?Hello friends
You see the Bitcoin to Ethereum chart.
You may be wondering what caused Ethereum to grow. I should tell you that this chart shows us what happened.
The price is in a downtrend, which indicates a money movement (from Bitcoin to Ethereum).
When you see that after 3 hits to support, the price has managed to break the support and the price has fallen and formed a downward channel, which could indicate that Ethereum's growth is continuing.
So now we have identified the support areas for you using Fibonacci, based on the price range that has formed.
The price is now at an important support area, as you can see, we had a bullish reaction when we hit the support area, but the price reversed due to the strength of the downtrend...
Now, if the support area breaks, the price can move lower to the specified targets.
Keep in mind that if the price grows, the upper support areas that were broken now become resistance and the price must be able to break them for our trend to be bullish, but as long as the price is down, the upward trend of Ethereum will continue and the upward trend of Ethereum will also make the altcoins bullish...
*Trade safely with us*

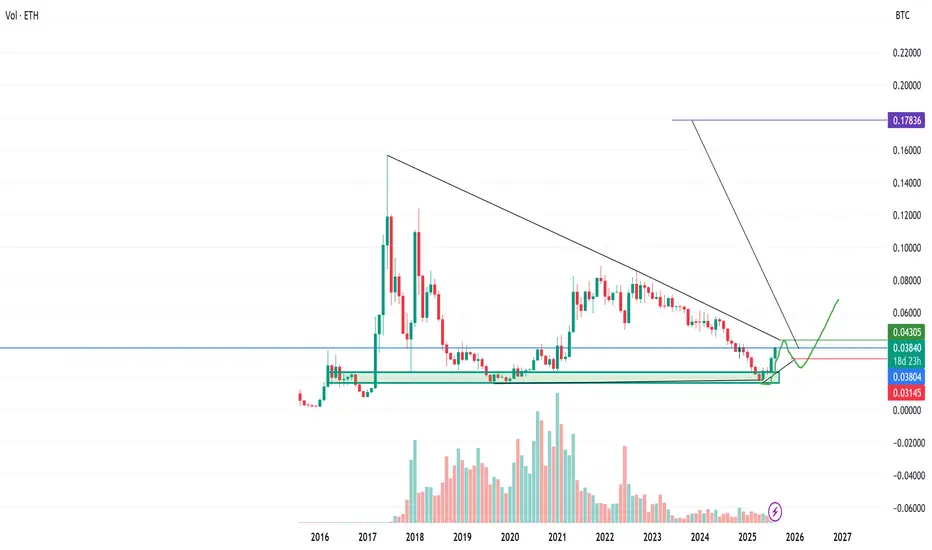
ETH vs BTC: Breaking a 3-Year DowntrendEthereum is attempting to break above its long-standing downtrend against Bitcoin for the first time since 2022. ETH strength vs BTC has historically preceded periods of altcoin outperformance.
This is an early signal, confirmation is still needed. Watching closely to see if ETH can sustain momentum here.
Educational chart only, not financial advice. Past performance ≠ future results.

ETH vs BTC 2025 EuforiaWhen ETH rises, it is valued more than BTC.
When it falls, the BTC increases.
Generally, after the rise, it moves horizontally.


Ethereum lagging behind BTC - not for much longer ~ $21K ETHI have recently posted a ETH/USDT chart which indicates we will get a 13.8K eth target. The ETH/BTC chart is also looking strong for ETH, with a 3x on the cards, which would come out to around $21k USDT per ETH.
$ETH \ $BTC GONNA SEND INCOMING!The Ethereum-Bitcoin parity saw a local bottom after a long-term correction phase and began to move upward. The upcoming process will continue with a sharp upward trend.

Ethereum Looks BullishThe weekly chart looks downright incredible. As discussed, ETH has finally broken bearish market structure and made a higher high, also breaking above the 50 MA for the first time in years. Now it has retested those levels multiple times as support and is outpacing Bitcoin, which is trading sideways.
ETH looks ready to outperform for the foreseeable future.

What I'm Expecting From ETHBTCIt looks clear that there is a breakout on ETHUSD, but what about ETHBTC?
Ethereum will pump in an attempt to keep up with bitcoin, and ultimately fail mere months afterwards.
Following technicals alone, we intend to sell our position at .06 or thereabouts, when hitting resistance, early 2026.
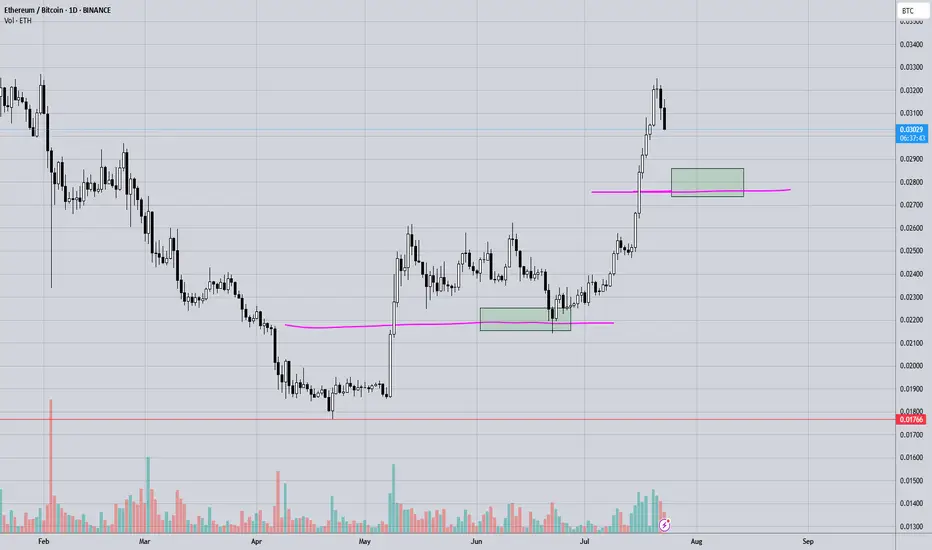
ETHBTC – Daily Supply & Demand AnalysisEthereum is showing a strong bullish recovery against Bitcoin, bouncing off the major demand zone around 0.020–0.023 and pushing higher with consistent bullish momentum.
🔍 Key Observations:
Demand Zone: 0.020–0.023 (orange zone)
This area has been a strong base for buyers, triggering the current rally.
Immediate Resistance: 0.0415
A breakout above this level would confirm a major bullish structure shift and could lead to further upside toward 0.0559.
Supply Zone: 0.0559 (blue zone)
Historically a strong resistance area where sellers have stepped in.
📈 Possible Scenarios:
Bullish Continuation – If ETHBTC breaks and holds above 0.0415, price could target 0.0559, offering a potential 30% upside from current levels.
Rejection Scenario – If price fails to break 0.0415, a pullback toward 0.0333 or even 0.0274 could occur before another bullish attempt.
✅ Bias:
Medium-term bullish while price remains above 0.0274, with 0.0415 as the key breakout level to watch.
Disclaimer: This analysis is for educational purposes only and is not financial advice. Manage your risk properly before trading.

ETHBTC – Bottom Likely In!Finally stepping in to say it—ETHBTC has likely bottomed.
April marked the final month of its bearish phase, and it just tapped the impulse zone from the last major move, which also lines up with a key range low we haven’t seen since December 2019.
The weekly is starting to show early signs of strength, adding weight to this being a pivotal area.
From a risk/reward standpoint, this is arguably the best BINANCE:ETHBTC setup in a long time.
Time to act accordingly—this could be the moment many have been waiting for. I expect BTC dominance to give alts some room over the next couple of weeks. The real test comes in July.
MARKETSCOM:ETHEREUM BINANCE:ETHUSDT

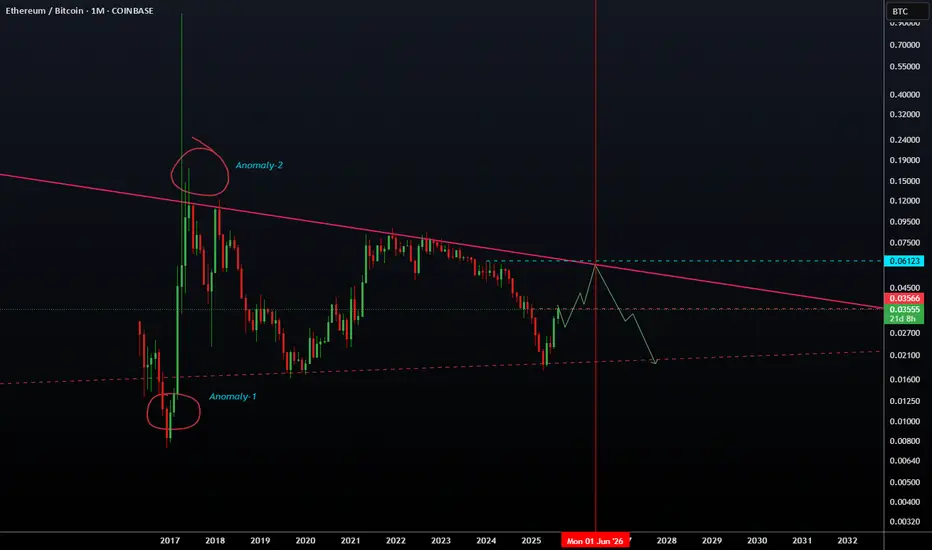
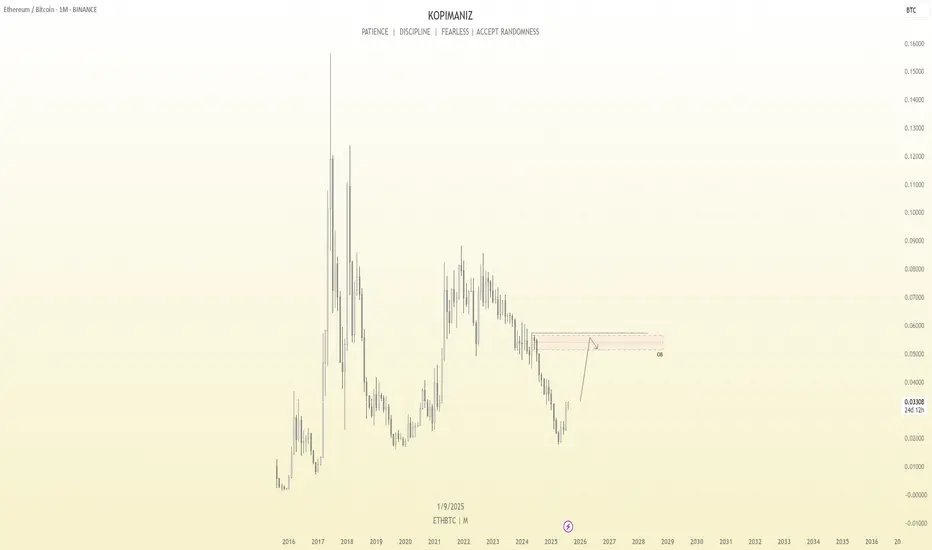
ETHBTC Monthly Outlook: Ethereum Poised to Outperform BitcoinEhereum is showing signs of strength against Bitcoin on the monthly timeframe. After a prolonged downtrend, ETHBTC appears to have formed a potential bottom and is now gearing up for a bullish move.
My projection suggests that ETH will likely outperform BTC in the next 1–2 months, with price targeting the monthly order block zone around 0.06 BTC. This zone acted as a strong resistance previously and now represents a significant magnet for price.
A strong ETH rally will likely spill over into the broader altcoin market, potentially kicking off an altcoin season. This setup aligns with the historical pattern where Ethereum leads the charge before other altcoins follow.
ETH VS BTCHi there!
What to hold BTC or ETH?
High probability correction is coming!
There is another scenario too because EW is relative E=mc2 :-)

4H iHS for 1DHL?if 0.036 holds this could be a inverted head and shoulder in the 4 hour chart.
the 1 day timeframe showed some support at its ema12.
if the 4 hour chart starts a uptrend this could indicate a possible higher low in the daily timeframe.

ETH : BTC [Ethereum is making history]Ethereum vs Bitcoin Finally Breaks 365-Day Moving Average Strongly
The Breakdown of This Moving Average Had Previously Caused Explosive Growth

ETH vs BTC, Trend shift?📝 After months of underperformance, we're finally seeing some relative strength from ETH vs BTC.
📍ETH/BTC has bounced off a key historical support zone — a level that previously marked major reversals in the cycle.
📈 While the bounce is still in early stages, it breaks the streak of lower lows and gives hope for a trend shift. If we apply the logic of diminishing returns, even a conservative positive scenario suggests a potential move of +150–200% from the bottom, aligning with previous cycle rebounds.
💡 It’s still too early to call a full rotation, but this is the first sign of real momentum from Ethereum in a long time. Worth keeping an eye on.

ETH/BTC Golden Cross Ignites
This is ETH/BTC on the daily chart.
The golden cross is now confirmed: 50MA has officially crossed above the 200MA.
Price reacted immediately, jumping straight to the 0.786 Fib level at 0.0347 a key resistance.
This confirms the bullish structure we’ve been tracking:
– Golden cross ✅
– Breakout above 200MA ✅
– Push into major resistance ✅
Now all eyes are on the 0.0347 zone.
If price can flip it into support, momentum could accelerate quickly.
Always take profits and manage risk.
Interaction is welcome.

ETH/BTC: Golden Cross Reloaded?This is ETH/BTC on the daily chart.
A major event is about to unfold: the golden cross, where the 50MA crosses above the 200MA.
The last time this happened was in early 2020, around the same price zone, right after a bounce off the 2019 low double bottom and a rejection from the 0.5 Fib level, which sits halfway between the 2019 low and the 0.786 Fib.
In 2025, we’re seeing a strikingly similar pattern:
– Price bounced off the 2019 low
– Got rejected again from the 0.5 level
– And now appears to be gathering strength to flip that level and the 200MA to confirm the Golden Cross
Always take profits and manage risk.
Interaction is welcome.

Eth/Btc✨ Ethereum vs Bitcoin — perhaps a new season is near...
📍 First week of August 2025
From the depths of a long, quiet downtrend,
Ethereum has risen from the 0.018 ~ 0.022 BTC zone...
Where unseen hands quietly caught the fall.
Now standing at 0.031 BTC:
RSI has regained strength, entering bullish territory.
Moving averages are converging — hinting at a possible shift.
All eyes now on the major resistance at 0.042 BTC...
🔮 Possible scenarios:
1️⃣ A breakout above 0.042 BTC → a path toward 0.057 and beyond.
2️⃣ Failure to break resistance → a return to the same mysterious yellow box.
📌 For now, the market breathes with renewed energy...
But is this the renaissance of ETH against BTC?
Or just another dance before the next calm?
🕊️ Patience remains our greatest ally...

Total Ethereum Dominance on the Market!🔚 July is coming to an end, and judging by the Monthly Return, it's safe to say that #ETH has outperformed BTC by a wide margin this past month. Yes, we saw something similar in May, but this time we finally have clear confirmations on the chart:
✅ ETH/BTC has broken out of a 4-year downtrend ;
✅ RSI Breakout after the oscillator hit the lowest point in its entire history ;
✅ MACD Bullish Crossover ;
✅ ETH/USDT Broke through the main resistance level (triangle) ;
✅ Spot ETF inflows are outpacing BTC by volume.
Many are still not prepared for what lies ahead. 🤫

ETH/BTCSince we had a massive break of weekly resistance on this pair...chances are that we might come back to visit previous resistance and test it as support...
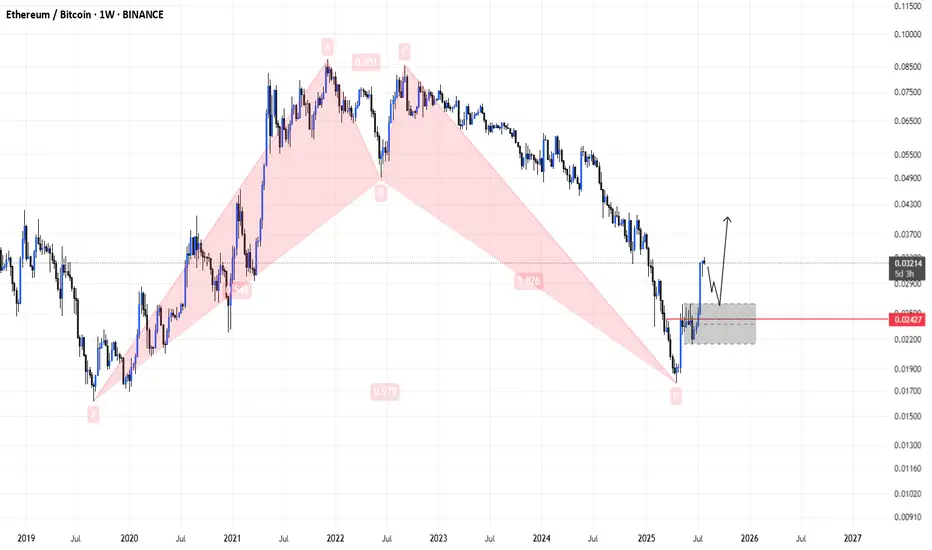
harmonic idea of eth/btc to up trend A harmonic idea for an ETH/BTC uptrend involves identifying specific **bullish harmonic patterns** on the ETH/BTC price chart. These patterns, like the Gartley, Bat, Butterfly, or Crab, are characterized by precise **Fibonacci ratio relationships** between their price swings (labeled X, A, B, C, D).
The "idea" is that if an ETH/BTC chart forms one of these bullish harmonic patterns, it suggests a high probability that the ETH/BTC ratio (meaning ETH's value relative to BTC's) will **reverse upwards** from a specific "Potential Reversal Zone" (PRZ), which is calculated using the Fibonacci extensions and retracements of the pattern's legs. This implies that ETH is likely to outperform BTC in the near future, making a long position on ETH/BTC potentially profitable.
Traders look for confirmation of the reversal at the PRZ using price action (e.g., bullish candlesticks) or other indicators before entering a long trade.
