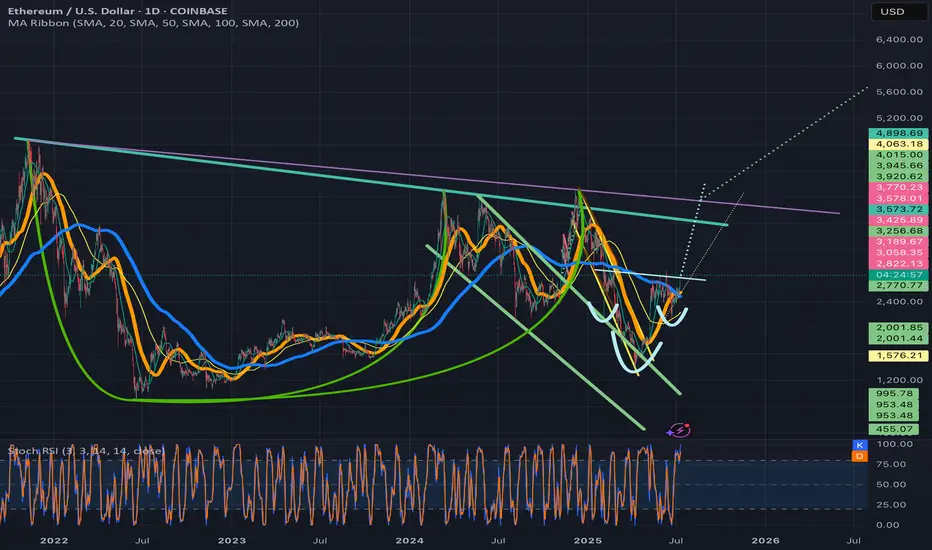
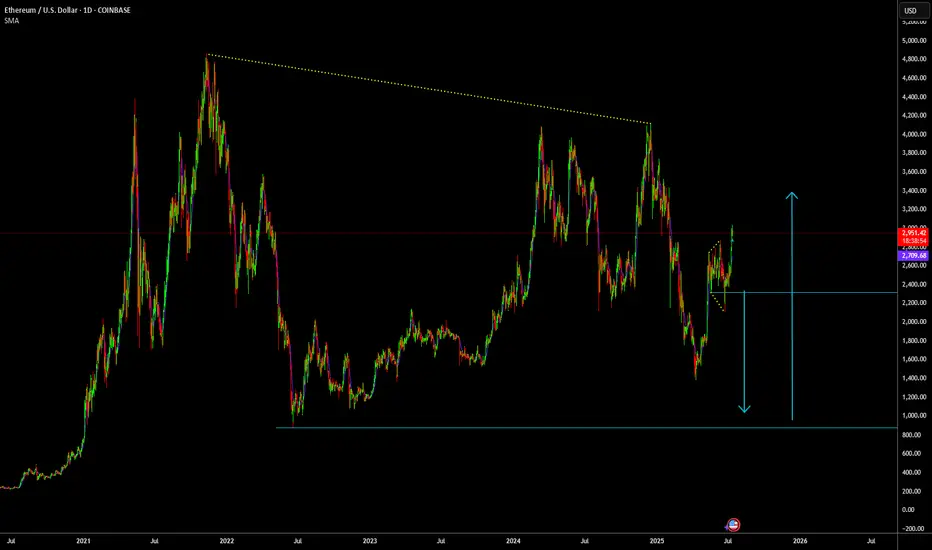
ETHUSD: Bullish Momentum, SUPPORT:2400/2100 TARGET=3400/3700The ETH/USD chart looks bullish, with room to move higher toward $3,400 and possibly $3,700. If the trend loses steam, support near $2,400 could come into play.
ETHEREUM trade ideas

Ethereum H4 | Potential bearish reversalEthereum (ETH/USD) is rising towards a swing-high resistance and could potentially reverse off this level to drop lower.
Sell entry is at 2,601.80 which is a swing-high resistance.
Stop loss is at 2,700.00 which is a level that sits above a swing-high resistance.
Take profit is at 2,397.10 which is a multi-swing-low support that aligns with a 50% Fibonacci retracement.
High Risk Investment Warning
Trading Forex/CFDs on margin carries a high level of risk and may not be suitable for all investors. Leverage can work against you.
Stratos Markets Limited (tradu.com ):
CFDs are complex instruments and come with a high risk of losing money rapidly due to leverage. 63% of retail investor accounts lose money when trading CFDs with this provider. You should consider whether you understand how CFDs work and whether you can afford to take the high risk of losing your money.
Stratos Europe Ltd (tradu.com ):
CFDs are complex instruments and come with a high risk of losing money rapidly due to leverage. 63% of retail investor accounts lose money when trading CFDs with this provider. You should consider whether you understand how CFDs work and whether you can afford to take the high risk of losing your money.
Stratos Global LLC (tradu.com ):
Losses can exceed deposits.
Please be advised that the information presented on TradingView is provided to Tradu (‘Company’, ‘we’) by a third-party provider (‘TFA Global Pte Ltd’). Please be reminded that you are solely responsible for the trading decisions on your account. There is a very high degree of risk involved in trading. Any information and/or content is intended entirely for research, educational and informational purposes only and does not constitute investment or consultation advice or investment strategy. The information is not tailored to the investment needs of any specific person and therefore does not involve a consideration of any of the investment objectives, financial situation or needs of any viewer that may receive it. Kindly also note that past performance is not a reliable indicator of future results. Actual results may differ materially from those anticipated in forward-looking or past performance statements. We assume no liability as to the accuracy or completeness of any of the information and/or content provided herein and the Company cannot be held responsible for any omission, mistake nor for any loss or damage including without limitation to any loss of profit which may arise from reliance on any information supplied by TFA Global Pte Ltd.
The speaker(s) is neither an employee, agent nor representative of Tradu and is therefore acting independently. The opinions given are their own, constitute general market commentary, and do not constitute the opinion or advice of Tradu or any form of personal or investment advice. Tradu neither endorses nor guarantees offerings of third-party speakers, nor is Tradu responsible for the content, veracity or opinions of third-party speakers, presenters or participants.

$ETH clear for an impulsive move to $3600?CRYPTOCAP:ETH has slowly but surely cleared resistance, with just the swing high to tackle which will activate another trade signal in my Trade Signals Substack.
Major support High Volume Node, daily pivot and daily 200 EMA proved tough support and demand continues to come in.
ETFs had an astonishing amount of inflows yesterday at $200M+
Analysis is invalidated below $2100
Safe trading

head and shoulder forming on ETHETH has formed head and shoulder on 1 hr time frame if it decisively breaks 2525 and moves down the expected target of 2415 may be possible this H&S will become invalid if ETH stays above 2575-2585 then we can expect elliot wave 5 on shorter time frame to come into play which would set targets for 2710-2850 extension of wave 5 can be upto 3050....should 2410 be achived then we are looking at deeper correction which will happen on bigger time frame opening possible doors for 1900 levles

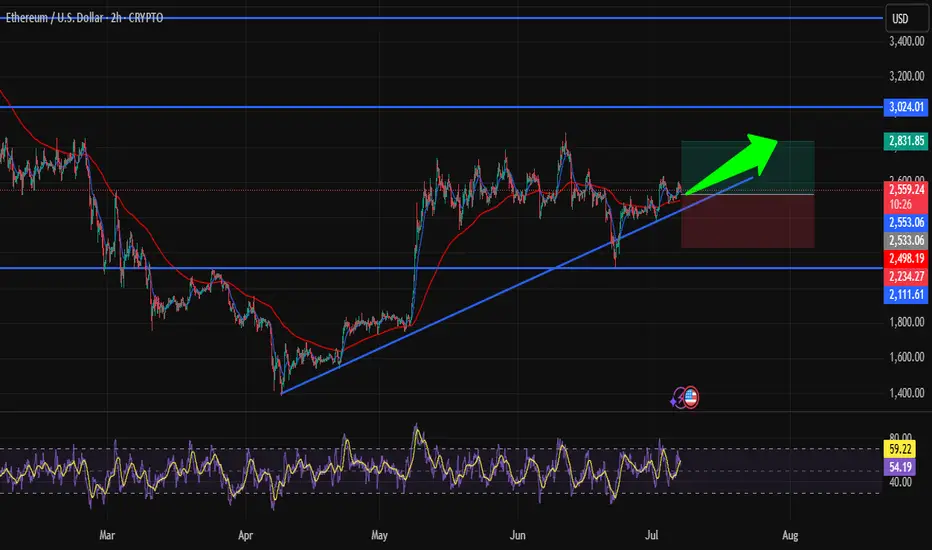
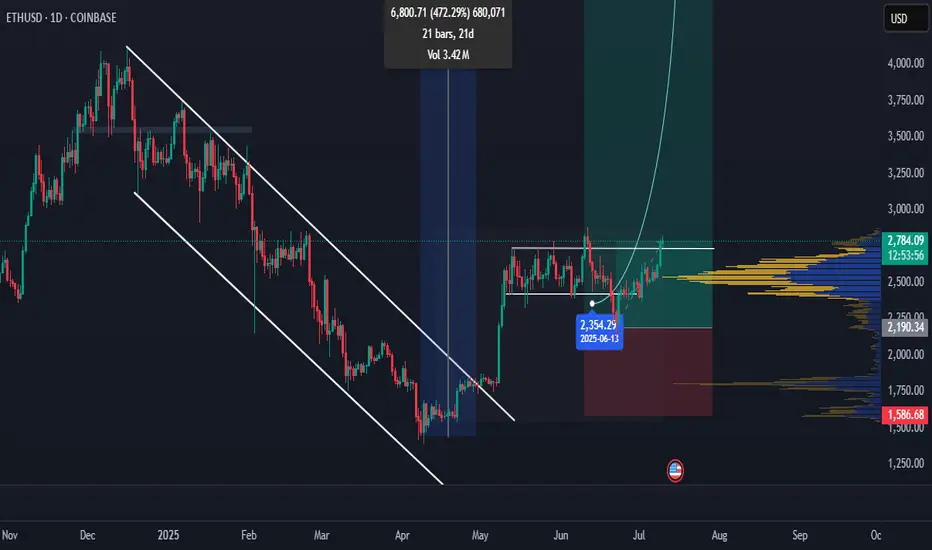
Is ETH Heading to $2800? Strategic Entry in Bullish TrendHi traders! , Analyzing ETH/USD on the 2H timeframe, price is respecting an ascending trendline and showing signs of continuation within the bullish structure:
🔹 Entry: 2555
🔹 Take Profit : 2831
🔹 Stop Loss : 2234
After consolidating above key support and retesting the ascending trendline, ETH is showing potential for a bullish continuation. The recent bounce is forming higher lows, and price remains above the 50 EMA, suggesting buyers are maintaining control.
RSI is currently turning upward from the mid-zone, signaling growing bullish momentum while still avoiding overbought conditions. The trendline has been respected several times, adding confluence to the setup.
If momentum holds, the TP around 2831 lines up with a significant resistance area from previous structure — a logical zone for price to reach in the short term.
⚠️ DISCLAIMER: This is not financial advice. Every trader is responsible for managing their own risk and strategy.
ETH POTENTIAL BULLISH GARTLEY Seeing a potential bullish gartley forming on ETH if it is unable to break above the .886 of the AB wave. Targets would be $2004 to $1786 for the .786 or 1.618 of the BC leg

Eth looks ready to meThe range is going to break soon, price looks primed to test 3200 area. Lots of wicks cleared overhead resistance. My plan is to take 25% off at 3200 and let the rest run. I like Eth to hit ATH by around Thanksgiving. On the TD indicator (momentum), eth is hitting green 2s on a lot of bigger timeframes, this is not something that happens too often. Last time i came across such a confluence it was Zoom pre-covid.

Wajani Investments: ETHUSD Analysis
ETHUSD has currently formed a triangle with a resistance broken to the upside. In most circumstances, I’ll like to wait for a retest of that resistance, i.e. resistance-becomes support to be sure that the breakout was not false. Once that level is tested and held, I’ll take a trade assuming Leg2 would have a similar move like Leg1. This is a very good trade with a 1:4 RR.
If you have any questions, feel free to ask. You can add or subtract from this idea.
Remember, trading always carries risks, and this is for EDUCATIONAL PURPOSES only.

GO LONG ETH BEFORE "CRYPTO WEEK"Next week is "Crypto Week" in the U.S. House of Representatives. The House will consider the CLARITY Act, the Anti-CBDC Surveillance State Act, and the GENIUS Act.
Bill Helps Ethereum By...
CLARITY Act Protecting decentralized infrastructure from U.S. blacklists
Anti-CBDC Act Preserving demand for decentralized stablecoins, defending privacy
GENIUS Act Encouraging gov use of public blockchains like Ethereum

ETHUSD: Next Move Is Down! Short!
My dear friends,
Today we will analyse ETHUSD together☺️
The in-trend continuation seems likely as the current long-term trend appears to be strong, and price is holding below a key level of 2,514.4 So a bearish continuation seems plausible, targeting the next low. We should enter on confirmation, and place a stop-loss beyond the recent swing level.
❤️Sending you lots of Love and Hugs❤️

Ethusd breaking above invh&sEthusd chart has a similar set upas the total2 chart, a cup and handle that is breaking up from a smaller inverse head and shoulders that will complete the handle to the cup. Ethereum actually has two potential to trendlines for its cup and handle and I wouldn’t be surprised if both are valid. The breakout target for the inverse head and shoulder pattern will take price action above both of them. Once we solidify the top trendline for the cup and handle patterns as support the breakout target for it is $7161. Ethereum just recently had a golden cross on the daily which adds to the probability the inverse head and shoulder pattern breakout will be validated. *not financial advice*
ETHUSD one more downside motion possible follow entry rulesHey people,
no divergence showing up through the previous downside impulse, meaning, one more move down before long term upside is probable,
Ethereum: Potential for Long Trend as Bulls Eye Key Levels Current Price: $2581.17
Direction: LONG
Targets:
- T1 = $2645
- T2 = $2710
Stop Levels:
- S1 = $2530
- S2 = $2480
**Wisdom of Professional Traders:**
This analysis synthesizes insights from thousands of professional traders and market experts, leveraging collective intelligence to identify high-probability trade setups. The wisdom of crowds principle suggests that aggregated market perspectives from experienced professionals often outperform individual forecasts, reducing cognitive biases and highlighting consensus opportunities in Ethereum.
**Key Insights:**
Ethereum has shown signs of resilience and stability despite broader market volatility. Professional traders are favoring Ethereum as a potential long opportunity based on its consolidation at key support levels. Bullish divergence has been noticed in its relative strength index (RSI) and trading volume, indicating that sellers are starting to exhaust themselves while buyers gradually regain control. This sets the stage for a potential upward breakout in the coming days.
Moreover, Ethereum’s dominance in the digital asset space continues to benefit from the expanding use of decentralized applications (dApps) and smart contracts, which solidify the outlook for continued adoption and innovation. Long-term sentiment remains positive, with Ethereum receiving accumulating interest from institutional investors.
**Recent Performance:**
Ethereum recently held firm at $2580 despite testing lower support levels near $2500 in volatile trading sessions. Its ability to close above significant levels repeatedly demonstrates strong relative momentum compared to other cryptocurrencies. Over the last week, Ethereum has gained 4.5%, outperforming Bitcoin and other altcoins in the same period. This resilience has attracted renewed attention from both short-term swing traders and long-term holders.
**Expert Analysis:**
Technical analysts highlight Ethereum's symmetrical triangle formation over the past three weeks, which traditionally signals a breakout potential. Coupled with increasing accumulation volume, Ethereum seems poised to test resistance around $2645 in the next trading sessions. Should momentum sustain, secondary resistance near $2710 is realistic. However, traders should keep an eye on fundamental factors such as total market capitalization trends and external economic indicators, which may trigger unexpected volatility.
Moreover, Ethereum's scalability developments through upgrades such as "The Merge" to Ethereum 2.0 have bolstered its long-term outlook. Analysts remain optimistic about Ethereum's role as a cornerstone for decentralized finance (DeFi) and web3 technologies.
**News Impact:**
Recent reports of institutional accumulation—particularly from asset management firms—highlight growing confidence in Ethereum as a diversified investment vehicle. Moreover, Ethereum's sustained relevance in the transition to proof-of-stake (PoS) reinforces its strategic positioning. The cryptocurrency market has shown relative resilience amid equity market dips, and Ethereum's eco-friendly upgrades are being well-received in global markets. This news underpins Ethereum's current bullish setup.
**Trading Recommendation:**
Based on technical, fundamental, and sentiment analyses, Ethereum appears to be a strong candidate for a long position. Its consolidation above support levels, combined with bullish technical setups, signals potential upside in the near term. Traders should use disciplined stop losses, with S1 at $2530 and S2 at $2480, for risk management. Upside targets of $2645 (T1) and $2710 (T2) provide strong risk-reward opportunities. Ethereum's robust ecosystem and accumulating investor interest affirm its value as a long-term and speculative asset.

ETH/USD: The Great Ethereum Bounce is HERE!🚀 THE MOON MISSION (Resistance Zone)
HEALTY TARGET: $3,500 - Your text says it all!
Upper Trendline: Acting as launch pad
Psychological Resistance: $3,000 round number
🟢 CURRENT LAUNCH PAD
Price: $2,529.15 - Breaking above key resistance
Previous Resistance: $2,324.45 - Now turned support
Support Zone: $2,277.81 - Strong foundation
🔴 DANGER ZONE (Abort Mission)
Critical Support: Lower trendline around $2,000
Major Support: $2,277.81 level must hold
💡BUY ZONE: $2,100 - $2,180 🎯
⚠️STOP LOSS: $1999 (Previous resistance) ⚠️
TAKE PROFIT 1: $2,650 (Take 50% profits) 🔥
TAKE PROFIT 2: $3,300 (Let winners run!) 🔥

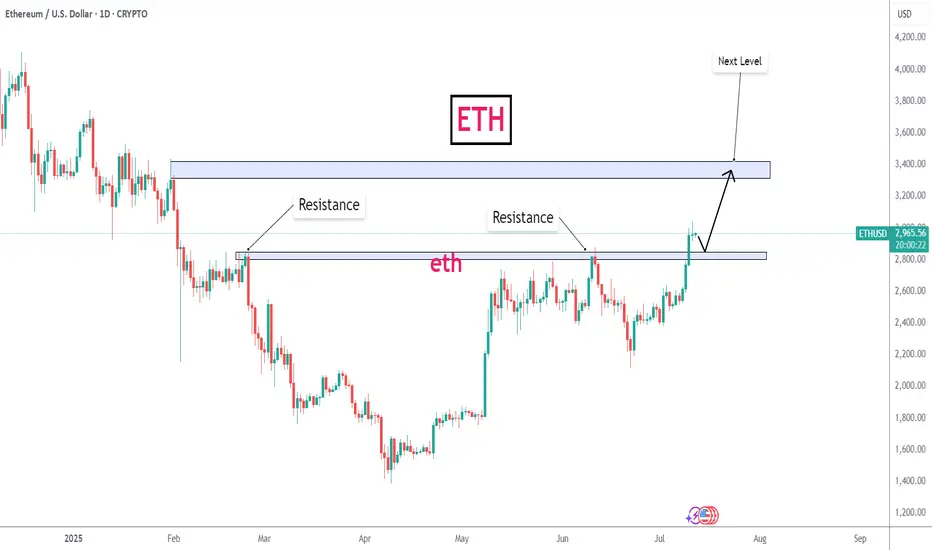
ETH - Back at the Level Everyone Forgot.Everyone’s watching ETH pump right now like it’s something new. It’s not. Look closer:
This is a look back in time to the breakdown that started to slide in Jan 2025.
That clean base around $3300 was holding for months in late 2024. It failed in January Q1, dragged us to sub-$2K by March, but now we’re right back under it.
This isn’t a random pump, it’s ETH revisiting the exact area it broke down from.
• White line = previous floor that gave out
• Dotted line = current price climbing back up into that structure
A move above $2960–$3300 flips the entire structure from resistance to reclaimed floor.
Market memory’s short, but price tends to remember everything.

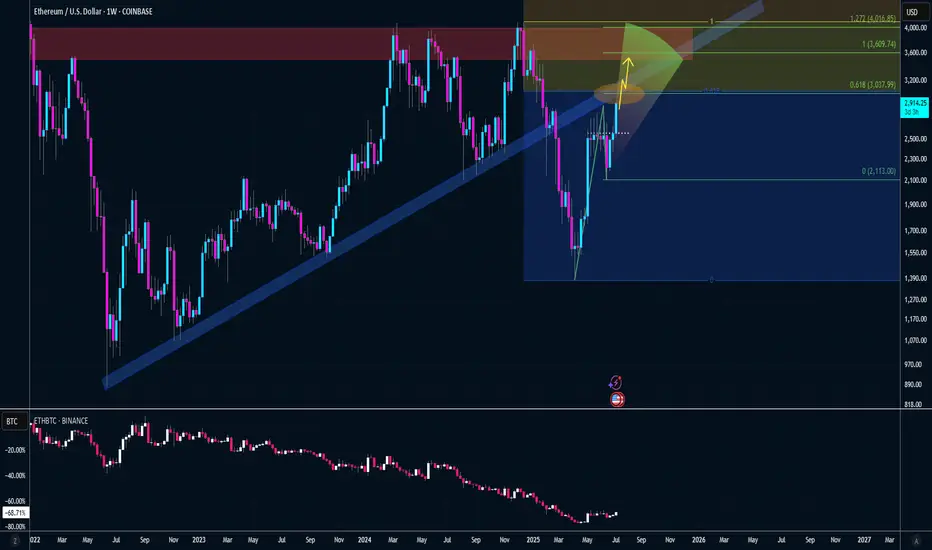
Ethereum Breakout Is Imminent!🚀 CRYPTO:ETHUSD is approaching the June peak, and a breakout would confirm a bullish sequence in play.
Upside targets are set at $3,600 – $3,960, aligning with key Fibonacci levels and challenging the 2024 highs.

ETH resumes it's rally!!! | 5k loading! We got the perfect entry in our prediction.
ETH continues to give ALT season hints. Once the bitcoin outflow starts, expect 8k COINBASE:ETHUSD
What do you think of the idea? any counter ideas?
I'm open for feedback. Feel free to drop your thoughts!
ETH – Next Stop 3D 200MA?ETH on the 4H closed the week strong after holding support at the 0.5 Fib and 200-day MA.
If price holds here, it could attempt another push toward the 3D 200MA.
Let’s see how the week unfolds on the macro and political fronts.
Always take profits and manage risk.
Interaction is welcome.

$ETH 4H Update: Target 1 hit! Ethereum has reached the $2,600 . CRYPTOCAP:ETH 4H Update:
Target 1 hit! Ethereum has reached the $2,600 level after a clean breakout from the falling wedge. Holding above support confirms bullish momentum — next key target is $2,800 as long as price stays above $2,400

Bitcoin & Ethereum New Quarter | What To Look For🎯 New Quarter For COINBASE:BTCUSD & COINBASE:ETHUSD — What To Look For
As we enter a new quarter, smart money is already positioning.
Institutional investors, hedge funds, and asset managers don’t just trade price — they rotate capital based on quarterly performance, risk appetite, and macro expectations. That’s why each quarterly open is a key inflection point across all markets — including crypto.
In this video, I break down:
• 🧠 How institutional capital rotation impacts Bitcoin and Ethereum
• 📈 Key levels to watch as Q3 unfolds
• 🔁 What are the likely outcomes
• 📊 How to prepare for volatility and new trend formation
This isn’t just another candle — it’s the start of a new chapter in the cycle.
If you’re serious about understanding where the money flows next , this video is for you.
This is the likely outcome
Price not ready to moon yet
Strong candle implying new highs incoming
Watch for bearish stop hunt on new quarter
This is a bullish outside bar
MartyBoots here , I have been trading for 17 years and sharing my thoughts
👍 Enjoyed the insights?
Let me know your thoughts in the comments below — and don’t forget to like this post to support the channel!

ETH Daily: Contracting Triangle Nearing Completion – Downside BrPattern Overview
Textbook five-wave contracting triangle (A-B-C-D-E) fully formed
Price compressed between converging trendlines – coiled spring ready to release
Volume steadily declining into apex – classic pre-breakout signature
Multiple indicators point to downside resolution
Technical Analysis
Elliott Wave Structure
Clean 3-3-3-3-3 corrective sequence confirmed
All waves respect triangle rules: C < A, D < B, E < C
Converging boundaries create pressure for explosive move
Timing Analysis (Neely Method)
Triangles complete within 60-80% of A-to-apex timespan
ETH now sits directly in this critical window
Resolution expected within 4-6 weeks maximum
Price Projection Methods
Largest Wave Rule: Thrust often equals biggest internal leg → Target: $1,350 then $900
Minimum Line Rule: Must exceed lowest triangle point (~$880) for valid thrust
Fibonacci Extension: 0.75-1.25x of C-D height → Extended targets: $750-$300
Key Levels & Targets
Support Break: Pink trendline (see chart)
Initial Target Zone: $1,200-$900
Extended Targets: $600-$300 if momentum builds
Invalidation: Close above upper resistance line
Trading Strategy
Entry: Daily close below rising support line
Target 1: $1,200-$900 (confluence zone)
Target 2: $600-$300 (1.25 fib extension)
Stop Loss: Re-entry into triangle after breakdown
Risk Management: Small position size, use trailing stops, monitor ETF flows
Market Context
Triangle maturity suggests imminent resolution
Volume expansion will confirm breakout direction
Watch for macro catalysts that could accelerate move
ETF decisions and regulatory news remain wildcards
Action Plan
Triangle has exhausted time – breakout window is NOW
Technical evidence strongly favors downside
Wait for clean break with volume confirmation
Prepare for potential cascade to three-digit prices
Stay disciplined – let the market prove the direction
