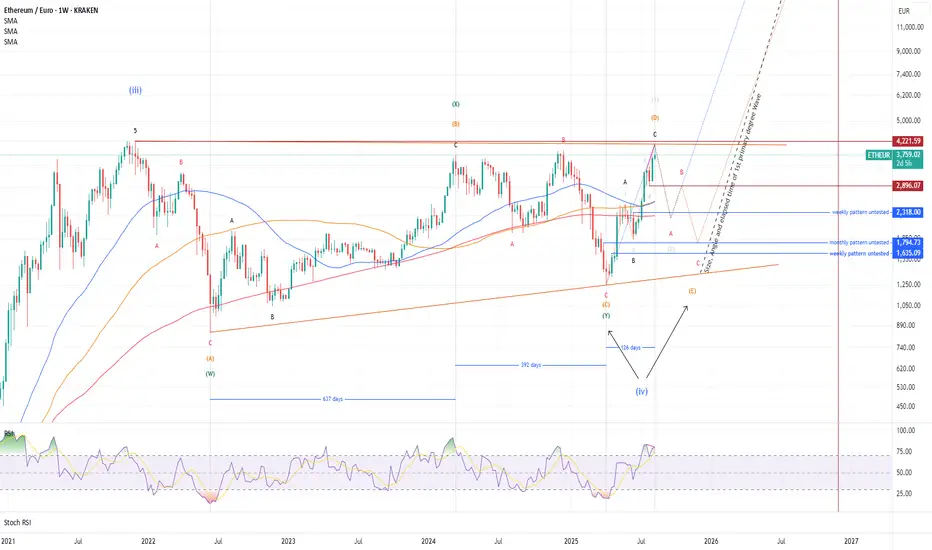
ETH - This will take time Part IIIEthereum has reached its predicted price target, indicating a likely retracement. RSI (7) divergence is present across all major time frames (monthly, weekly, and daily), reinforcing this outlook.
Two potential retracement scenarios are possible:
the blue line represents a shallow retracement, w
Related pairs
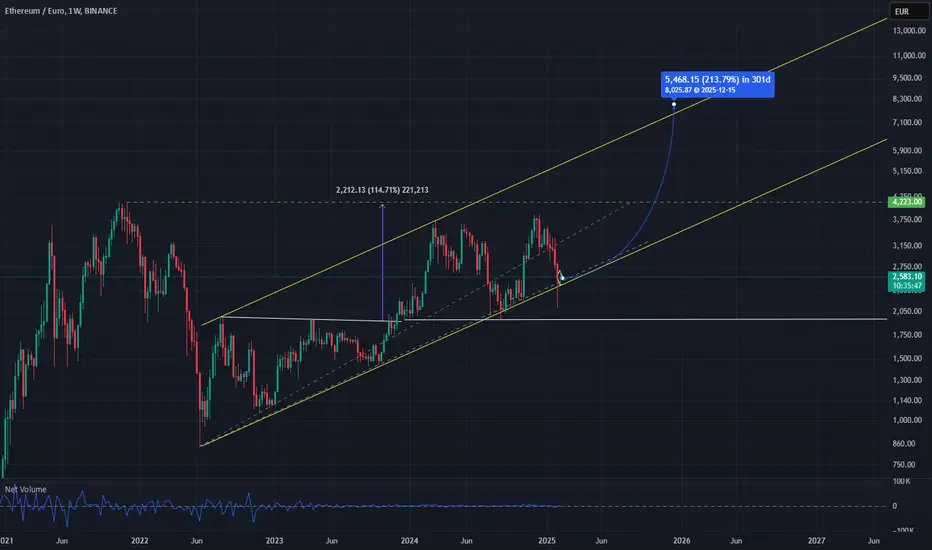
ETH to poised higher, a lot higher.We've been testing this resistance at 4-5k repeatedly for several years now. It now looks like we'll break out soon and then head toward 20k.

ETHEUR to €4,500 soon - 2 Possible Long SetupsTechnical Outlook: Elliott Wave Structure
On the daily timeframe, ETHEUR has clearly developed into a 5-wave impulsive structure according to Elliott Wave Theory:
1. Wave (1): Initiated after the breakout of the consolidation channel ranging from €1,925 area to €2,475 area, confirmed by a significa

ETH/EUR AnalysisI’m waiting for a 15–20% pullback from the recent highs before entering, with the plan to accumulate and hold long term.
On the 4H chart, ETH is currently trading below the Ichimoku cloud, showing short-term weakness and leaving room for a deeper correction.
Strategy: Patience for a better entry,

ETH - This will take time Part IIAs previously outlined, the fourth wave of the Primary degree in Ethereum (ETH) is forming a large triangle pattern, consistent with the corrective structure observed in XRP. This pattern is likely to extend over time, with the fifth wave of the Primary degree expected to begin around November or De

ETH Bullrun Parallel ChannelThe next weeks are absoult insane in my eyes, maybe we see a dip but i think 80% we see new ATH´s soon.
Everybody who think there are some big involments with the election and the bgi Trump ETH holdings (approx: ~50% or so of his portfolio) isn´t right, because himself bought often to a very bad p
ETH almost readyMA's are converging on the 4H chart.
Usually a (the) sign for a BIG move...
Send it!

Same Like SolanaThe chart looks identically to the SOL one. Therefor I don't write an additional text here. Interested people may look here:

Trade Signal for ETHEUR: SellDear Traders,
Our latest analysis indicates a SELL opportunity for the ETHEUR currency pair. This projection is based on our proprietary EASY Quantum Ai strategy, which meticulously analyzes market trends and data. Below are the specific parameters for this trade:
Direction: Sell
Enter Pr

ETH - This will take timeThe fourth wave of major degree, clearly forming a big triangle since its last all time high (wave 3 of major degree). Triangle c - wave should come to end between 1.900 and 1.850 fulfilling the monthly bearish pattern at 1.899.71 as well as testing the monthly bullish pattern at 1.853,60. I do not

See all ideas
Summarizing what the indicators are suggesting.
Oscillators
Neutral
SellBuy
Strong sellStrong buy
Strong sellSellNeutralBuyStrong buy
Oscillators
Neutral
SellBuy
Strong sellStrong buy
Strong sellSellNeutralBuyStrong buy
Summary
Neutral
SellBuy
Strong sellStrong buy
Strong sellSellNeutralBuyStrong buy
Summary
Neutral
SellBuy
Strong sellStrong buy
Strong sellSellNeutralBuyStrong buy
Summary
Neutral
SellBuy
Strong sellStrong buy
Strong sellSellNeutralBuyStrong buy
Moving Averages
Neutral
SellBuy
Strong sellStrong buy
Strong sellSellNeutralBuyStrong buy
Moving Averages
Neutral
SellBuy
Strong sellStrong buy
Strong sellSellNeutralBuyStrong buy
Displays a symbol's price movements over previous years to identify recurring trends.