ETHEUR to €4,500 soon - 2 Possible Long SetupsTechnical Outlook: Elliott Wave Structure
On the daily timeframe, ETHEUR has clearly developed into a 5-wave impulsive structure according to Elliott Wave Theory:
1. Wave (1): Initiated after the breakout of the consolidation channel ranging from €1,925 area to €2,475 area, confirmed by a significant Volume Delta spike, indicating strong institutional buying interest.
2. Wave (2): Standard corrective pullback, finding support above prior resistance at €2,900-€2,920 area, maintaining the bullish structure.
3. Wave (3): The strongest impulsive leg so far, extending sharply as expected for a Wave 3, with momentum and volume expansion up until €4,100 area.
4. Wave (4): A corrective phase, relatively shallow towards the €3,500 area, suggesting continued bullish strength and market confidence.
5. Wave (5) (in progress): Price action has already started its move higher, with the potential to retest and break the €4,500–4,520 area.
A sustained break above €4,100 will likely confirm Wave (5) continuation, targeting €4,500 as the 1st Fibonacci extension target of wave 4 and potentially higher levels if momentum carries through.
Fundamental Outlook: Fed’s Dovish Shift
Beyond the technicals, fundamentals are also aligning with Ethereum’s bullish scenario:
• Federal Reserve Policy: After political pressure from Trump, Fed Chair Jerome Powell recently signaled that the Fed will likely proceed with rate cuts as early as September.
• Market Impact: Lower interest rates generally reduce the attractiveness of yield-bearing assets and support risk-on sentiment, boosting equities and cryptocurrencies.
• Ethereum’s Role: With institutional adoption growing and ETH’s upcoming upgrades enhancing scalability, dovish Fed policy could act as a catalyst for renewed inflows.
Key Levels to Watch
• Immediate Resistance: €4,100
• Major Resistance: €4,520 (Wave 5 target zone)
• Support Levels: €3,360 and €2,470 in case of corrective retracements
Trade Setup 1
• Entry level: €3,600-€3,650 area at the retest of the correction channel of wave 4
• Stop Loss Level: €3,480 below wave's 4 lows
• Take Profit Level: €4,100 at previous highs
• A more conservative entry with a R:R of 2.92
Trade Setup 2
• Entry level: €4,050 at current market levels
• Stop Loss Level: €3,900 below wave's 4 recent lows
• Take Profit Level: €4,450-€4,500 at 1.618 Fib extension of wave 4
• A more aggressive entry with a R:R of 6.91
Conclusion
ETHEUR’s price structure on the daily chart supports the view that the pair is in Wave (5) of an impulsive Elliott cycle, with further upside potential toward €4,500+. Combined with supportive fundamentals from the Fed’s dovish policy stance, Ethereum is well-positioned to benefit from a macro tailwind into Q3–Q4.
Disclaimer
This analysis is provided for educational and informational purposes only and does not constitute financial advice, investment recommendation, or trading guidance. Always conduct your own research and consult with a licensed financial advisor before making investment decisions.
ETHEUR trade ideas

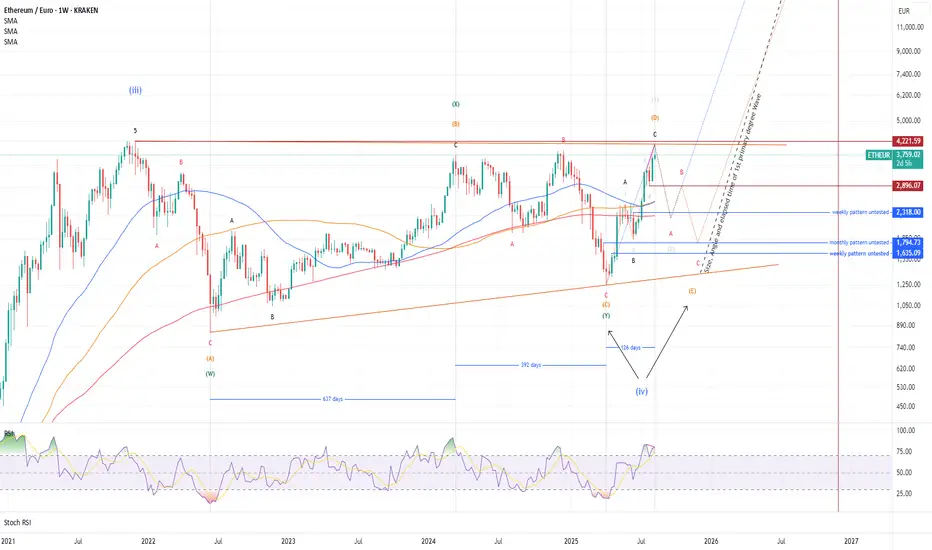
ETH - This will take time Part IIIEthereum has reached its predicted price target, indicating a likely retracement. RSI (7) divergence is present across all major time frames (monthly, weekly, and daily), reinforcing this outlook.
Two potential retracement scenarios are possible:
the blue line represents a shallow retracement, while the red line suggests a deeper pullback, potentially to €2.300. In a more bearish scenario, prices could decline further to the €1.800–€1.400 range.
A key question is whether the whole 4 year-correction reflects an Elliott Wave ABCDE triangle pattern or a WXY wave.
If the correction was a WXY wave, the first minor wave of the fifth wave (primary degree) may have begun at €1.255 on April 7, 2025, with the anticipated retracement representing the second minor wave.
Regardless of the wave structure, caution is advised. The next major cycle is expected to begin between October and December 2025 or January and February 2026, as outlined in my previous analysis, "ETH - This will take time Part II"
For now, it’s prudent to step back and monitor market developments.
ETH to poised higher, a lot higher.We've been testing this resistance at 4-5k repeatedly for several years now. It now looks like we'll break out soon and then head toward 20k.

ETH/EUR AnalysisI’m waiting for a 15–20% pullback from the recent highs before entering, with the plan to accumulate and hold long term.
On the 4H chart, ETH is currently trading below the Ichimoku cloud, showing short-term weakness and leaving room for a deeper correction.
Strategy: Patience for a better entry, then position for the long-term upside.

ETH - This will take time Part IIAs previously outlined, the fourth wave of the Primary degree in Ethereum (ETH) is forming a large triangle pattern, consistent with the corrective structure observed in XRP. This pattern is likely to extend over time, with the fifth wave of the Primary degree expected to begin around November or December 2025. A potential sharp breakout could occur starting in February 2026, signaling the start of a significant bullish move. If this breakout materializes, ETH could experience a substantial price increase, potentially exceeding current expectations, with a target significantly higher than anticipated.

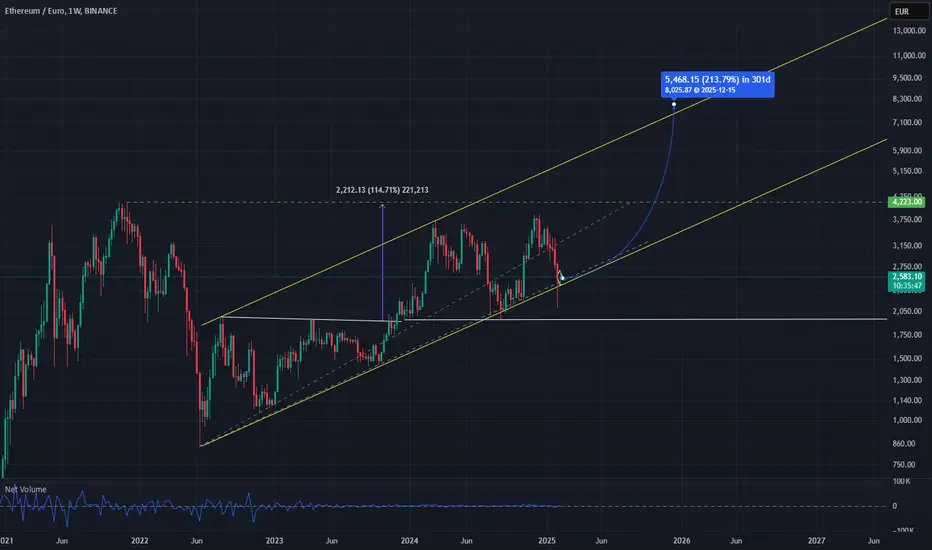
ETH Bullrun Parallel ChannelThe next weeks are absoult insane in my eyes, maybe we see a dip but i think 80% we see new ATH´s soon.
Everybody who think there are some big involments with the election and the bgi Trump ETH holdings (approx: ~50% or so of his portfolio) isn´t right, because himself bought often to a very bad price, so im sure normal CT.
I have had some lines that are respected but some i deleted for the clear view and some other for myself in the future to see how the volume respected these lines.
Well we will see if 8000€ is at the end of the year real but im sure there will be a lot of volume incoming in ETH too, if the OTC Bitcoin exchanges running out of liquidity and are empty so today there are approx 140.000 BTC that would be 2-3 Michael Saylor instant buys and then the absoult insane Blockchain algo will push the price so fast to new highs its impossible to imagine. The Bots are so programed that every limit order are get frontruned so the buyer can get in and for a small btc order for 10 Btc the prices get pushed 1-2% and now imagine big constitutionals want to enter the game with 1k-10k BTC without OTC. It would be a great time to stay in.
GM
ETH almost readyMA's are converging on the 4H chart.
Usually a (the) sign for a BIG move...
Send it!

Same Like SolanaThe chart looks identically to the SOL one. Therefor I don't write an additional text here. Interested people may look here:

Trade Signal for ETHEUR: SellDear Traders,
Our latest analysis indicates a SELL opportunity for the ETHEUR currency pair. This projection is based on our proprietary EASY Quantum Ai strategy, which meticulously analyzes market trends and data. Below are the specific parameters for this trade:
Direction: Sell
Enter Price: 3030.59
Take Profit: 2906.05333333
Stop Loss: 3187.26333333
Justification: Our AI-driven strategy suggests a bearish trend for ETHEUR in the short-term. Key indicators include recent momentum loss and a downward shift in market sentiment, which are aligned with Fibonacci retracement levels indicating resistance around the 3030 mark. Additionally, macroeconomic factors and current ETH performance against other major currencies support this outlook.
Please assess your risk tolerance as you consider this trading strategy. Remember, the market can be volatile, so take necessary precautions and stay informed on any emerging trends or news that may affect price movements.
Happy trading!
Disclaimer: This analysis is not financial advice. Please conduct your own research before making any investment decisions.

ETH - This will take timeThe fourth wave of major degree, clearly forming a big triangle since its last all time high (wave 3 of major degree). Triangle c - wave should come to end between 1.900 and 1.850 fulfilling the monthly bearish pattern at 1.899.71 as well as testing the monthly bullish pattern at 1.853,60. I do not expect to see a new ATH for this year.


ETHEUR Rainy SummerHi Traders!
so far so good ETHEUR
Now we seem to have a little problem though!!
we have a good resistance at about 1600..
if we keep it we will go up if not we will see lower numbers.
but in the long term we will see quite large numbers!!
huge caution with the SL AND TP
be very careful with Risk Management

My Approach to MEME TradingHi!
If you are even little bit interested in Crypto then you probably have noticed all the buzz and excitement around MEME token launch (especially in Crypto Twitter, now X). Looks like they are stealing all the spotlight with their upcoming Binance listing which should happen tomorrow( Nov 3rd). Company behind that token is Memeland, which was founded in June 2022 (same team who started 9GAG back in 2008). Memeland is an independent web3 venture studio.
They are really good at marketing and the way how they launched their marketing campaign could be a great case study about creative marketing.
But let’s rewind time back to the end of September and see how I approached to that event. And maybe more importantly why?
I knew Memeland project way before that – they have quite popular NFT collections. They belong into top 10 NFT projects. I also knew that at some point they will launch their token. At the end of September Memeland’s CEO confirmed in Twitter spaces that token will be launched in October. As I’m not new to Crypto, I knew that there are always a lot of delays with everything related to Crypto. This time my gut told me they are going to do it within that timeframe.
So it might be a good idea to buy their NFTs. Because holding those NFTs are basically only way to participate in token pre-sale and every NFT will get an airdrop of MEME tokens.
Information about NFTs:
• 25% of the total token supply will go to NFT holders.
• 20% unlocked at TGE (Token Generation Event)
• 80 % locked in NFTs with non-linear unlock
I bought some of their NFTs before marketing campaign and my entry timing was quite good. I’d say there was a window of opportunity. Since that value of those NFTs has increased significantly from my entry point and I have already participated in token pre-sale. By selling now I would be in instant profit but that’s not the plan. These NFTs will hold 80% of the tokens so it would be interesting to see the price action of these assets after 1st part of airdrop.
Why I decided to participate in MEME pre-sale?
So far I have never traded meme coins, it’s not my thing. On the other hand, I’m open-minded and ready for new challenges. This time I decided differently and here's some of the reasons:
1) Financial interest – As a trader I see an opportunity here. I think this token's launch will have a lot of buzz around it. People are tired of long bear market (2 years) where basically nothing happens. This event will create a lot of excitement for crypto community (and remind good old days to some Crypto OGs).
2) Timing – Crypto bear market, nothing happens, no excitement. Market sentiment is low (although it has been improving lately). On the other hand all eyes are on their token launch. Would like to see how this plays out, especially in current market cycle.
3) Token symbol MEME - can you think a better name for a meme coin.
4) Trading education – I’ll probably learn a lot about markets with this launch, no matter what’s the outcome.
Now let’s move to the trading plan
My thesis is that this token can have its momentum and will fly for some time. In other words, odds are good for price increase. Of course I could be wrong but that’s the way how I’m evaluating that event.
At launch I have:
• 20% of my NFT airdrop unlocked (80% locked)
• 25% of my pre-sale allocation unlocked (75% locked)
My plan is to liquidate all my unlocked tokens within first few weeks. If the price is going where I anticipate, it would be wise to lock in some profit. This doesn’t mean this token could not have its value in the future. MEME will play important role in their ecosystem.
My trading plan is simple 😊:
• Watch price action and make adjustments to my plan if necessary
• Scale-out from my position i.e. sell with blocks at different price levels
• Market cap - I have created a table with calculations of different prices and market caps so this will help me to set scale-out levels.
• Compare it with other popular meme coins
• Most recent example is PEPE
Thank you and don’t forget to enjoy your trading!
Cheers

ETH Holds the LineThe ETH/EURO Chart is holding at an interesting level
- 200 Week SMA holding
- POC holding also
An ascending triangle or cliff edge? What do you think?


Ethereum RidingHabibi , how are you Guyz ??
today a small scalp in Ethereum....comment your thought habibi
Win or Loose

ETHERIUM / EURO ANALYSIS (TRENDLINE'S)ETHEREUM / EURO has been moving from high to low making a downtrend and a bunch of candles made stronger support and resistance.
This analysis is made only by the TRENDLINE and SUPPORT AND RESISTANCE strategies only
This chart strategy just simply implies that it could go in 3 ways depending upon what the situation buyers and sellers may make. BINANCE:ETHEUR BINANCE:ETHEUR
The trendline would be again made if it goes sideways.
As soon as it breaks either Support or Resistance we could go either side respectively.

Bitcoin devil - COPY BOT / EUR base currency / ETH/EUR=== Time window ===
01 / 01 /2022 - 23 /11/2022
=== Example settings ===
Initial capital = 5000 EUR
Stop loss = 5%
Trailing percentage = average amplitude of weekly price movement
Arm Trailing = standard deviation of amplitude
sell based on strategy = Disabled
DCA = Disabled
Cool down = 1 Day
=== Base currency ===
EUR
=== Disclaimer ===
All strategies and templates presented by Bitcoin devil are created and optimized to aim at maximum profits. However, always preform your own research and risk assessment. Our backtest results are only meant to give an indication about the performance of the strategy. Past performance does not guarantee future results. Use our products at your own risk. Bitcoin devil is not a financial advisor and not responsible for any losses. Before purchasing any of our products or services please inform yourself with the Terms and Conditions on our website.

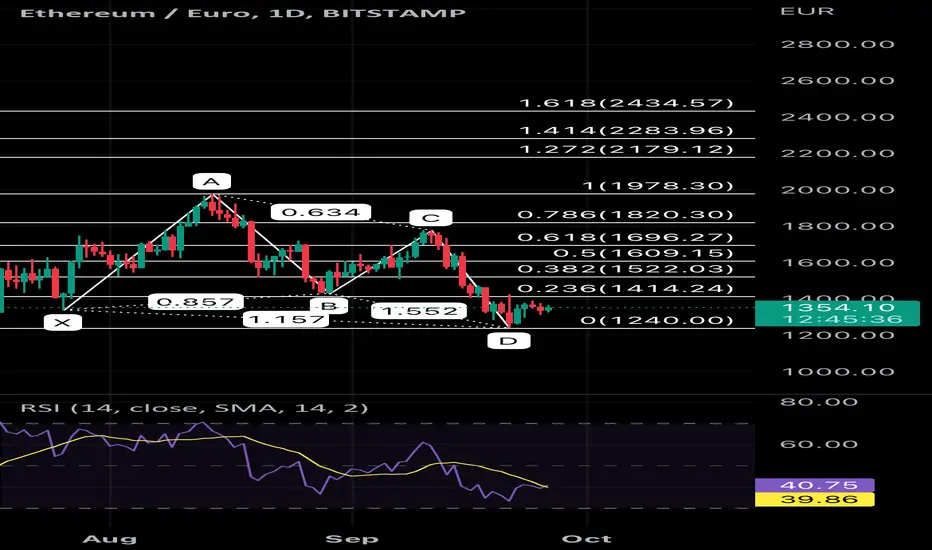
Daily ETHEUR analysisButterfly pattern is available on daily chart, Check the fibo levels for clear vision.
Short opportunity for ETH in the next few days? My thoughts on a possible short position for the next few days.

ETHEUR Idea H4Here is my view for ETHEUR on H4. The price could go down, you can put a pending order on the Order block or find an entry on LTF within OB Zone. Trade Safe!

clear crypto title describing blablabla idea Gosh, not brief nowproviding a detailed description and some clear crypto title describing blablabla idea Gosh, not brief now

Bullish over Ethereum Merge.Bad news is actually Good news. After every negative event there was a dump and pump.
ETH price outlook for The Ethereum Merge is looking bullish to me. 2700 is possible.
