Battle of Bulls and BearsWelcome everyone!
In my last chart, my target barely got hit because of the unexpected Bulls and Bears fighting.
Looks like this might be a retrace.
There is no guarantee pump as 4H and 6H look really bearish but for fun i placed this pump-zone.
Make sure to not panic sell or buy! Manipulators are doing strange things with crypto nowadays..
ETHEUR trade ideas

Target 27/04/2020Bots and bears are making it hard for us to pull through this resistance but we can all do it together and profit from it.

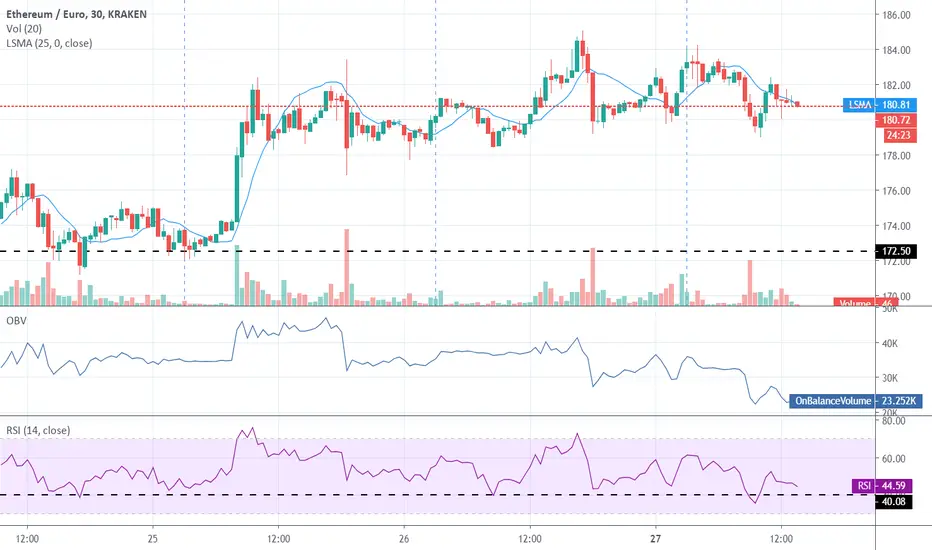
ETH/EUR short term resistanceRSI approached around 30's area first day since last week at 30m time frame but I 'm still long.

Bulltrap and Pump Time MondayWe didn't pump this weekend because most don't want to create a CME gap.
Monday a pump is expected.

ETHEUR - rising wedge and bearish divergenceETH chart shows formed rising wedge pattern as well as bearish divergence.
Rising wedge - While price is still rising, and we see higher high and higher lows, price gap between highs and lows is closing fast and volume amount has been decreasing over couple weeks indicating we are approaching decision point. Price has hit 180 EUR and is currently facing resistance at this level. Rising wedge is considered bearish signal expecting price to start falling soon.
Bearish divergence - While price has been rising for couple weeks, all 3 indicators DMI, RSI and MACD show decreasing power of the trend and expectation of price to start falling as well.


[ETH] - So far, not bad.I was about to publish my ETH idea the other day (red line) although I regretted it and decided to wait to see how the price development happened. Today three days later we can verify that the price, more or less, remains stable within the ascending channel drawn.
What to expect next? Buff, so weekend is ahead and we are also giving way to the last week of April, with a lot of relevant dates in the economic calendar, apart from the fact that not very optimistic data regarding transport or employment in global terms are also accumulating, which we will soon see its effects on the price of ETH and all crypto in general.
Perhaps another new correction for speculation and fear of what this new system brings us and the human need to continue treating fiat money with the zero importance that it has. If not another new wave of adoption will come soon, in a reasonable interval of time of 2 years, apparently there is still a way to go in the development of the system but it is already latent and at these prices we must take advantage.
This idea revolves around the ascending channel, a drawing that in this 4-hour view is not appreciated, although in a larger one it has a steeper inclination. Just an idea, thanks!

Saved by Uncle Sam once more!We are still on track from our 13/03 bull-run
Even though we're in a global pandemic, the 2 stimulus packs caused a big flow of USDT which seems to keep everything on track.
Here is a snapshot of the last stimulus package which seems to act the same as the previous by creating a new stronger uptrend.
We might even get a new high if this keeps going like this!

Ethereum €180 Next TargetHello everyone
It seems my buy signal turned into a nice pump. I hope you did indeed buy at that point.
If you have not entered yet, make sure to watch the price action. if it drops below €165, you can expect an even lower price to rebuy.
As for now, i don't think we will go down but stablise and stay sideways. At some point we will break the small resistance that's currently at about €171.
I can guarantee it will pump through that and maybe this week or next week, we will be at €180.
Make sure to never listen to any people that say price will go down. They say this only to hope that people will follow their advice and sell so they can buy at a lower point. This giving someone else a loss in profit. Most of the time these are trolls. People should only be bullish right now and you can see why if you look at the weekly chart. Make sure to buy in on time because you don't want to miss the next pump.
Please DM me for any questions.

Target €180 Still Intact. A lot of people have no knowledge and just say up and down but that's not how it works. Remember what i said.. Never listen to anyone but look at the chart and make your own descision.
We are slowly stabilizing for the next pump. Sitting most of the time in the €166 - €168 area for now. Next target is still €180 but as for now, we still need to break through €175 first.
Don't let volatility on smaller timescales cause you to panic sell. Always look at the 4 hour chart. If a pump is happening, you could look at the 30 minute and 1 hour chart.
Stay Safe and happy trading!


I'm not a trader or anything i'm just having some fun This is not an idea, this is a random thought, based on nothing except imagination. I'm just having fun like I said. I wouldn't be able to do any analysis anyway, I don't have the knowledge. I'm just playing with time and universe.
Have a nice day.


ETH/EUR GROWING?ETH | EUR has long been silent and is starting to grow slowly?
What is your opinion?

[ETH] Depending this week...And watching if it's capable of break that big VMA or not.
What are your thoughts? Up or down? Not sure here at all. But I'd be a nice start of something, changes are changes.
Bless!


long for etherumA repeatable pattern that possibly pushes the price at higher levels. Moreover, the exponential moving average of 20 days is positive with a view to cross up the 50 days EMA.
