Bitcoin & Ethereum New Quarter | What To Look For🎯 New Quarter For COINBASE:BTCUSD & COINBASE:ETHUSD — What To Look For
As we enter a new quarter, smart money is already positioning.
Institutional investors, hedge funds, and asset managers don’t just trade price — they rotate capital based on quarterly performance, risk appetite, and macro

ETHEREUM Perhaps the easiest long out there.Ethereum (ETHUSD) is consolidating just above the Buy Zone of the Mayer Multiple Bands (MMBs) where it rebounded on its April bottom.
Throughout its historic price action, every time it hit this Zone and rebounded, it reached at least the bottom of its Mean MM zone (red Zone).
As a result, $4000 t

(ETH/USD) Bullish Setup: Entry at $2,422 with Target at $2,521 a1. Entry Point: ~2,422.2
This is the suggested buy area based on a recent bounce from the support zone
2. Support Zone (Purple Box):
Bottom boundary: ~2,392.4
Top boundary: ~2,408.4
Price has bounced multiple times here, showing strong buying interest.
3. Resistance Point: ~2,463.9
A clear horizont

ETH/USD (Ethereum to US Dollar) on the 1-hour timeframe. ETH/USD (Ethereum to US Dollar) on the 1-hour timeframe.
Here’s a quick breakdown of what’s visible:
There is an Ichimoku Cloud indicator on the chart.
A resistance zone is marked at the top (around $2,540 – $2,550).
A support zone appears around $2,440 – $2,460.
There's a bullish arrow point

IS Ethereum AWAITING A MAJOR CRASH? CRASH TO USD 660 ? THE GREAT EARTHQUAKE OF THE CRYPTO WORLD IS COMING, WINTER IS COMING, JUNE 28, 2025... THE BIG SHORT !
Technical analysis of Ethereum, which is introduced as the silver of the crypto world, shows that a serious crash infrastructure has formed.
1. The most important technical data is the formatio

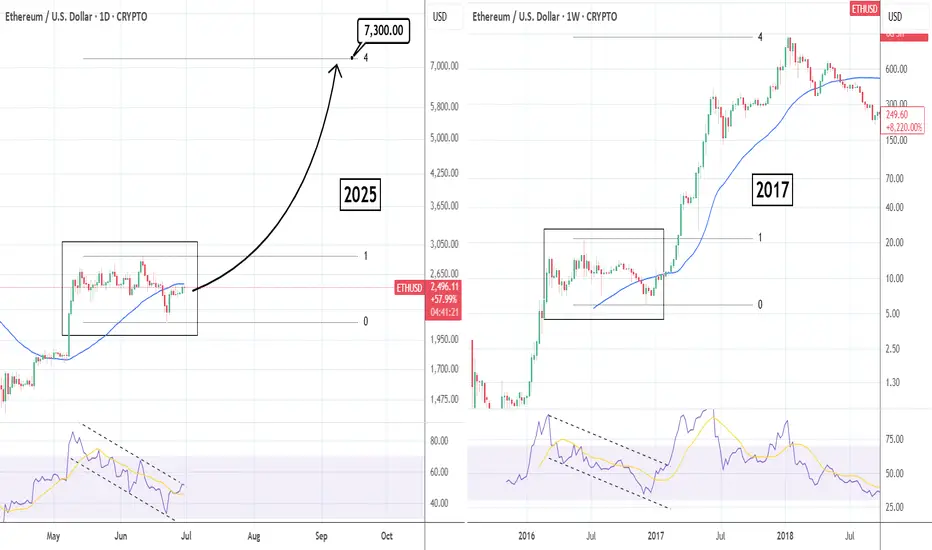
ETHUSD: Parabolic rally similar to 2017 targets $7,300Ethereum is neutral on its 1D technical outlook (RSI = 50.960, MACD = -24.810, ADX = 18.527), attempting to break over the 1D MA50, while still being inside a 6 week consolidation. This is no different than the 2016 consolidation on the 1W chart, that turned out to be just an accumulation pattern be
ETH/USD BUY SETUP 1-HOUR Based on the chart we provided (ETH/USD 1H from TradingView), here’s a technical analysis for potential Take Profit (TP) and Stop Loss (SL) levels:
🟢 Buy Setup Analysis (From the yellow demand/support zone)
Entry Zone:
Around $2,556 – $2,563 (current price zone and consolidation before projected

Ethereum - This structure decides everything!Ethereum - CRYPTO:ETHUSD - trades at a key structure:
(click chart above to see the in depth analysis👆🏻)
After Ethereum retested the previous all time high in the end of 2024, we saw quite a harsh move lower. This move was followed by an expected recovery, however Ethereum is still trading bel

Ethereum monthly cup and handleSoooo, this is my first post, and I'm not really too sure if I'm seeing this correctly, can somebody please explain to me why I'm wrong or if I'm right. Cuzzzzz this seems extremely bullish to me.
This is on the monthly timeframe, so this projection is for closer to November - February, IMO...
A

All Time Schiff Pitchfork: ETH to $26k this cycleEthereum’s All-Time Schiff Pitchfork Points to $26,000 Top This Cycle
What if I told you Ethereum’s long-term trajectory already contains the roadmap to its next parabolic peak—and it's hiding in plain sight?
By applying an all-time Schiff Pitchfork to ETH’s historical price action, we uncover a ch

See all ideas
Summarizing what the indicators are suggesting.
Oscillators
Neutral
SellBuy
Strong sellStrong buy
Strong sellSellNeutralBuyStrong buy
Oscillators
Neutral
SellBuy
Strong sellStrong buy
Strong sellSellNeutralBuyStrong buy
Summary
Neutral
SellBuy
Strong sellStrong buy
Strong sellSellNeutralBuyStrong buy
Summary
Neutral
SellBuy
Strong sellStrong buy
Strong sellSellNeutralBuyStrong buy
Summary
Neutral
SellBuy
Strong sellStrong buy
Strong sellSellNeutralBuyStrong buy
Moving Averages
Neutral
SellBuy
Strong sellStrong buy
Strong sellSellNeutralBuyStrong buy
Moving Averages
Neutral
SellBuy
Strong sellStrong buy
Strong sellSellNeutralBuyStrong buy
Displays a symbol's price movements over previous years to identify recurring trends.
Curated watchlists where ETHUSD.P is featured.

Gen 2: Crypto is here to stay - and it's brought some friends…
19 No. of Symbols

Proof of Work: Embracing the crunch
27 No. of Symbols

Smart contracts: Make the smart decision
36 No. of Symbols

Staking Coins: Pick up a stake
18 No. of Symbols

Top altcoins: Choose your alternatives carefully
28 No. of Symbols
See all sparks