ETH BUY?Market Overview:
The overall trend remains bullish on both the daily and weekly timeframes.
Daily Outlook:
On the Daily timeframe, the market appears to be forming a potential reversal pattern, indicating a possible continuation of the broader bullish move. Should the current support level hold, we could see buyers gaining momentum and pushing prices higher.
Disclaimer:
Please be advised that the information presented on TradingView is solely intended for educational and informational purposes only.The analysis provided is based on my own view of the market. Please be reminded that you are solely responsible for the trading decisions on your account.
High-Risk Warning
Trading in foreign exchange on margin entails high risk and is not suitable for all investors. Past performance does not guarantee future results. In this case, the high degree of leverage can act both against you and in your favor
Market insights

$ETH Bottom Vibes: Strong Bullish Div on the DailyCRYPTOCAP:ETH is giving potential bottom signs. While the next seemingly bearish-minded zone of liquidity is between 2500-2700. However, I disagree. There is a sneaky zone of accumulation that CRYPTOCAP:ETH bulls and bears battle between 2800-3100. See the tan colored box on my chart.
Next, you can see a Strong Bullish Divergence on the daily chart for CRYPTOCAP:ETH with the RSI.
Last, there is a subtle, yet technically significant Falling Wedge Pattern forming up on the chart of $ETH. Meanwhile the fear is nearly at an all time high and the market awaits NVDA and AI performance. Earnings came in in the GREEN.
I typically try to think different than the "crowd think". So if the bottom is here it would front run so many people who want to purchase ETH in the 2500-2700 range. Makes sense to me.
The sentiment checks out for bottom vibes (like the CMC Greed and Fear Index at a 15 yesterday) combined with 1 very strong technical indicator (strong bullish divergence on the 1 Day chart) right in the middle of a sneaky zone of accumulation.
Let's see. NFA

ETH PERPETUAL TRADE BUY SETUP Long from $2880ETH PERPETUAL TRADE
BUY SETUP
Long from $2880
Currently $2880
Targeting $2980 or Above
(Trading plan IF ETH
go down to $2830 will add more longs)
Follow the notes for updates
In the event of an early exit,
this analysis will be updated.
Its not a Financial advice

ETHEREUM Thoughts - Potential Bottom front running the majority CRYPTOCAP:ETH has experienced a blood bath this month but I believe a potential bottom could be forming here. It really relies on several factors:
- CRYPTOCAP:BTC
- NASDAQ:NVDA
- Market wide sentiment
However, through technical analysis and hours of staring at this chart the past few weeks, I am spotting some interesting signs of life for a true bounce. I detail those in my video.
Spoiler Alert: Looks like a STRONG BULLISH DIVERGENCE is forming on the CRYPTOCAP:ETH daily chart - lets pay attention and see if the NASDAQ:NVDA earnings affect the price like I think it may...

ETH Long - Golden Pocket BITSTAMP:ETHUSD is very oversold and showing signs of a short squeeze building on the 4 hour chart. Almost all long liquidity was wiped around 2920 area ($1.3BB on hyper liquid) and there is currently a large cluster of short liquidations around $3120, so it should start to head that direction and cascade up from there until we reach the golden pocket.
There are plenty of macro headwinds, including NASDAQ:NVDA earnings after the bell today that could easily compromise this outlook in the short-term but I believe we will push higher from here. Even if we wick lower in the short-term, I believe that it's close enough to a bottom to enter here with a stop below LOD and some put options to hedge.

Why my ETH Holding has grownIn my last ETH update when the price was at $1700 and it looked as if the world was crashing, I mentioned I thought ETH was going to set a new ATH and so far it did but not at the price area I was expecting. I also did mention that I expected a return to around $3000 which is close to where it currently is.
All that said, I have had more time to look at the ETH chart and I think I may have been less bullish than I should have and as a result I grew my ETH holding since then. A few things I would like to point out.
One of which I mentioned in my last update. Looking at the ETH chart, it looks too similar to the gold chart with the ABC shakeout that gold went into before the massive rally.
Imagine holding GLD from Aug 2023 and selling in Oct 2023 because you could no longer handle the pain at this point below?
Now imagine those that held during this time, the fear and uncertainty they would have gone through. Personally, I think that is what the bookmakers are doing to ETH holders. If you believe the narrative that every asset will be tokenized and it ETH is the most trusted, then it makes sense to shake as many people out as possible before the GLD like rally.
Secondly, (although its a toss up) the action ETH is displaying now is similar to that of 2018 to 2020 and that we are in Sep-Oct of 2020 as you can see from the main chart and below as well.
Finally, the one bearish scenario is that we are doing the gold option but that we fail like this stock (PSNL) once we go and set a new ATM from here.
I had noticed the-same gold pattern and traded it but luckily I sold just before the failed breakout (so far) and you can clearly see the ABC pattern exactly like GLD before the breakout.
This is not a financial advice and I am not asking you to buy ETH. Just my opinion.
Please like, share and leave a comment.

ETHUSDNote that these analyzes are only for recording personal accounts and journals that will be reviewed in the future.
Please do not enter into any trade just by viewing the analysis, thank you.

ETH going to fill the gapETH is filling the imbalance left, while BTC is in the POI. this could be a reversal point to switch back up

EthereumETHUSD
- Completed " 12345 " Impulsive Waves
- Consolidation Phase as an corrective pattern in Short Time Frame
- Break of Structure
- RSI - Divergence
- Change of Characteristics

ETHUSD | 1-Hour Bullish Continuation Concepts: ICT | SMC | Bill Williams | RR > 2:1
ETH is setting up for a significant bullish move on the 1-hour chart. After a clear sweep of sell-side liquidity, price has shown strong displacement and is now coiling above a key support confluence, suggesting a continuation toward the range high is likely.
ICT & SMC Analysis:
Liquidity Sweep & FVG: The wick down to $3,069.1 constituted a clear sweep of sell-side liquidity. The powerful bullish candle that followed created a significant Fair Value Gap (FVG) and a Bullish Order Block.
Market Structure Shift (MSS): The break above the recent swing high at $3,090.9 confirmed a shift from a ranging/downward structure to a bullish one.
Mitigation & Retest: The current pullback is retesting the confluence of the FVG, the Order Block, and the Alligator, offering a high-probability long entry.
Bill Williams’ Alligator Confirmation:
The Alligator on the 1-hour frame confirms the bullish bias:
Lips (3,078.4) > Teeth (3,079.5) > Jaw (3,079.8)
The alignment is bullish, and price holding above the Lips indicates the trend is awake and active. We are looking for the next impulsive leg to begin from this support.
Trade Plan (1-Hour Setup):
🟩 Entry Zone: $3,077 - $3,082 (Confluence of FVG, Order Block, and Alligator support)
🔴 Stop Loss: $3,068 (Below the recent liquidity sweep low)
🎯 Take Profit: $3,258 (Major previous high and a key liquidity pool on the 1H/4H chart)

“Ethereum Support Retest & Bullish Reversal Setup”Ethereum is retesting the key support zone after a bearish move, holding above the trendline. If the support holds, price may bounce toward the next target at 3,150, following the projected upward move. BOS levels and trendline interactions highlight potential bullish continuation.

#ETH/USDT : Rebound Setup from ascending channel Support#ETH
The price is moving within an ascending channel on the 1-hour timeframe and is adhering to it well. It is poised to break out strongly and retest the channel.
We have a downtrend line on the RSI indicator that is about to break and retest, which supports the upward move.
There is a key support zone in green at the 2930 price level, representing a strong support point.
We have a trend to stabilize above the 100-period moving average.
Entry price: 3064
First target: 3100
Second target: 3168
Third target: 3260
Don't forget a simple money management rule:
Place your stop-loss order below the green support zone.
Once you reach the first target, save some money and then change your stop-loss order to an entry order.
For any questions, please leave a comment.
Thank you.

Ethereum Accumulates Below Key ResistanceFenzoFx—Ethereum remains bearish, trading near $3,078.00. Price is below $3,170.00, with a bearish fair value gap overhead and resistance at $3,371.00. Technical indicators show an oversold market with bullish divergence, and candlestick patterns suggest accumulation around this zone.
Despite the bearish setup, a short-term rise may occur to grab liquidity before the downtrend resumes. In this case, Ethereum could target the bearish gap and resistance at $3,371.00.

ETH: Might have another chance to long!Hello Traders .
okay, this was the volume profile of ETH of the Binance! Any reaction to it could activate our buy option!

Don't sell your Ethereum !!!CRYPTO:ETHUSD
Based on my analysis of the historical context and the global macro-economy, I believe there is still room for growth. This is particularly true with the upcoming interest rate decision meeting on December 10th, which is anticipated to potentially bring a positive surprise. Furthermore, the end of the government shutdown, which had previously clouded the outcomes, adds to this outlook.
Personally, I see a spark of hope, and this is corroborated by my technical analysis using Elliott Waves. As you can see in the chart analysis, it suggests we still need one final, fifth impulsive wave before a bear market begins.
This is not financial advice, just my personal opinion.

ETH 4H – Potential Major Accumulation FormingWith recent price action, I am seeing what maybe an accumulation happening on the 4 hour chart, flipping my original bias from redistribution. Price is just above a major Preliminary Support level at $2450 and has been forming a large descending channel/wedge. The most recent down swing responded with a sharp wick, which aligns with the Selling Climax. Price then had an Automatic Reaction and since then has returned with a Secondary Test.
If this is correct, we may be entering Phase B of accumulation, where we can see an Upthrust move before absorption of seller continues below.
Why This Looks Like Accumulation
The market is still making lower lows in price, but the internal strength is not confirming those lows. This is typical behavior in Accumulation Phase B/C, where supply exhausts while price drifts downward.
Key supporting signals:
1. Delta Behavior
Recent down-legs have shown declining sell delta, meaning sellers are pushing price lower but with noticeably less aggression. This weakening of effort vs. result is a classic precursor to a terminal action such as a Spring or major ST.
2. Dual RSI Divergences
The RSI indicator here is split into two components:
• Purple = Relative Strength of Price
• Teal = Relative Strength of Volume
Across the most recent lows:
• Price made lower lows
• RSI-price made slightly higher highs and higher lows
• RSI-volume showed a mixed but rising structure, making both higher highs and higher lows on the internal swings
This is important because it shows momentum decoupling from price. When both price-strength and volume-strength diverge upward while price drifts downward, it often signals that the market is absorbing supply rather than breaking down structurally.
3. Volume Tapering
Each push lower has occurred on gradually diminishing volume, and even the bearish expansions lack the signature spike you typically see in distribution breaks. This behavior aligns with absorption, not aggressive continuation.

Bearish continuation for ETHEREUMRetracement from new lows
Retest of the head and shoulders neckline
New lows incoming in the next weeks

$ETH Trendline Hold + Higher Low – Ethereum Bull Run Reloaded!COINBASE:ETHUSD CRYPTOCAP:ETH Trendline Hold + Higher Low – Ethereum Bull Run Reloaded! 🚀
Altcoin Pioneers! 🔥 ETH just tagged the multi-year ascending trendline at ~$3,141 (the same line that perfectly caught every major low since 2022) and instantly bounced with a strong weekly green candle. Higher low officially confirmed!
- Trendline defended for the 6th time ✅
- With BTC.D crashing, ETH.D bottoming & falling wedge breakout on BTC, all stars are aligning for Ethereum to lead the next leg
- Close above $3,800 flips weekly structure → targets $5,000 → $7,000 → $10k+ in 2026
RSI resetting from oversold, volume building. This is the exact setup that launched ETH from $1,800 → $4,800 last cycle. Ethereum season is loading FAST! 🧪💥
#Ethereum #ETHBull #AltseasonLeader

$ETH Macro planI made this CRYPTOCAP:ETH cheatsheet. I'm looking to bid 2900-2700 area. As you can see we lost the level on weekly timeframe. And retesting it this week. A close below means we will likely go to my marked area.

ETHUSD bearish continuation below 3,508 resistanceThe ETHUSD pair continues to display a bearish outlook, in line with the prevailing downward trend. Recent price action suggests a corrective pullback, potentially setting up for another move lower if resistance holds.
Key Level: 3,508
This zone, previously a consolidation area, now acts as a significant resistance level.
A failed test and rejection at 3,508 would likely resume the bearish momentum.
Downside targets include:
2,878 – Initial support
2,784 – Intermediate support
2,700 – Longer-term support level
Bullish Scenario (breakout above 3,508):
A confirmed breakout and daily close above 3,508 would invalidate the bearish setup.
In that case, potential upside resistance levels are:
3,590 – First resistance
3,665 – Further upside target
Conclusion
ETHUSD remains under bearish pressure, with the 3,508 level acting as a key inflection point. As long as price remains below this level, the bias favours further downside. Traders should watch for price confirmation around that level to assess the next move.
This communication is for informational purposes only and should not be viewed as any form of recommendation as to a particular course of action or as investment advice. It is not intended as an offer or solicitation for the purchase or sale of any financial instrument or as an official confirmation of any transaction. Opinions, estimates and assumptions expressed herein are made as of the date of this communication and are subject to change without notice. This communication has been prepared based upon information, including market prices, data and other information, believed to be reliable; however, Trade Nation does not warrant its completeness or accuracy. All market prices and market data contained in or attached to this communication are indicative and subject to change without notice.

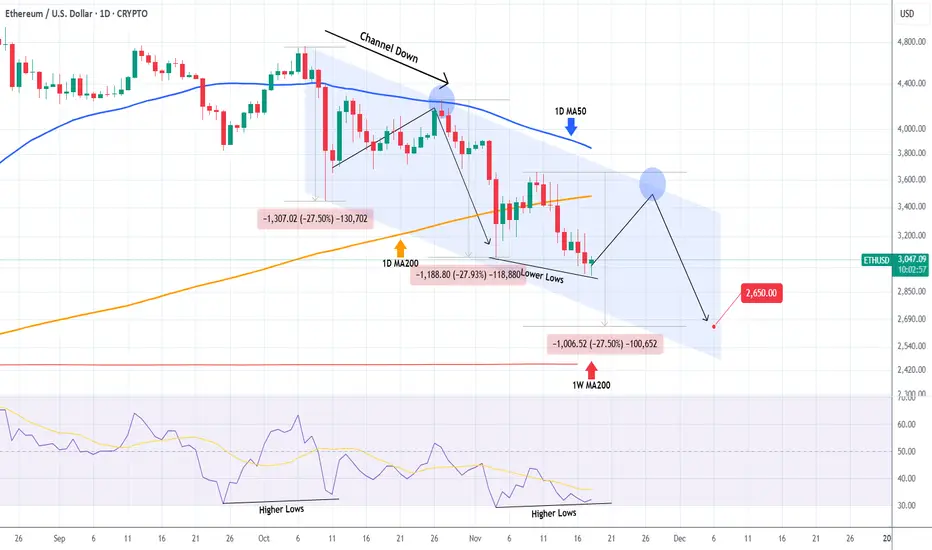
ETHEREUM Dead cat bounce incoming?Ethereum (ETHUSD) has been trading within a Channel Down since the October 07 High with both its Bearish Leg so far declining by -27.50% each.
As the 1D RSI is forming Higher Lows against the price's Lower Lows, i.e. a Bullish Divergence similar to October 11, it is possible to see a short-term bounce to test the 1D MA50 (blue trend-line) again (where the price got rejected on October 27), before it completes the -27.50% Bearish Leg projection.
The medium-term Target remains 2650.
---
** Please LIKE 👍, FOLLOW ✅, SHARE 🙌 and COMMENT ✍ if you enjoy this idea! Also share your ideas and charts in the comments section below! This is best way to keep it relevant, support us, keep the content here free and allow the idea to reach as many people as possible. **
---
💸💸💸💸💸💸
👇 👇 👇 👇 👇 👇
ETH/USD — Bearish Breakdown Toward 2,500 Ethereum extended its decline last week and broke below 3,125 (Murray ), updating the July low with a drop to 2,950. The market remains dominated by risk-off sentiment as the Fed signals the possibility of pausing rate cuts in December, geopolitical tension increases, and uncertainty around AI-driven tech investments grows.
The Fear & Greed Index sits at 11 (extreme fear), while ETF outflows intensified:
• ETH ETFs: –$1.4B (≈7% of AUM)
• BTC ETFs: –4%
On-chain activity also confirms weakening demand: ETH deposits fell 13% to a four-month low, and weekly DEX volume declined 27% to $17.4B.
The fundamental backdrop continues to favor the bears.
⸻
Technical Setup
ETH/USD broke below its descending channel and consolidated under 3,125, opening a clear path to deeper downside targets:
Bearish Structure
• Price trades below the mid-Bollinger band
• Bollinger Bands point downward
• MACD expands in the negative zone
• Stochastic remains flat inside oversold conditions
Unless ETH reclaims 3,750, the trend remains decisively bearish.
⸻
Key Levels
Resistance: 3,750 · 4,375 · 5,000
Support: 3,125 · 2,500 · 2,187
⸻
Trading Plan
🔻 Primary Scenario — SELL STOP
• Entry: 2,960
• TP1: 2,500
• TP2: 2,187
• SL: 3,300
• Bias: bearish continuation
• Timeframe: Weekly (5–7 days)
🔼 Alternative Scenario — BUY STOP
• Entry: 3,770
• TP1: 4,375
• TP2: 5,000
• SL: 3,360
• Bias: reversal only above 3,750
⸻
ETH remains in a strong downtrend after losing the 3,125 support zone. A move below 2,960 confirms continuation toward 2,500 → 2,187, while only a breakout above 3,750 would signal a potential trend reversal.

don't do (m)$ETH!IMO we are heading for the first neckline, as seen on the chart.
If it doesn't bounce there.. next neck line down below, and so on.
NFA, DYOR, for entertainment purposes only 🙄
