Quicksilver Master Terminal Overview
The Quicksilver Master Terminal is a comprehensive data visualization interface designed to bring institutional-grade market awareness to the retail chart. It replaces the need for multiple cluttered indicators by consolidating Trend, Momentum, Volatility, and Structure into a single Heads-Up Display (HUD).
Designed by Quicksilver Algo Systems, this tool is engineered for precision scalpers and prop firm traders who require instant situational awareness without switching timeframes.
Features
1. The Institutional HUD (Heads-Up Display)
Located in the top-right corner, this live dashboard provides real-time metrics on:
Market Structure: Instantly identifies if the asset is in a Bullish or Bearish regime relative to the 200 EMA.
Momentum Status: Tracks overbought/oversold conditions using smoothed Stochastic logic.
Volatility (ATR): Displays live Average True Range data for precise Stop Loss placement.
Volume Flow: Detects institutional volume spikes (1.5x average).
2. The Trend Cloud
A dynamic visual ribbon that fills the space between the Fast EMA (50) and Slow EMA (200).
Green Cloud: Strong Bullish Trend (Look for Longs).
Red Cloud: Strong Bearish Trend (Look for Shorts).
Cross: Visual warning of trend reversals.
3. Sniper Signal Logic
The script paints "INSTITUTIONAL BUY" and "INSTITUTIONAL SELL" labels only when high-probability confluence occurs:
Exhaustion: Stochastic RSI breaches extreme levels (<20 or >80).
Confirmation: Price action aligns with Heikin Ashi smoothing to filter noise.
Momentum: Fast %K crosses Slow %D.
How to Use
For Scalping (1m - 5m): Wait for the Trend Cloud to align with the Signal. Take "BUY" signals only when the Cloud is Green.
For Risk Management: Use the live "Volatility" number in the HUD to set your Stop Loss (e.g., 1.5x the current Volatility value).
About the Developer
This script is part of the Quicksilver Ecosystem. We build algorithmic solutions focused on capital preservation and risk management for funded traders.
Disclaimer: This tool is for educational market analysis only. Past performance is not indicative of future results.
Trade ideas
Ethereum Set for a Rally: Can It Break Key Resistance?Ethereum (ETH/USD) – 1-Day Chart
Current Market Structure:
Ethereum is in a clear ascending channel with higher lows and higher highs, indicating a potential bullish trend. The price is currently consolidating within this channel and preparing for a potential breakout to the upside.
Key Levels:
Support Zone: $2,633.61 - The price has consistently bounced off this zone, showing strength.
Resistance Zones: $4,716.90
Take Profit 1: $3,612.44
Take Profit 2: $4,188.23
Take Profit 3: $4,716.90
Most Probable Scenarios:
1. Bounce from Support: Ethereum is likely to continue its upward movement, testing the first take-profit target at $3,612.44.
2. Consolidation: Price may continue to consolidate within the channel before making a final move higher.
3. Breakout to the Upside: If Ethereum successfully breaks above the upper boundary of the channel, a move toward the next resistance levels (Take Profit 2 and Take Profit 3) is expected.
Actionable Advice:
Buy near the lower boundary of the channel, aiming for Take Profit 1 at $3,612.44.
Hold if price reaches the higher resistance levels ($4,188.23 and $4,716.90).
Risk Management:
Place stop-loss orders below the support zone around $2,633.61 to protect against unexpected price action.

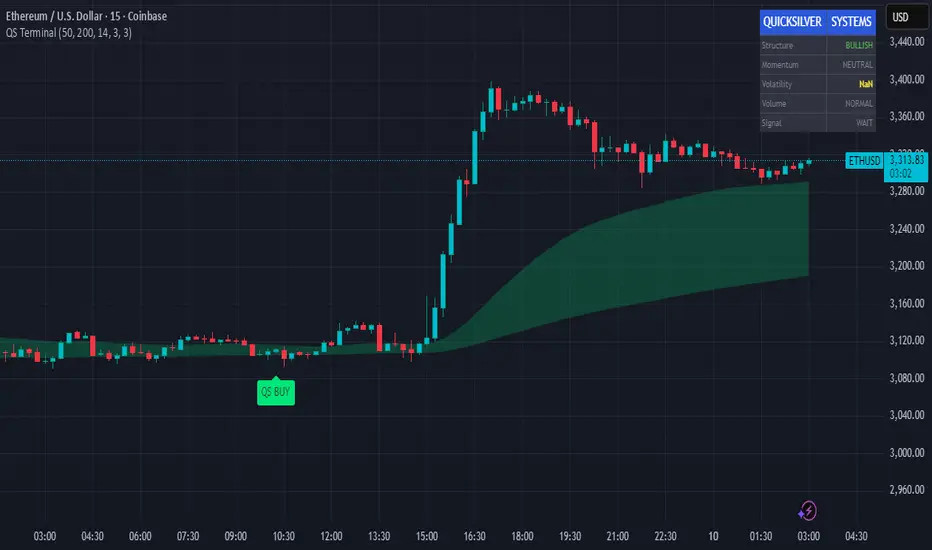
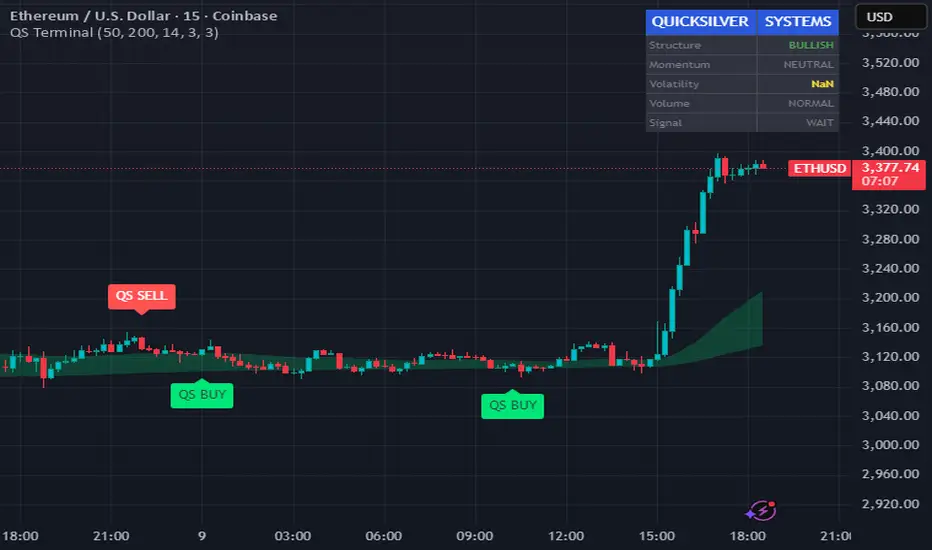
Quicksilver Master Terminal (15min)Overview
The Quicksilver Master Terminal is a comprehensive data visualization interface designed to bring institutional-grade market awareness to the retail chart. It replaces the need for multiple cluttered indicators by consolidating Trend, Momentum, Volatility, and Structure into a single Heads-Up Display (HUD).
Designed by Quicksilver Algo Systems, this tool is engineered for precision scalpers and prop firm traders who require instant situational awareness without switching timeframes.
Features
1. The Institutional HUD (Heads-Up Display)
Located in the top-right corner, this live dashboard provides real-time metrics on:
Market Structure: Instantly identifies if the asset is in a Bullish or Bearish regime relative to the 200 EMA.
Momentum Status: Tracks overbought/oversold conditions using smoothed Stochastic logic.
Volatility (ATR): Displays live Average True Range data for precise Stop Loss placement.
Volume Flow: Detects institutional volume spikes (1.5x average).
2. The Trend Cloud
A dynamic visual ribbon that fills the space between the Fast EMA (50) and Slow EMA (200).
Green Cloud: Strong Bullish Trend (Look for Longs).
Red Cloud: Strong Bearish Trend (Look for Shorts).
Cross: Visual warning of trend reversals.
3. Sniper Signal Logic
The script paints "INSTITUTIONAL BUY" and "INSTITUTIONAL SELL" labels only when high-probability confluence occurs:
Exhaustion: Stochastic RSI breaches extreme levels (<20 or >80).
Confirmation: Price action aligns with Heikin Ashi smoothing to filter noise.
Momentum: Fast %K crosses Slow %D.
How to Use
For Scalping (1m - 5m): Wait for the Trend Cloud to align with the Signal. Take "BUY" signals only when the Cloud is Green.
For Risk Management: Use the live "Volatility" number in the HUD to set your Stop Loss (e.g., 1.5x the current Volatility value).
About the Developer
This script is part of the Quicksilver Ecosystem. We build algorithmic solutions focused on capital preservation and risk management for funded traders.
Disclaimer: This tool is for educational market analysis only. Past performance is not indicative of future results.
ETHUSD Bearish continuation below 3,409 resistanceThe ETHUSD pair continues to display a bearish outlook, in line with the prevailing downward trend. Recent price action suggests a corrective pullback, potentially setting up for another move lower if resistance holds.
Key Level: 3,409
This zone, previously a consolidation area, now acts as a significant resistance level.
A failed test and rejection at 3,409 would likely resume the bearish momentum.
Downside targets include:
2,994 – Initial support
2,879 – Intermediate support
2,753 – Longer-term support level
Bullish Scenario (breakout above 3,409):
A confirmed breakout and daily close above 3,409 would invalidate the bearish setup.
In that case, potential upside resistance levels are:
3,513 – First resistance
3,626 – Further upside target
Conclusion
ETHUSD remains under bearish pressure, with the 3,409 level acting as a key inflection point. As long as price remains below this level, the bias favours further downside. Traders should watch for price confirmation around that level to assess the next move.
This communication is for informational purposes only and should not be viewed as any form of recommendation as to a particular course of action or as investment advice. It is not intended as an offer or solicitation for the purchase or sale of any financial instrument or as an official confirmation of any transaction. Opinions, estimates and assumptions expressed herein are made as of the date of this communication and are subject to change without notice. This communication has been prepared based upon information, including market prices, data and other information, believed to be reliable; however, Trade Nation does not warrant its completeness or accuracy. All market prices and market data contained in or attached to this communication are indicative and subject to change without notice.

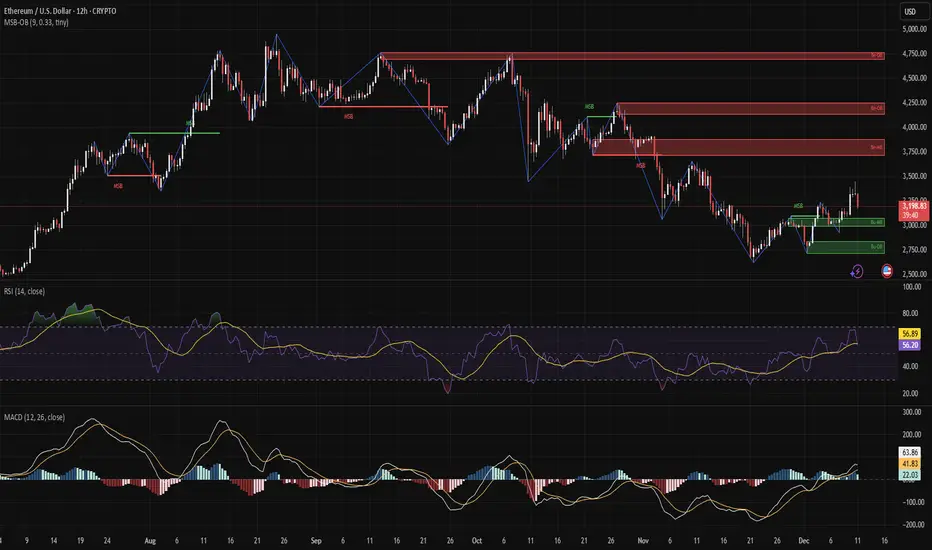
ETH Bulls in Control: Clean MSB Flip Toward $3.6K?ETH is showing more structure than SOL/XRP — a bullish MSB flip was recently printed and demand held near $2.7K–$2.9K. Price reclaimed support and now trades back toward short-term highs.
Indicators:
RSI: ~56 (bullish bias)
MACD: bullish cross with rising histogram
Structure:
ETH is making higher highs and higher lows relative to the recent base. Supply overhead remains, but structure favors continuation.
Position: Long bias
Entry Idea: Long above $3,150
Stop: Below $3,000
Targets: $3,350 → $3,600
Reasoning: Bullish structure intact with positive momentum; needs clean support hold and continuation.
ETH/USD: Fade the fear or chase the flush?ETH/USD has put in a topping pattern on the daily tick, printing a shooting star candle after a failed bullish probe above the interaction of the 50 and 200DMAs. As things stand, Thursday’s candle would complete an evening star bearish reversal pattern should it close around these levels or lower, doubling down on the bearish signal.
However, I don’t trust the broader risk-off move in Asia, apparently sparked by renewed concerns about AI capex following an update from Oracle. I suspect it’s just as much about yen strength weighing on the Nikkei after the Fed’s not-so-hawkish cut delivered on Wednesday. With a near-perfect correlation between Nikkei futures and risk assets such as Ethereum on a one-minute tick over the past hour, it feels like the move may be faded once Europe gets up and running.
I’m watching $3,200 closely into the changeover as it screens as an ideal level to build trades around, given it provided both support and resistance over the past month. If the price holds beneath $3,200 into Europe, consider initiating shorts with a stop above for protection, targeting either $3,000 or $2,916 initially. But if the price reverses back above $3,200 and holds there, the option is there to set longs with a stop beneath for protection, targeting the confluence of the 50 and 200DMAs or Wednesday’s high above $3,450.
The momentum picture is neutral, putting more emphasis on price action when assessing both setups.
Good luck!
DS

Ethereum short: Completed triple combinationIn this idea, I showed the following:
1. Updated Elliott Wave counts showing the triple combination as sub-wave 2 of 3
2. That sub-wave 2 of 3 ended at the resistance created by the low of wave 1.
3. 3 different prices where support for Ethereum can be found, with the last being the target for this idea.
4. Stop loss above sub-wave 2 of 3 high.
Good luck!

ETH 2 Scenario ETHBTC Chart is clear as day , its reversing back to 0.06 area region
Knowing ethbtc 0.06 now we can have at least 2 cases
IF BTC is at 140K back there are chances where ETH hit 8.3k
IF BTC rejecting 104K and enter 4 year cycle bear market ETH have a change to at least hit 5.5K max
But looking in chart, there are 2 obvious pattern we can generate which is
1. H&S heading to 8.3k
2. Weird Cup and Handle to 8.3k
We will revisit this again in 6 months time
Either way , 2026 is clearly 4 year cycle, but will there be a shock ? just like how no altseason shock?
market maker decide.

ETHUSDT Trade Plan (December 8, 2025)ETH Trade Plan (December 8, 2025)
(D1 / H4 / H1 / M15)
⬛️ 1. Higher Timeframe Context (D1 and H4)
• D1 bias: neutral (bullish reversal attempt)
• D1 range (approx): $2,800 – $3,762
• Key D1 zones:
• Supply: $3,350–$3,762 (previous breakdown + OB cluster)
• Demand: $2,800–$3,050
• H4 bias: buy dips
• H4 zones of interest:
• H4 Sell Zone 1: – previous rejection cluster (decaying)
• H4 Buy Zone 1: – OB + HVN + weekend absorption
All active setups are trend-aligned with emerging H4/D1 bullish structure.
⬛️ 2. Preferred Setups by Horizon
🔳 2.1 Swing Setup (D1/H4)
• Idea: Long dips into $3,100–$3,150 for retest $3,500+ (post-Fusaka accumulation).
• Time horizon: multi-day.
🔲 2.2 Intraday Setup (H1 focus)
• Idea: Long reclaim/break $3,150–$3,190 zone.
• Time horizon: today / overnight.
▫️ 2.3 Scalp Setup (M15 focus)
• Idea: Dip-buy $3,100–$3,110 with absorption or breakout >$3,140.
• Time horizon: minutes–hours.
▪️ 2.4 Arbitrage/Pairs Concept
• Long ETH/BTC ratio – defending key support, mean-reversion bias up.
🟩 3. Entry Zones and Triggers
Main Long Setup (Trend-Aligned)
• Execution timeframe: H1
• Trigger timeframe: M15/M5
• Entry zone:
• Context: H4 demand + weekend sweep reclaim + institutional spot buying
• Pattern tags:
Trigger conditions:
• Price holds $3,100 bid cluster + M15 bullish structure (higher low + volume delta buy)
• CVD positive or diverging bullish
• ML-Predictive 15m upside prob ≥0.65
• No aggressive ask walls rebuilding
🔴 4. Stops (Invalidation Levels)
Long setups:
• Stop: $3,045 (below weekend low + H4 demand)
• Logic: Structural failure, CHoCH down confirmed.
🟢 5. Targets
Long:
• TP1: $3,190 – local supply + FVG fill (H1/H4)
• TP2: $3,350 – supply retest + LVN void (H4/D1)
• TP3 (swing): $3,600+ – next HVN + extension (D1)
⬛️ 6. Position Sizing
• Baseline risk trend-aligned: 1.0%
• Adjustments: −0.2× (put skew + weekend tail) +0.1× (strong absorption + news)
• Effective risk: 0.9% main long, max 0.4% aggressive scalps
⬛️ 7. Risk Flags
• Persistent put skew → vol expansion downside risk
• Weekend liquidity memory (potential gap lower Asia)
• High OI + neutral funding → crowded long risk if macro flips
• Death cross D1 still active (macro timeframe bearish pressure)
⬛️ 8. Flip Conditions
Bull → bear flip: H4 close < $3,050 + CVD strongly negative + funding negative.
⬛️ 9. Alternative Scenario
Fakeout above $3,190 → sharp rejection (spoofing + gamma) → trap longs → drop to $2,950–$3,000 (next demand + round number). Requires delta selling + macro risk-off trigger.
⬛️ 10. Model Self-Critique
• Main assumptions: Fusaka narrative sustains buying, institutional accumulation continues, no macro shock.
• Vulnerabilities: put skew buyers re-assert, whale distribution at supply, weekend gap lower, misread absorption.
• Do NOT chase extended above $3,200 without volume. Do NOT hold through Asia low liquidity without tight stops.
⬛️ 11. Uncertainty and Constraints
Uncertainty: medium
Constraints: require M15 confirmation + positive delta, no entries above $3,200, reduce size into NY close if no volume.

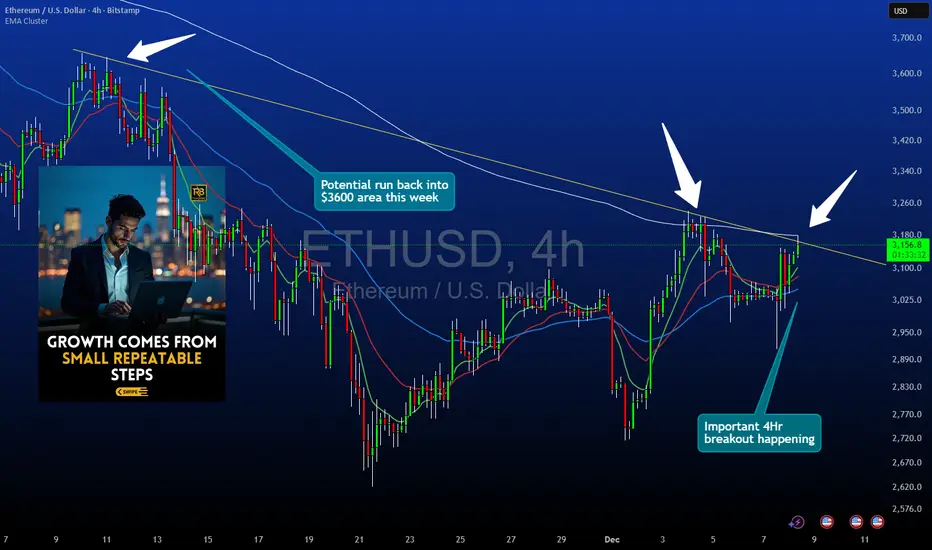
Ethereum 4HR Structure UpdateThis idea focuses on Ethereum on the 4 hour chart.
Price is approaching a descending trendline that has acted as dynamic resistance. A break and confirmed close above this trendline is required before considering any long setups.
Key Levels and Structure
• Primary focus is the descending trendline that has capped every recent bounce
• A full candle close above the trendline is essential before any entry is planned
• The upside reference area for this idea is near 3600 where prior reactions occurred
• Invalidations sit below 2950 which would represent a break beneath the recent structural base
Entry Logic
This setup is based on confirmation rather than anticipation.
• No entries should be taken while price remains under the trendline
• A strong bullish close outside the trendline is needed
• Weak closes or wicks through the trendline without body confirmation do not qualify
• The idea is only valid once the trendline is clearly violated on a closing basis
Why the Close Matters
Closing outside the trendline shows that market participants have accepted price above the descending structure rather than briefly testing it. This helps filter false breaks and reduces reliance on intrabar volatility.
Risk Parameters
Stops would be referenced below 2950 since a move under that area would indicate failure to hold recent structural support. The 3600 region is used as the first upside reference point based on previous reactions on the 4 hour chart.
Notes
This idea evaluates structural behavior and does not forecast future performance. Users should confirm levels and apply their own risk management plan before taking any trade.
ETH | TRADE ANALYSIS📌 Trade Setup:
* Entry Level: 3,071
* Stop Loss: 3,026
* Target: 3,155
ETH is holding above an important intraday support zone, showing signs of renewed buyer interest. Momentum is gradually shifting upward, and if price sustains above the entry zone, a push toward the target area becomes likely. This setup focuses on short-term strength, with clear levels for controlled risk.
Disclaimer: This is not financial advice; it reflects only my personal market analysis. Please do your own research before trading.

EthereumETHUSD
- Completed " 12345 " Impulsive Waves and " AB " Corrective Waves
- Break of Structure
- Sell Side Liquidity
- Break of Structure
- Bullish Channel as an corrective pattern in Long Time Frame

Monthly Analysis:Ethereum (ETH), Issue 280 The analyst expects Ethereum’s price to decline by the specified end time (countdown timer), based on quantitative analysis.
The take-profit level simply represents a potential price range during this period — it’s optional and not a guarantee that the price will reach it.
You don’t need to go all-in or use leverage to trade wisely.
Allocating only a portion of your capital helps keep overall risk low.
Our approach follows institutional portfolio management principles — not the “all-in or blow-up” style often promoted on social media.
Performance is evaluated over the entire time window, regardless of whether the take-profit level is hit.
The validity of this analysis is based on a specific time range (until 04 Jan 2025), and after this period, the analysis will be reviewed and updated (once every 28 days).
Monthly Analysis:Ethereum (ETH), Issue 280

On the 5th Day of ETHmas...a Pulllback to the H4 Demand Zone!ON THE 5TH DAY OF ETHMAS, MY TRUE LOVE GAVE TO ME....A PULLBACK TO THE H4 DEMAND ZONE....
OK, so our ETH trading plan is playing out as expected. Please see my previous posts from the first part of November until now to see how we got here. Since the last post, we have pushed up to our first TP Target and moved all the way up to the Daily Zone. This is a Daily Supply Zone, so it is expected to show some resistance.
Where are we now:
At this point, the market is struggling between the H4 BOS UP and Return to the Source that signaled its time to buy again...and this Daily Supply Zone that is saying..."Not so fast...you have to get past ME first".
Why This Matters:
A Daily Supply Zone is still stacked with sellers waiting to push the price back down. So, it will take some strength from this H4 momentum to break past the Daily Zone. It almost never does this the first time, and is extremely rare to do it without building a solid floor on the way up. All we are seeing right now is ETH pulling back to the H4 Demand Zone. We had several strong H4 bull candles up, and there was not a Demand Zone in place until this one around 2975 -3025. The market HAS to pull back to these type of zones for the strength to continue.
What to Expect from here:
At or inside of this H4 Demand Zone, we need to see confirmation that the buyers are really ready to push this back up. We need to watch the 15 min time frame and look for a 15 Min BOS UP outside of this H4 Demand Zone, Plus a strong retest and bullish rejection out of the zone. The 15 min will show us this first. Ideally, we also want to see an H4 Candle close back up above this zone and retest as well. With that signal, we are back to the bullish trend and headed for the H4 Supply Source as shown before...(3450 - 3560).
Now, the Daily Supply Zone that threw this down to start with will STILL NEED TO BE TESTED AGAIN, so expect more resistance if we push back up to it (3108 - 3215). We need to break through the bottom level first and then retest the top (this recent high of ~3215).
A rejection again at this Daily Supply Zone is going to lead to all future Christmas gifts being cancelled. OR a break of this H4 Demand Zone were in now will lead to the same. This is a MUST HOLD area for the bulls now! If this zone fails...."Nobody's Gettin' Nuttin for ETHmas!"

Ethereum - Weekly Bullish Flip Above $3KEthereum Structural Reversal Complete: Weekly Candle Confirms $3000+ Hold, Targeting $4900 with $7160 Extension
Ethereum has completed a significant structural reversal with weekly candle confirmation above the critical $3000 psychological level. The 0.618 Fibonacci retracement has held on the weekly timeframe, creating a multi-month setup targeting previous highs at $4900, with extended targets reaching the 1.618 Fibonacci extension at $7160.
🎯 Setup Overview:
Current Status: Weekly bullish reversal confirmed above $3000
Critical Level: $3500 close needed to confirm continuation
Intermediate Target: $4900 (previous cycle highs)
Extended Target: $7160 (1.618 Fibonacci extension)
Position Type: Spot portfolio addition for long-term hold
📊 What Just Happened:
The Weekly Flip:
Ethereum's weekly candle closed decisively above $3000, marking the first sustained hold above this psychological level after months of consolidation and testing. This isn't a wick or a brief spike it's a confirmed close on the weekly timeframe, which carries significantly more weight than intraday or daily moves.
The 0.618 Support:
The 0.618 Fibonacci retracement level (calculated from cycle lows to previous highs) has held throughout the recent consolidation period. This golden ratio level marks where deep corrections in bull markets typically find support before resuming uptrends.
Momentum Shift:
Weekly momentum indicators have flipped from bearish to bullish. The reversal isn't just price it's confirmed by:
Volume expansion on the breakout
Momentum oscillators crossing into bullish territory
Market structure shifting to higher lows
📈 Why $3500 Is The Key Level:
The Gate to Higher Prices:
A weekly close above $3500 would accomplish several technical objectives:
Break above intermediate resistance that capped prior rallies
Confirm the $3000 level as support rather than temporary bounce
Open clear path to retest previous highs at $4900
Signal institutional accumulation phase is complete
Historical Context:
$3500 previously acted as both support (before the decline) and resistance (during recovery attempts). A clean break and hold above this level represents role reversal—former support becomes resistance becomes support again.
Why Weekly Matters:
Daily closes can be manipulated or result from short-term volatility. Weekly closes represent sustained conviction from market participants and institutional positioning that persists across multiple trading sessions.
🎯 The Target Structure:
Phase 1: $4900 (Previous Highs)
Represents the prior cycle peak
~62% upside from current $3000 level
Major psychological resistance where profit-taking will occur
First logical target for position reduction
Phase 2: $7160 (1.618 Fibonacci Extension)
Long-term extension target based on geometric progression
Represents 138% upside from $3000
Aligns with potential new cycle highs
Final target for remaining position
Why These Targets:
Not arbitrary price predictions geometric extensions based on:
Historical price structure
Fibonacci ratios that have guided ETH throughout its history
Measured moves from confirmed support levels
Previous cycle behavior patterns
📊 Technical Confluence:
Weekly 0.618 Fibonacci:
This deep retracement level held as support, indicating strong hands accumulated the pullback. When 0.618 holds, the probability of continuation to previous highs increases significantly based on historical crypto cycles.
$3000 Psychological Level:
Round numbers matter in crypto. $3000 represents a major psychological threshold that attracts both retail and institutional attention. Holding above this level shifts sentiment.
Volume Confirmation:
The move above $3000 occurred with increasing volume, suggesting accumulation from larger players rather than retail FOMO. Sustainable moves require volume validation.
Market Structure:
Higher lows are now establishing on the weekly chart. This is textbook uptrend structure after a corrective phase completes.
🛡️ Spot Portfolio Addition Strategy:
Why "Spot" Matters:
This isn't a leveraged trade or short-term speculation. This is spot accumulation for a multi-month to multi-year position. Key differences:
No liquidation risk
Can weather volatility without forced exits
Designed to capture structural moves, not daily swings
Appropriate for long-term asymmetric bet on crypto adoption
Position Sizing:
Crypto allocation should be sized according to:
Personal risk tolerance (typically 5-10% of portfolio max)
Ability to withstand 30-50% drawdowns without panic
Long-term conviction in Ethereum's utility and adoption
Understanding this is a high-risk, high-reward allocation
Entry Approach:
Primary entry: Current $3000+ zone (confirmed support)
Additional entry: Pullback to $3200-3300 if opportunity presents
Final add: On confirmed break above $3500 (momentum confirmation)
This staged approach improves average entry while maintaining conviction.
📈 Why Ethereum for Long-Term Hold:
Fundamental Backdrop:
Ethereum 2.0 transition to proof-of-stake complete
Growing DeFi ecosystem with real utility
NFT and tokenization infrastructure
Institutional adoption increasing (ETFs, corporate treasury)
Deflationary tokenomics post-EIP-1559
Market Position:
ETH represents the second-largest cryptocurrency by market cap with established network effects, developer activity, and institutional recognition.
Risk Acknowledgment:
Crypto remains highly speculative and volatile. Regulatory uncertainty, technological risks, and market sentiment shifts can cause dramatic price swings unrelated to technical structure.
🧠 Why Most Will Miss This Setup:
Fear from Past Pain:
Many traders were hurt during the drawdown from previous highs. That emotional scar makes re-entry uncomfortable precisely when risk/reward is most favorable.
Waiting for "Confirmation":
By the time $4000 or $4500 "confirms" the move, the best risk/reward is gone. Entry at $3000 with $2700 stop offers far superior asymmetry than entry at $4000 with $3500 stop.
Disbelief After Consolidation:
Long consolidation periods create disinterest. When breakouts finally occur, many aren't watching anymore yet these are often the highest-probability setups.
Recency Bias:
Recent sideways action makes traders assume more sideways action. Weekly timeframe reversal suggests the character of price action is changing.
📊 Fibonacci Extensions Explained:
Why They Guide Long-Term Moves:
Fibonacci extensions (1.272, 1.618, 2.618) project where impulse waves typically complete based on the size of previous moves. The $7160 target (1.618 extension) isn't random—it's a mathematical projection.
Historical Validation:
Throughout crypto history, major bull moves have repeatedly respected these extension levels. Bitcoin, Ethereum, and other major assets have demonstrated this pattern across multiple cycles.
How to Use Them:
Identify completed corrective structure (0.618 support held)
Measure from correction low to breakout high
Project extensions for potential targets
Use these as profit-taking zones, not guaranteed destinations
📅 Timeframe Expectations:
Multi-Month Position:
From $3000 to $4900 could take 3-6 months depending on momentum and broader crypto market conditions. This isn't a swing trade—it's a position trade.
From $4900 to $7160:
If achieved, this extension could take 6-12+ months and likely requires favorable macroeconomic conditions and continued crypto adoption narratives.
Volatility Acceptance:
Expect 15-25% pullbacks even within a bull move. Spot positions can weather this; leveraged positions cannot. This is why spot allocation matters.
⚠️ Risk Factors:
Crypto Volatility:
30-50% drawdowns are normal in crypto, even during bull markets. Position sizing must accommodate this reality without forcing emotional exits.
Regulatory Uncertainty:
Government actions on crypto regulation, particularly in major markets like the US and EU, can cause rapid sentiment shifts.
Macro Environment:
Crypto correlates with risk assets. Fed policy, recession fears, and liquidity conditions affect crypto prices significantly.
Technical Failure:
If Ethereum closes back below $2700 on a weekly basis, the 0.618 support thesis breaks and the bullish structure is compromised. This requires disciplined reassessment.
$3500 Rejection:
Price could fail at $3500 and consolidate longer before attempting higher targets. Patience required if this scenario plays out.
🏆 The Long-Term Investor Approach:
They Buy Structure, Not Hype:
The weekly 0.618 hold + $3000 breakout provides objective structure. No need for hopium just probability-based positioning.
They Size Appropriately:
5-10% crypto allocation allows exposure to asymmetric upside while containing downside to manageable levels if thesis fails.
They Think in Cycles:
Crypto moves in multi-year cycles. Current positioning is for the next expansion phase, not next week's price action.
They Scale Out at Targets:
Reduce 1/3 at $4900 (books significant profit, removes emotion)
Reduce 1/3 at $5800-6000 (locks more gains if extension occurs)
Final 1/3 at $7160 or trailing stop (maximizes upside while protecting capital)
📌 Key Takeaways:
✅ Weekly confirmation matters: Daily noise is filtered out; weekly close above $3000 signals structural change.
✅ 0.618 support held: This Fibonacci level has historically marked the end of corrections in crypto bull markets.
✅ $3500 is the gateway: Close above this level opens clear path to retest $4900 highs with minimal resistance.
✅ $7160 represents geometric extension: Not speculation mathematical projection based on Fibonacci ratios that have guided ETH historically.
✅ Spot allocation appropriate: Long timeframe, high volatility, and asymmetric potential make this a spot hold, not a leveraged trade.
⚠️ Important Disclaimers:
This analysis is for educational purposes and reflects a technical view based on weekly timeframe structure, Fibonacci analysis, and crypto market cycles. It is not financial advice or a recommendation to buy or sell Ethereum or any cryptocurrency.
Cryptocurrencies are highly speculative and volatile. Price can drop 30-50% in days regardless of technical structure. The $7160 target represents a mathematical extension, not a guaranteed destination.
Regulatory risk, technological vulnerabilities, and market manipulation are inherent to crypto markets. Past cycle behavior does not guarantee similar patterns will repeat.
The 0.618 support could fail. If Ethereum closes below $2700 on a weekly basis, the bullish thesis is compromised and requires immediate reassessment.
Only invest capital you can afford to lose completely. Crypto allocation should be sized as high-risk, high-reward portion of diversified portfolio. Consider consulting a financial professional and understand the technology and risks before investing.
All cryptocurrency investing involves substantial risk of loss.
✨ Join the Discussion:
Are you accumulating Ethereum at these levels? How do you approach spot crypto allocation in your portfolio? Share your perspective in the comments.
📜 Buy structure. Think in cycles. Hold with conviction.

ETHUSD Bull Trap? - Final Breakdown Setup Is Almost Locked InETH is still stuck inside a clear falling channel, and the entire pattern is behaving like a corrective downtrend. The recent bounce from 2620 looks sharp, but it’s still just a counter-trend move. Nothing here screams trend reversal yet.
Wave 3 ending at 2620 , and now the price is rising for a Wave 4 retracement. Wave 4 usually moves back toward the mid-channel and tests previous breakdown zones.
The red box around 3200–3300 is the key trap zone. This is where sellers can return because Wave 4 must not enter Wave 1 territory, which sits higher. As long as ETH stays under that invalidation level, the bearish structure remains fully intact.
The move looks like a classic (a)-(b)-(c) correction inside Wave 4. Once this corrective bounce completes, the chart suggests ETH will resume the downward path. The channel alignment and wave symmetry both support a final Wave 5 drop.
If the bearish count plays out, ETH could slide toward 2400 – 2300 in Wave 5 before a major bottom forms. That’s the zone where sellers exhaust and buyers take control again. Until ETH breaks the invalidation level with strength, downside remains the more probable outcome.
Stay Tuned!
@Money_Dictators

ETH Is Entering the Trap Zone…ETHUSD Market Analysis – Price Is Entering a Make-or-Break Zone
1. Current Market Structure
- ETH has broken the previous downtrend (breakout from the descending trendline).
- After the breakout, price moved into the Moving Price Zone, consolidating inside an expanding channel.
- Price is now touching the RESISTANCE ZONE, showing clear signs of buying exhaustion.
- The SUPPORT ZONE below (green area) remains the key liquidity zone where strong demand has appeared before.
2. Today’s Scenario (Main Outlook)
🔹 Main Scenario – Bearish Reaction From Resistance
- ETH is likely to:
-Continue to move sideways inside the resistance area → a sign of fading bullish momentum.
-Then initiate a strong corrective drop, following the expanding wedge structure.
-Expected downward targets:
+ First support area
+ Or deeper → the main SUPPORT ZONE to collect liquidity.
Reasons:
- The resistance zone is too strong → multiple rejections.
- Price structure resembles a “distribution zone.”
- The current rising channel after breakout is only a temporary recovery.
3. Market Psychology
Traders turn cautious as ETH enters a major resistance area.
Smart money tends to distribute positions at high prices → leading to sideways top formation.
Buying liquidity weakens the closer price moves to resistance.
This hesitation often precedes a sharp correction phase.
4. Trading Outlook (Intraday)
📌 SELL Zone (High Probability)
3380 – 3420
TP1: 3230
TP2: 3050
SL: 3460
📌 BUY Zone (Re-entry – Low Risk)
2720 – 2800
TP: 2980 – 3050
SL: 2660
5. Conclusion
ETH is approaching a critical decision point:
Priority scenario: Sideways at resistance → followed by a downward move to support.
Bullish continuation only becomes valid if ETH breaks above 3440 with strong volume..
Stay patient. Smart money wins by waiting, not chasing. The next big move will reward discipline.

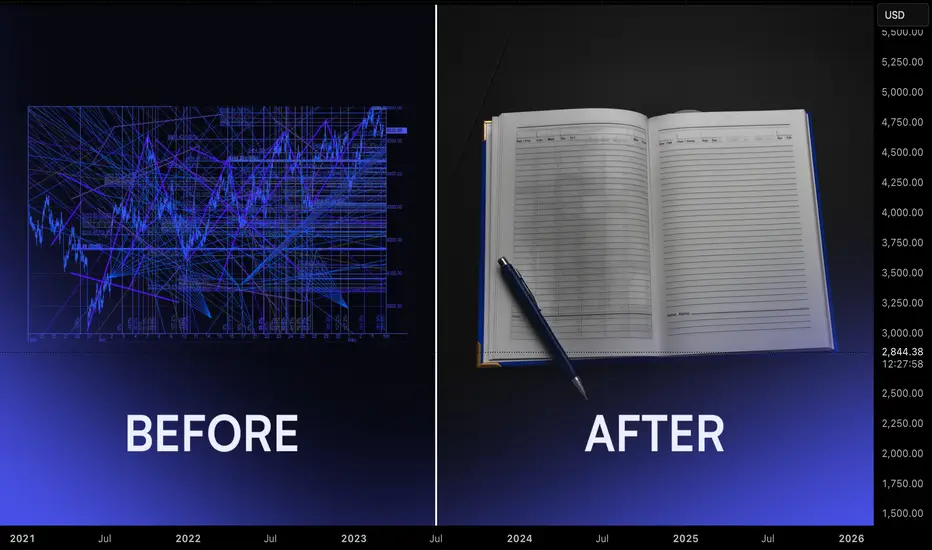
Journaling For Traders: Turning Random Results Into A Feedback Most traders spend years tweaking indicators and strategies while leaving their process undocumented. Without a journal, every trade feels new, every mistake repeats, and progress stays vague. A structured journal turns experience into data. It shows what you do well, what keeps failing, and which behaviours appear before your best and worst decisions.
The first step is simple: record every trade. Log the setup, market structure, entry reason, risk, and emotional state. Write whether you felt rushed, confident, bored, or frustrated. Do not only record wins or big losses. Incomplete data keeps blind spots alive.
The real value appears during weekly review. Set time aside after markets slow down and go through the trades as a batch. Look for recurring situations. You may notice that late-session entries perform poorly, that you increase size after wins, or that you cut trades early when size feels uncomfortable. These patterns are not visible inside a single session. They emerge only over a cluster of trades.
Next, extract insights. Group trades by setup, session, and emotional state. Identify your highest quality combinations. For example, trend continuation trades in London with fixed risk might show a strong performance profile while countertrend entries in low volume hours consistently underperform. This step separates what you think works from what actually delivers.
Finally, adjust strategy. Turn observations into rules. Reduce or remove the behaviours that repeatedly drain capital. Formalise the conditions that define your best trades. Add small process rules rather than full rewrites, then track the impact in the next review cycle. Over time, your playbook becomes evidence based rather than theoretical.
Journaling is not an extra task for perfectionists. It is the operating system behind professional execution. When you continuously record, review, extract, and adjust, your trading process compounds in quality even when individual weeks are difficult.
ETHUSD Weekend Bounce Setup (15m)Following a sharp liquidity sweep into lower intraday demand, ETH is now positioned for a potential weekend rebound. Price tapped into a cluster of overlapping demand levels between 3,045–3,067, an area that has historically produced strong reactive moves on lower timeframes.
Momentum is beginning to stabilize after the selloff, and the current structure favors a corrective bounce toward the nearest inefficiency and reclaimed levels above.
🔹 Entry: CMP
🔹 Target (TP): 3,230.40
🔹 Stop-Loss (SL): 3,045.89
This setup targets a short-term relief rally into the mid-range imbalance, with a clean 5% upside if weekend activity provides enough volatility. A break and hold above 3,180 would further validate the bounce, opening the door toward the white liquidity band overhead.
A decisive breakdown below 3,045 would invalidate the idea and signal continuation into the next demand block below 3,020.
As you can see there are plenty of targets bellow, be wise on risk management
⚠️ Financial Disclaimer (fun version):
Not financial advice. Just chart gymnastics. If you trade this with no stop-loss because “it’s the weekend,” ETH may personally teach you what volatility really means. DYOR and stay safe out there.

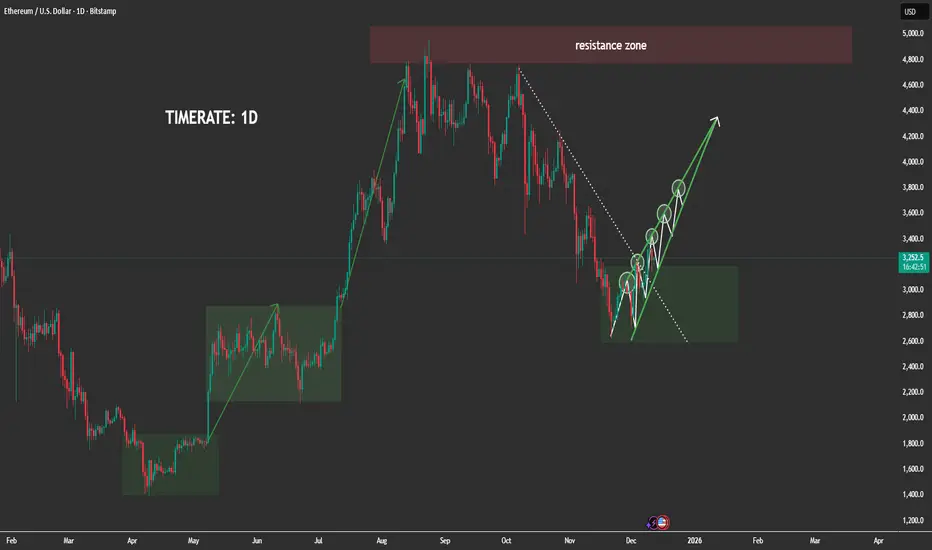
The ETH Move No Trader Is ExpectingETHEREUM 1D MARKET ANALYSIS
1. Current Price Structure
- ETH previously completed a strong bullish impulsive wave, breaking through multiple resistance levels before reaching the major 4,800–5,000 resistance zone, where the market formed a clear distribution top.
-After distribution, price entered a large corrective decline, following the descending dotted trendline visible on your chart.
-Recently, ETH has formed a broad accumulation block (highlighted in green), similar to the previous accumulation phases that triggered massive ETH rallies earlier in the year.
Inside this zone, ETH is now building a series of higher lows, showing early signs of bullish reconstruction.
-The current rising green structure indicates that price is forming a stair-step bullish pattern, preparing for a potential macro reversal.
2. Key Liquidity Zones
-Major Resistance Zone: 4,800–5,000
-This is the next major destination if ETH successfully completes the accumulation and transitions into expansion.
-Accumulation Block: 2,750–3,150
-This is where smart money is currently active — sweeping liquidity, trapping sellers, and accumulating long positions.
-Multiple liquidity grabs have already occurred inside this range, confirming strong institutional absorption.
-The current structure closely mirrors previous accumulation rectangles on the chart that led to massive bullish expansions.
3. Today's Market Scenario (1D Outlook)
Matches perfectly with the upward projection on your chart.
🔹 Main Scenario – Bullish Continuation After Accumulation
ETH is likely to follow this sequence:
-Continue building higher lows inside the accumulation block.
-Retest the inner structure trendline without breaking the macro zone.
-Form a clean break above the descending dotted trendline — signaling a bullish structure shift.
-Retest the broken trendline to form the final higher low.
-Begin expansion to the next major liquidity magnets:
-Short-term targets: 3,600 → 3,800
-Mid-term continuation: 4,200 → 4,500
-Macro target: 4,800–5,000 resistance zone
This is fully aligned with the green arrow projection you drew.
4. Market Psychology
-Big players are actively accumulating within this wide range clear repeated liquidity sweeps prove institutional activity.
-Retail traders are losing positions during sudden spikes and false breakdowns, which is typical behavior during accumulation phases.
-The market is more likely preparing for a major trend reversal, not a continuation downward.
-The price behavior mirrors earlier patterns:
Accumulation → Trendline Break → HL Retest → Massive Expansion
-This repetition increases confidence in the bullish outlook.
5. Intraday Strategy Guidance (1D)
Given the macro accumulation:
-Avoid selling aggressively the probability is against sustained bearish continuation.
-Best opportunities come from buying dips inside the accumulation zone.
-Watch for liquidity sweeps below local lows to identify smart-money entries.
High-probability setups:
✔️ Strategy 1: Buy the Bottom of the Range
Entry zones: 2,750–3,150
Targets: 3,600 → 3,800
✔️ Strategy 2: Buy the Retest After Trendline Breakout
This is the cleanest and safest setup.
Targets: 4,200 → 4,500 → 4,800+
ETH is currently in the prime zone where large investors position themselves before a new bullish cycle.
ETH USD SELL NOW 3182posting the sell trade based on sell side imbalance and buy side ineffiencicy
ETH USD SELL NOW 3182
Sl and TP are 1:4 RR

ETH PERPETUAL TRADE BUY SETUP Long from $3120ETH PERPETUAL TRADE
BUY SETUP
Long from $3120
Currently $3120
Targeting $3175 or Above
(Trading plan IF ETH
go down to $3060 will add more longs)
Follow the notes for updates
In the event of an early exit,
this analysis will be updated.
Its not a Financial advice

ETHUSD — Bearish Retracement Toward Demand ZoneETHUSD is currently trading inside a broader distribution structure, with price repeatedly rejecting the strong supply zone near the 3,230–3,260 area. Multiple seller zones, along with the breakdown from the recent range, indicate weakening bullish momentum.
Price has shifted from an earlier UTA uptrend channel into a more corrective DTA structure, showing clear signs of distribution. After failing to break above supply, the market is forming lower highs and consolidating near 3,120—suggesting bearish pressure is building.
If the current range fails to reclaim upside levels, ETHUSD is likely to continue its downward corrective move toward the marked support around 3,030. A deeper drop could extend to the 2,910–2,950 demand zone, which is the next strong liquidity pocket. This is where buyers previously stepped in aggressively, making it a high-reaction area.
Overall, structure favors downside continuation unless price reclaims the upper seller zone with strong bullish momentum.
If this chart helped you understand the market structure more clearly, show some support! Like the post, drop a comment, and follow the profile to get more consistent updates, smart money concepts, and high-quality trade setups.
