Market insights

ETHUSD 1D Analysis: Back to the 0.618 fib after ATH rejection?ETH seems to have been rejected at ATHs, with a consequent break of trend diagonal, it's retest and rejection.
The chart reflects a bearish divergence between price and momentum indicators, suggesting a possible trend reversal for ETHUSD in the coming months. The RSI shows a lower high while price made a higher high, indicating weakening buying pressure. Similarly, the MACD’s lower high echoes a loss of momentum, confirming the divergence signal.
The main daily chart displays a breakdown of the multi-month uptrend, as the price violated its rising support line around the end of September 2025. This technical break is reinforced by the outlined Fibonacci retracement levels, providing reference points for potential support and resistance zones. The red projection line anticipates further downside, aligning with the negative momentum seen in RSI and MACD.
Price targets for the projected short setup are highlighted by the green box between the $2,150 and $2,600 zone, where historical volume and Fibonacci confluence may offer stabilization. A broader target extends as low as $1,650 if bearish momentum intensifies, while resistance on any bounce exists near $3,200 and $3,850.
Trade Idea Summary:
Bias: Bearish, following uptrend break and momentum divergence.
Entry range: On confirmed retest and rejection of the broken trend line or key resistance ($3,200–$3,850).
Profit targets: $2,600, $2,150, $1,650, based on volume profile and Fibonacci levels.
Stop loss: Daily close above $4,000 or reclaim of trendline.
Risk management: Adjust stop as price approaches $2,600 zone.
This setup emphasizes momentum decay, technical breakdown, and structured targets, ensuring clarity for both experienced and newer traders.
NFA

ETH: Pulled back under pressure📝ETH has recently broken through an important downward trend line, but then experienced a pullback.
📈Currently, the price is facing greater pressure near 3950. If the closing price can be above 3950, the weekend recovery may continue, and it may even challenge the 3970 - 4000 area. If it can break through this area, it may further rise; if it fails to close above 3950, there will still be a need for a pullback.The key support level below is near 3650.
💡If this position cannot provide effective support, the price may further decline to around 3550, or even near 3370.
💡The resistance level above is in the 3970 - 4000 area. This area is an important pressure level. If the price can effectively break through it, it may indicate that the structure has stopped falling and a rising opportunity will come.
♦Market sentiment remains cautious, with long and short sides locked in a stalemate. From a technical pattern perspective, there is a trend of lower highs and lower lows in prices. If the current structure cannot be broken, market risks will persist.
💎
Buy 3835 - 3840 TP 3850 - 3860 - 3870 SL 3825
Sell 3920 - 3910 TP 3900 - 3890 - 3880 SL 3930
Daily-updated accurate signals are at your disposal. If you run into any problems while trading, these signals serve as a reliable reference—don’t hesitate to use them! I truly hope they bring you significant assistance

ETH Long into Q4📈 Ethereum / USD (1W) – Macro Outlook
Ethereum is consolidating after a strong rally, currently finding support near the 0.382–0.618 Fibonacci retracement zone — a historically key area for continuation setups.
If this structure holds, ETH could be gearing up for its next macro leg, with potential upside targets aligning around:
⚪ Very Likely: ~$6,400
🔵 Likely: ~$7,800
Key Support Levels to watch:
$3,850 → short-term support
$3,220 → major retracement support
As long as ETH maintains higher lows above the 0.618 region, the macro bullish structure remains intact — indicating that Ethereum may just be cooling off before its next impulse.
🚀 Macro trend still favors continuation, but short-term volatility remains high.
#Ethereum #ETH #Crypto #TechnicalAnalysis #ETHUSD #Altcoins #CryptoTrading

ETHUSDT - BULLISH SETUP After a clean sellside liquidity sweep and confirmation of SMT divergence, ETH showed a market structure shift (MSS) followed by a break of structure (BOS) to the upside. Price is now respecting the consolidation sellside imbalance discount (CSID) zone while maintaining structure above the key discount area.
Bias: Bullish
SMT divergence confirming liquidity grab ✅
MSS + BOS show shift in order flow ✅
Price reclaiming FVG and holding above OB ✅
Targeting inefficiency and buyside liquidity near 4240
Expecting continuation if price maintains above 3850, with displacement toward the premium range and rebalancing the prior imbalance.


CRypto Update - ETHI didn't realize it until; after market close, but every crypto made what looks like a pennant this week. It's most obvious on ETH so I plotted that instead of BTC.
As much as cryptos are tied into the financial system, this could wind up being a big deal if cryptos collapse.

ETHEREUM Free Signal! Sell!
Hello,Traders!
ETHEREUM Price has reacted sharply from the horizontal supply area, confirming the presence of institutional selling pressure. A clean rejection signals continuation toward the lower liquidity pool near $3,740 as Smart Money hunts sell-side targets.
-------------------
Stop Loss: $3,888
Take Profit: $3,741
Entry: $3,829
Time Frame: 3H
Setup Risk: High
-------------------
Sell!
Comment and subscribe to help us grow!
Check out other forecasts below too!
Disclosure: I am part of Trade Nation's Influencer program and receive a monthly fee for using their TradingView charts in my analysis.

Bullish reversal pattern observed (is the bottom in?)Wondering if this is the bottom , the actual dip that can be bought for ETHUSD..
$ETH (WEEKLY): still BULLISH, lost the main SUPPORT ($4k)CRYPTOCAP:ETH the WEEKLY chart is crucial for the #altcoins in Q4, so we better have a solid grasp here.
This one is very problematic, as in, it doesn't give us many clues. No proper chart pattern, at all, for years on this WEEKLY. That is rare, and I don't like it, tough to analyse.
No clear ELLIOT'S WAVE pattern, the last WAVE 5 completed in December 2024, followed by a huge correction and even greater rebound ending in the current ATH zone.
I will just stick to tested horizontal SUPPORT/RESISTANCE ZONES, these are always high %.
So, the main RESISTANCE to beat before any BULLISH bias: $3988 - $4092. Close below and things are getting really serious immediately.
As far as the SUPPORT zone, between $3306 and $3571. The support zone is where I would be looking for those sweet wicks down in case of an earthquake.
Market STRUCTURE is still BULLISH and in an UPTREND. I will publish the DAILY, this one is fundamental to process first👽💙

ETHUSD WILL FLY HIGH According to H1 analysis ETHUSD market continuously running in wide wave and now market almost at SUPPORT LEVEL if you are interested then go long from here is best for you dont be greedy use money management
TRADE AT YOUR OWN RISK
REGARD ALBERT

MeghaHorn or BowTie Pattern !!!Key Observations:
Pattern Formation:
A broadening wedge or megaphone pattern (also likened to a bow tie) is forming.
Price is oscillating between expanding trend lines.
Labeled waves: 1, 2, 3, 4, 5 within the pattern.
Critical Zones:
Buy Above: $2,815.98 (upper boundary of the wedge).
Sell Below: $2,258.03 (lower boundary of the wedge).
No Trading Zone: Between $2,258 – $2,815 (uncertainty/consolidation area).
Price Target:
If price breaks below, Target 1 is indicated around $1,800 or below (implied from structure).
Current Price:
Trading at $2,748.56, up +5.05%, within the “No Trading Zone”.
Summary:
The chart suggests waiting for a breakout or breakdown from the wedge pattern to determine the next move. A breakout above $2,815 could signal a buy opportunity, while a breakdown below $2,258 could trigger a sell with a potential target near $1,800.
Ask ChatGPT

Short Term Trade on Ethereum Ethereum followed the time cycle perfectly today — it turned down right at 9:30 AM IST as projected. The next cycle is on Friday at 5:00 AM IST. Stay alert to my time cycles and don’t miss the upcoming trade.

Ethereum Following Neo WaveEthereum master plan decoded with Targets just follow my Green lines :-)
Ethereum is following neo waves, and these targets are now Arrived basis on the neo wave theory

Eth New Targets - Triangle Breadown📉 Technical Patterns & Indicators
1. Head and Shoulders Pattern
Left Shoulder, Head, and Right Shoulder are clearly marked.
Breakdown from the neckline suggests a bearish reversal, with a drop of ~6.49% (-295.99) post-breakdown.
2. Triangle Formation
A symmetrical triangle labeled with a, b, c, d, e waves.
The recent price movement has broken below this triangle, indicating a bearish breakout.
3. Elliott Wave Labels
Waves labeled A, B, C, D, E, F, G.
The chart is currently in the E-wave to F-wave transition.
Projection points:
F Wave target: ~$4,218
E Wave target: ~$4,084.51
G Wave target: ~$3,897.08
4. Trendlines
Blue and black descending trendlines suggest downward pressure.
Ethereum remains below these resistance lines, reinforcing a bearish outlook.

Ethereum Daily Chart (Sell on Rise)Wave Count (Green Labels 1–5):
A 5-wave impulsive move appears to have completed, marking a bullish cycle peak.
Complex Correction (W-X-Y-X-Z pattern):
The correction after the 5th wave is labeled as a Complex Correction, composed of:
Wave W – Zigzag
Wave X
Wave Y – Flat (3-3-5)
Wave X – Smaller bounce
Wave Z – Currently unfolding with a Diametric Pattern (7-wave structure)
📉 Current Market Structure
Ethereum is in a corrective phase, currently moving through the Z wave of the complex correction.
The correction appears to be forming another Diametric Pattern, potentially indicating one final drop before resuming upward.
🛒 Key Buying Zones Highlighted
Upper Buying Zone (~$4,400 to $4,600)
If ETH breaks bullish earlier than expected.
Lower Buying Zone (~$3,600 to $3,800)
More likely based on the projection shown.
Where the final leg (Z) is expected to complete.
📈 Projected Path
Price is expected to dip into the lower buying zone as the Diametric pattern completes.
Following that, a strong bullish reversal is anticipated, likely leading to a new impulsive wave up.
📝 Patterns Used
Zigzag
Flat (3-3-5)
Diametric Pattern – A 7-legged corrective structure, less common, indicating prolonged correction.

Eth Ready for All time High :-)🔍 Analysis Summary:
Current Price: ~$3,824
Pattern: Complex Elliott Wave correction (W-X-Y-X-Z) has likely completed.
Key Observation: A potential bear trap just occurred (false breakdown), signaling a reversal.
Wave Count: The chart suggests that Wave 2 has completed, and Wave 3 up is starting.
✅ Trading Plan:
Buy Above: $3,925
Stop Loss: $3,378
Target 1: $5,230
Target 2: $6,306
🧠 Insights:
Buying Zone was identified in the earlier phase near April.
Bear Traps are used to suggest failed breakdowns, which trap sellers and fuel upside moves.
Expected Move: Strong impulsive rally if price breaks above the resistance zone.

#Ethereum - Aug 2025: $ 1300 Points Move?Date: 17-08-2025
#Ethereum - Current Price: $ 4,478
Pivot Point: $4,579.06 Support: $ 4,348.59 Resistance: $4,811.61
Upside Targets:
--------------------------------
| Target | Price |
---------------------------------
| 🎯 Target 1 | $5,112.56 |
| 🎯 Target 2 | $5,413.52 |
| 🎯 Target 3 | $5,726.44 |
| 🎯 Target 4 | $6,039.36 |
Downside Targets:
| 🎯 Target 1 | $4,046.59 |
| 🎯 Target 2 | $3,744.60 |
| 🎯 Target 3 | $3,431.67 |
| 🎯 Target 4 | $3,118.75 |
#Crypto #Bitcoin #BTC #CryptoTA #TradingView #PivotPoints #SupportResistance
#SOLANA #ETHEREUM #BTCUSD #MATICUSDT #XRPUSDT

Ethereum Key Buy Zones 💠 Ethereum (ETH/USD) – Key Buy Zones Ahead
ETH is showing a major rejection from the same price zone that has only been tested twice in history — near the $4,000–$4,100 resistance area (highlighted in circles). Both previous visits led to sharp corrections, making this a historically strong resistance zone.
⸻
🔹 Current View
• ETH rejected the $4,000–$4,100 zone — same level as the 2021 top.
• Price is now trading around $3,770, below the 50 & 100 SMAs, signaling short-term weakness.
• The RSI is trending down from mid-levels, suggesting more room for a correction before a potential bounce.
⸻
🔹 Buy Targets
• First Buy Target: $2,590
• Second Buy Target: $2,160
• Third Buy Target: $1,715
These levels line up with strong historical support zones and key moving averages, ideal areas to start accumulating if ETH continues to pull back.
⸻
🔹 Outlook
The long-term structure for Ethereum remains bullish, but a deeper correction could provide much better risk-reward entries for the next cycle.
My plan: accumulate gradually at the marked levels, focusing on patience and strong technical confirmation.
⸻
🧠 “Smart investors don’t chase green candles — they buy when fear returns.”
📜 Disclaimer : This is general information only and not financial advice. Always do your own research before investing.

ETH Bearish for Now: Watch the Yellow Zone CloselyKey zones for Ethereum have been identified, but the highlighted yellow zone holds greater importance and stronger liquidity attraction. For now, ETH remains bearish — let’s see how it reacts to these levels

ETH will print another explosive impulseETH, as long as we don't invalidate the impulse, will revisit higher prices (if we'll have a bullish Q4 as expected).
Looking for a reaction at the FVG which has many confluences

Everyone's Panicking, Market is TANKING!The Crypto Market Is TANKING!
Right now, the market’s crashing, everyone’s confused, and fear is everywhere. In this video, I break down exactly what’s happening with TOTAL, BTC, and ETH, and why I’m not surprised by this move at all.
I’ll explain:
Why people are panicking (and why they shouldn’t)
Why I don’t think the wick will get filled — and what it means if it does
The key levels I’m watching for BTC and ETH
What this crash could mean for the next major move
Stay calm, stay focused — this is where real traders are made.
#Bitcoin #CryptoCrash #BTC #ETH #CryptoMarket #Altcoins #CryptoTrading #ICTStrategy

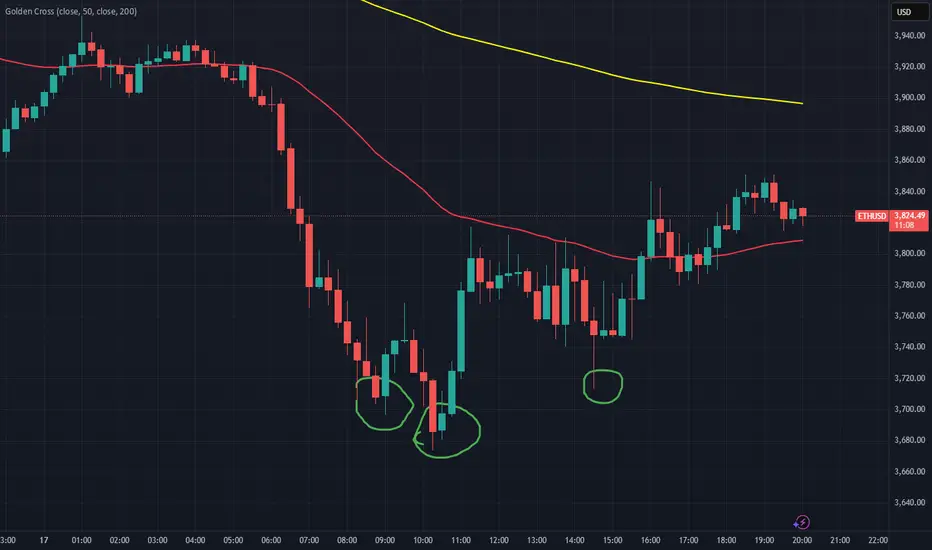
$ETHUSDBITSTAMP:ETHUSD : Bullish Gartley that I feared did drive ETH to $3734. Selling is so intense. Not sure it'll bounce. Chances are it won't bounce until BTC is driven below $100K.
I'm still long and holding Ethereum ETF. Don't think it's a good idea to add here.
