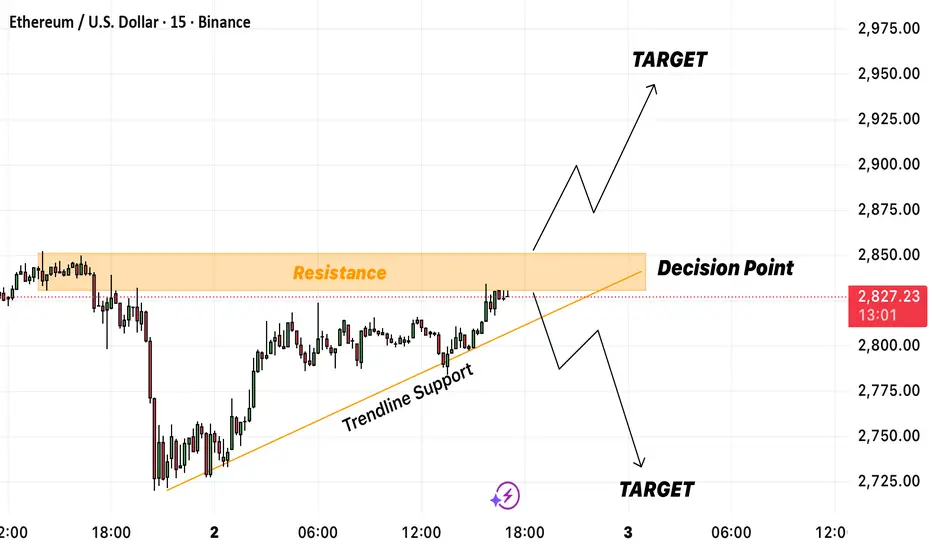
ETH/USD at Key Decision Zone – Breakout or Rejection?Ethereum is approaching a major resistance zone around $2,830 – $2,850, which previously acted as strong supply. Price has been climbing steadily along a rising trendline support, indicating sustained bullish momentum.
This creates a decision point where ETH will likely choose its next directional move.
🔼 Bullish Scenario
If price breaks and closes above the resistance zone, it confirms bullish continuation.
In this case, buyers may push price toward the next liquidity zone around:
Target: $2,900 – $2,950
A successful breakout with retest would strengthen the bullish case.
🔽 Bearish Scenario
If price rejects the resistance and breaks back below the trendline support, selling pressure may return.
Downside targets would be:
Target: $2,750
Extended Target: $2,720
This would signal a shift in short-term structure from bullish to bearish.
📌 Key Levels to Watch
Resistance (Decision Zone): $2,830 – $2,850
Trendline Support: Rising from the $2,750 region
Bullish Target: $2,900 – $2,950
Bearish Target: $2,720 – $2,750
📈 Summary
ETH is sitting at a critical decision point. A breakout above resistance opens the door for bullish continuation, while a rejection could trigger a deeper pullback. Traders should wait for confirmation—either a clean breakout or a trendline breakdown.
Market insights
ETH/USD — Downtrend Extends as Price Tests Key Support ZoneETH/USD remains in a medium-term downward trend, correcting against the long-term structure.
The pair has broken below the descending channel and is now testing the support area at 2812.50–2720.00
(Murray , 61.8% Fib). A firm daily/weekly close below 2720.00 would confirm downside continuation toward:
• 2187.50 (Murray )
• 1875.00 (Murray )
A reversal scenario becomes valid only if ETH reclaims the 3437.50–3540.00 resistance zone
(Murray , 38.2% Fib, upper Bollinger Band). A breakout above this area would open targets at:
• 4062.50 (23.6% Fib, Murray )
• 4687.50 (Murray )
• 5000.00 (Murray )
Indicators:
Bollinger Bands are sloping downward, MACD stays negative, and Stochastic is turning lower.
On the weekly chart, price has reached the lower Bollinger Band, increasing the probability of another leg down.
⸻
Key Levels
Resistance: 3540 • 4062.50 • 4687.50 • 5000
Support: 2720 • 2187.50 • 1875
⸻
TradingView Scenarios
Primary Scenario — SELL STOP
• Entry: 2700
• TP: 2187.50 / 1875
• SL: 3100
• Bias: Bearish below 2720
• Timeframe: Weekly
Alternative Scenario — BUY STOP
• Entry: 3570
• TP: 4062.50 / 4687.50 / 5000
• SL: 3240
• Bias: Bullish above 3540

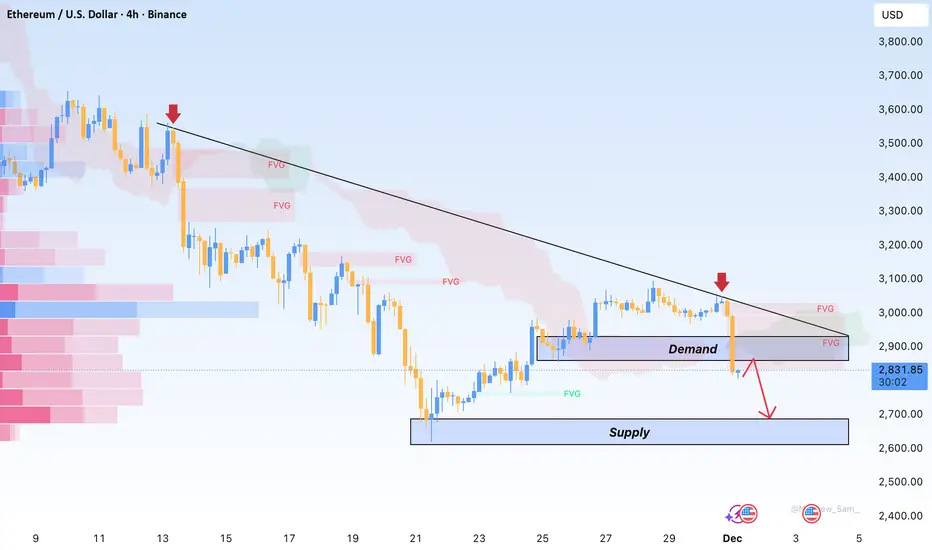
ETH Faces Heavy Rejection, Downside Risk IntensifiesETH printed a strong 4H bearish candle as soon as price retested the 3,030–3,100 supply zone, confirming that sellers still dominate this area. The sequence of lower highs remains intact, and the sharp break below 2,900 with increased volume signals a genuine sell-off rather than a routine shakeout.
Price is currently hovering around the 2,820–2,850 support, but buying interest is weak. The 2,750–2,780 pocket carries deeper liquidity and is a more realistic area for the market to stabilise if downward momentum continues.
Macro conditions also lean bearish: US yields are climbing, expectations for prolonged high rates from the Fed persist, regulatory pressure from the SEC remains, and whale flows to exchanges add further weight on crypto sentiment.
My view: ETH is more likely to slide toward 2,750–2,780 before any meaningful recovery. Only a 4H close above 3,030 would provide early signs of a short-term reversal.
eth live update looking ugly eth on smaller time waiting for conformation and the creation of a bearish channel only and i mean only we get conformation in the next few hours . so if we dont break above this channel we will see 2500.00... invalidated if we see a break above resistance

eth on smaller time blood be comingfor everyone this is a picture how things will look we can see clearly there was a triple top rejection off resistance and it looks as if we are in wave 3 of 5 update is a possible 45% draw down.time frame is we are in a bear market that started in October since then we have seen a 45% drop and if next major support would make from the high to my target a total of 65% which is not uncommon in crypto. extremely possible another 45% down from current price. be safe

eth still more to bleed eth has been going sideways since 2021. we clearly have a bearish double top (inside) an ascending triangle and have rejected off support. now we will likely see a pull back to support which would be another 30% drop before we see a bull market. this looks like a bearish break and simple retest of the old high from 2018 price to watch 1500.00

$ETH, $4.7K+ Before End of 2027? Retracement Potential?Ethereum is one of those that I am neutral on but invested for long term holds. They have a monopoly on tokenization, yet at the same time, the whole purpose of Ethereum has changed dramatically.
The PoS transition when Ethereum Classic was the original Ethereum and Ethereum PoW is currently the "decentralized newer Ethereum" have left various technologist confused along with the removal of the Ropsten testnet. This has shown Ethereum to be much more centralized than promised and it is entering muddy waters in that sense.
Likewise, can Ethereum differentiate itself from Namecoin, Peercoin and these original PoS forks who got outpaced? Ethereum's technical transition also emphasizes the need for subnets, rollups and speed. Currently they are competing against Solana as well as other players including Z-Cash or minimal small players like Celo and Cardano. The technical differentiation needs to be expanded however in order to allow for scalability. Likewise, Ethereum is still prime in terms of PoS and name-brand but may not be prime in terms of technology.
That said, the long-term potential is still there and Ethereum has a hard to replace developer ecosystem. The patterns when considering fib retracement along with the past cipher and PnL setup showcase the potential of a $4.7K price point by October 2027. As always, none of this is investment or financial advice. Please do your own due diligence and research.

Ethereum Fake Breakout? Deep Drop After Hitting $4000After breaking above $4000, Ethereum boosted confidence among many holders — and a large number of traders entered right at that level.
But Bitcoin’s sharp drop triggered massive stop-loss hits across the market, revealing that the breakout was fake and most likely a stop-hunting move.
That’s why we saw such a deep correction.
I personally exited around $3800 with a small loss, and I shared the signal in the link below.
Even I was trapped by this fake breakout.
📉 Next support levels:
$2500
$1500
What’s your outlook?

ETH BULLISHPlease don’t judge the set up lol I’m still learning. I’d love some constructive criticism cause I know I got a rookie setup but I am bullish on ETH.

$ETH – Classic Breakdown → Bounce → Reshort Setup Into 20 SMACRYPTOCAP:ETH – Classic Breakdown → Bounce → Reshort Setup Into 20 SMA Resistance
Ethereum ( CRYPTOCAP:ETH ) is giving one of my all-time favorite continuation short setups — a clean breakdown, followed by a weak bounce right back into the 20 SMA, which is exactly where momentum names often fail.
🔹 The Setup:
• After the big swoosh down, CRYPTOCAP:ETH is now bouncing right into the shaded zone between the 9 EMA and 20 SMA.
• I call this area the Bone Zone — where broken trends come to die.
• CRYPTOCAP:ETH is showing zero character change on the bounce: lighter volume, lower high structure, no real demand.
🔹 Why This Is Textbook:
• Breakdown → weak retrace → touch of the 20 SMA = the exact continuation short I’ve traded for nearly 20 years.
• The 20 SMA often acts as the “kiss of death” in downtrends when momentum has already flipped.
• Crypto across the board is soft — CRYPTOCAP:BTC cracking key levels, CRYPTOCAP:ETH failing to reclaim anything meaningful.
🔹 My Trade Plan:
1️⃣ Entry: Short into the 20 SMA rejection inside the Bone Zone.
2️⃣ Risk: Stop just above the 20 SMA — clean and mechanical.
3️⃣ Target: A retest of the breakdown lows first, then mid to low -$2,000s if momentum continues.
Why I Love This Setup:
• Same breakdown pullback pattern I’ve run for decades — clean, high R/R, predictable.
• Structure is perfect and risk is tight.

Chart any asset against another - Tradingview Trick!In this video, I show you how to chart any asset against another in Tradingview.
In this example I chart CRYPTOCAP:ETH vs NYSE:CRCL and show the relationship between the two assets. It is much easier to view the relationship between two entirely different assets when you chart them correctly!
This will give you a view you didn't see otherwise.

ETHUSD | Let that sink in...Understand the chartTL;DR: This chart looks like what happened in 2021 in a ridiculous way. A breakout, a rejection, a relief rally, then a painful descent through layered support zones.
I really don’t want to be the guy who says “I told you so” but charts teach with loss as often as profit.
Look at what happened when ETH reached ATH in 2021. A clear breakout and immediate rejection. Price then collapsed with multiple spikes to trick HODLers and bull for life traders.
----------------------------------------------
The lesson the chart here to offer
If our analysis is correct, we’ll see a short-lived manipulation into resistance ($3.6–$4.0k) that will suck in all longs.
What happens next you may ask? Straight down to support zones.
Breaking one support usually leads to the next.
----------------------------------------------
Practical rules to survive this (educational only):
Assume rallies are traps until proven otherwise. Wait for structure (higher lows + higher highs) on higher timeframes before adding long positions.
Manage size. If you trade this, keep position sizing small and protect capital with stops and trailing stops when in a winning trade.
Use multi-timeframe confirmation. Don’t buy solely on daily candles. Micro structure of a daily candle forms on smaller timeframes.
If you want to accumulate, always scale. Don’t all-in. That way you better position yourself, increase your profit and decrease your loss
As always...Stay disciplined.
----------------------------------------------
Good Luck!
P.S: Check the linked idea for a better understanding.

ETHUSD | Don’t get fooled...Understand the chartTL;DR: This chart looks like what happened in 2021 in a ridiculous way. A breakout, a rejection, a relief rally, then a painful descent through layered support zones.
I really don’t want to be the guy who says “I told you so” but charts teach with loss as often as profit.
Look at what happened when ETH reached ATH in 2021. A clear breakout and immediate rejection. Price then collapsed with multiple spikes to trick HODLers and bull for life traders.
----------------------------------------------
The lesson the chart here to offer
If our analysis is correct, we’ll see a short-lived manipulation into resistance ($3.6–$4.0k) that will suck in all longs.
What happens next you may ask? Straight down to support zones.
Breaking one support usually leads to the next.
----------------------------------------------
Practical rules to survive this (educational only):
Assume rallies are traps until proven otherwise. Wait for structure (higher lows + higher highs) on higher timeframes before adding long positions.
Manage size. If you trade this, keep position sizing small and protect capital with stops and trailing stops when in a winning trade.
Use multi-timeframe confirmation. Don’t buy solely on daily candles. Micro structure of a daily candle forms on smaller timeframes.
If you want to accumulate, always scale. Don’t all-in. That way you better position yourself, increase your profit and decrease your loss
As always...Stay disciplined.
----------------------------------------------
Good Luck!
P.S: Check the linked idea for a better understanding.

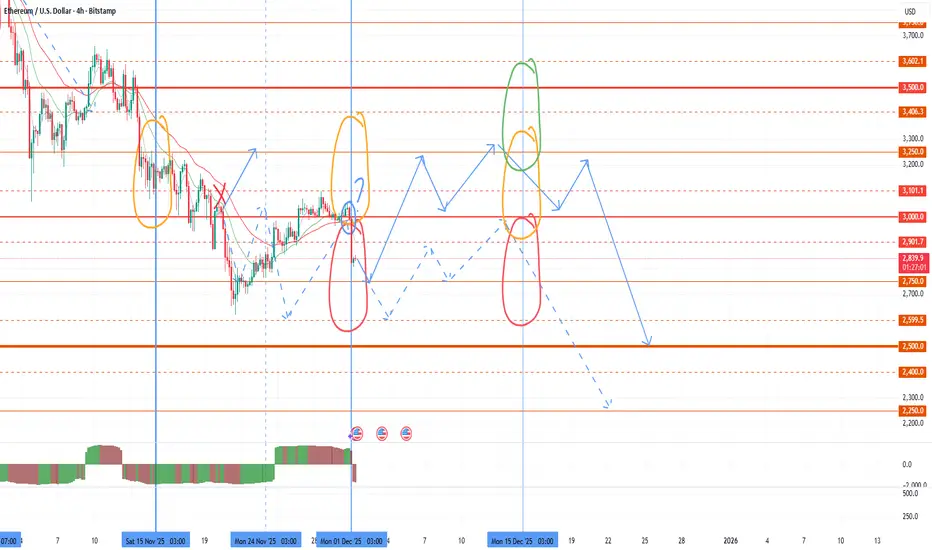
ETHEREUM HIGH PROBABILITY LONG SETUP SOON!!!🚨 ETHER HIGH PROBABILITY BUY SETUP 🚨
* Here We Can See Clearly The Next Potential Moves For ETHUSD Coming Hours/Days.
* Keep Your Eyes Close On Your Trading Positions.
* Happy PIP Hunting Traders.
FXKILLA.

VNShark OB | ETH — Sellers Take ControlETH is showing clear signs of institutional selling pressure.
Big Money has revealed its footprint after price broke below the VShark Order Block with strong volume — confirming that the higher-timeframe downtrend remains firmly intact.
Here’s the breakdown:
1️⃣ Higher-timeframe structure remains strongly bearish
ETH continues to follow the macro downtrend, with every rally failing to break key structure levels.
2️⃣ Price broke below the key VShark Order Block
This breakdown, combined with a notable volume spike, signals that buyers were overwhelmed — a classic displacement move driven by Smart Money.
3️⃣ A fresh VShark Sell Zone has formed above
This is the area where Big Money previously stepped in with visible selling pressure.
As long as ETH trades below this zone, sellers maintain full control.
🔵 VShark Sell Zone:
$2,965 – $3,108
4️⃣ Expectation: Bearish continuation
If ETH retests the Sell Zone and shows weakness or rejection, the downtrend is likely to resume.
#ETH #Ethereum #Crypto #SmartMoney #OrderBlock #OB #SupplyZone #VSharkOB #BigMoney #PriceAction #TechnicalAnalysis #CryptoTrading #Bearish #VolumeAnalysis

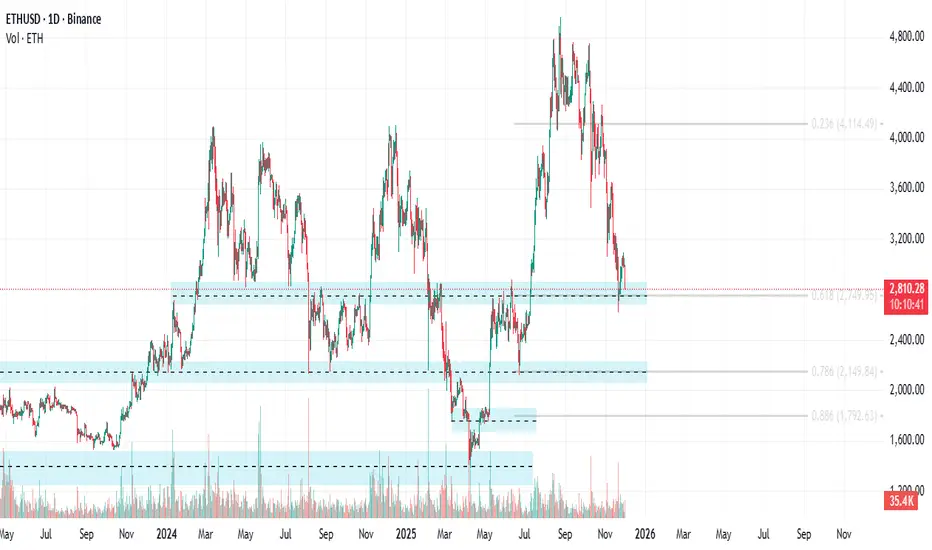
ETHSUD test area 0.618 fiboAfter breaking through resistance at $2750 in early July, Ethereum ( CRYPTOCAP:ETH ) is attempting to establish it as new support, which is also the 0.618 Fibonacci retracement area.
#ETHUSD - Short Term Levels (Dec 2025)Date: 01-12-2025
#ETHUSD Current Price: $2,813.00
Pivot Point: $2,917.72
Support: $2,777.37
Resistance: $3,059.33
Upside Targets:
--------------------------------
| Target | Price |
---------------------------------
| 🎯 Target 1 | $3,241.31
| 🎯 Target 2 | $3,423.28
| 🎯 Target 3 | $3,612.87
| 🎯 Target 4 | $3,802.45
Downside Targets:
| 🎯 Target 1 | $2,594.77
| 🎯 Target 2 | $2,412.16
| 🎯 Target 3 | $2,222.58
| 🎯 Target 4 | $2,032.99
#Crypto #Bitcoin #BTC #CryptoTA #TradingView #PivotPoints #SupportResistance

ETHUSD SIGNALThis signal is generated using a disciplined, data-driven approach that evaluates price action, trend dynamics, and liquidity distribution. The trade setup highlights a moment where market conditions align to create a balanced opportunity with a favorable risk-to-reward profile.
The analysis emphasizes precision and clarity, focusing on key decision zones where buyers or sellers are most likely to take control. This signal is crafted to help traders navigate the market with structure, consistency, and confidence.
📌 Signal Breakdown
Entry Level: Identified through market structure validation and momentum confirmation
Stop-Loss (SL): Placed at a strategic invalidation zone for controlled downside risk
Take-Profit (TP): Target levels modeled around liquidity pockets, trend projections, and volatility range
Technical Reasoning: A brief yet clear explanation outlining the logic behind the chosen direction
Market Scenarios: Expected price behavior under both bullish and bearish conditions
⚠️ Disclaimer
This signal is not financial advice and is intended solely for analytical and educational purposes. Always manage your risk appropriately and stay adaptable to changing market conditions.

Crypto Panic and DUMP!?We have just had a MAJOR dump over the last 12 hours in the crypto market.
This was expected, as we are expecting MANIPULATION to take place - and this usually happens in the beginning of the month.
I'd like to see the previous months low of NOV get taken out, creating further fear in the markets making everyone believe the true bear marketc is here. The idea is to flush everyone out of the market and make them believe its over, and once we get that, price will likely move AGGRESSIVELY to the upside.
The biggest sign for us right now to convince me we are not yet in a bearish cycle is the MONTHLY NOV close on TOTAL.
We still do have a lot of downside risk but ideally I'd like to see DEC close pretty strongly bullish.
⚠️ Disclaimer:
I am not a financial advisor. The content shared on this channel is for educational and informational purposes only and should not be considered financial advice.
Trading and investing in cryptocurrency involve high risk — you could lose some, or all, of your money. Always do your own research and make sure you understand the risks before making any financial decisions.

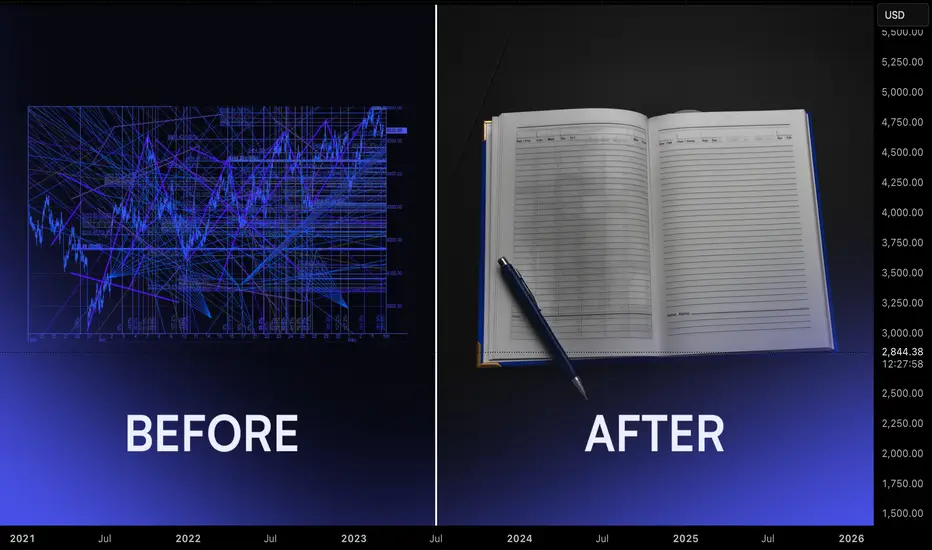
Journaling For Traders: Turning Random Results Into A Feedback Most traders spend years tweaking indicators and strategies while leaving their process undocumented. Without a journal, every trade feels new, every mistake repeats, and progress stays vague. A structured journal turns experience into data. It shows what you do well, what keeps failing, and which behaviours appear before your best and worst decisions.
The first step is simple: record every trade. Log the setup, market structure, entry reason, risk, and emotional state. Write whether you felt rushed, confident, bored, or frustrated. Do not only record wins or big losses. Incomplete data keeps blind spots alive.
The real value appears during weekly review. Set time aside after markets slow down and go through the trades as a batch. Look for recurring situations. You may notice that late-session entries perform poorly, that you increase size after wins, or that you cut trades early when size feels uncomfortable. These patterns are not visible inside a single session. They emerge only over a cluster of trades.
Next, extract insights. Group trades by setup, session, and emotional state. Identify your highest quality combinations. For example, trend continuation trades in London with fixed risk might show a strong performance profile while countertrend entries in low volume hours consistently underperform. This step separates what you think works from what actually delivers.
Finally, adjust strategy. Turn observations into rules. Reduce or remove the behaviours that repeatedly drain capital. Formalise the conditions that define your best trades. Add small process rules rather than full rewrites, then track the impact in the next review cycle. Over time, your playbook becomes evidence based rather than theoretical.
Journaling is not an extra task for perfectionists. It is the operating system behind professional execution. When you continuously record, review, extract, and adjust, your trading process compounds in quality even when individual weeks are difficult.
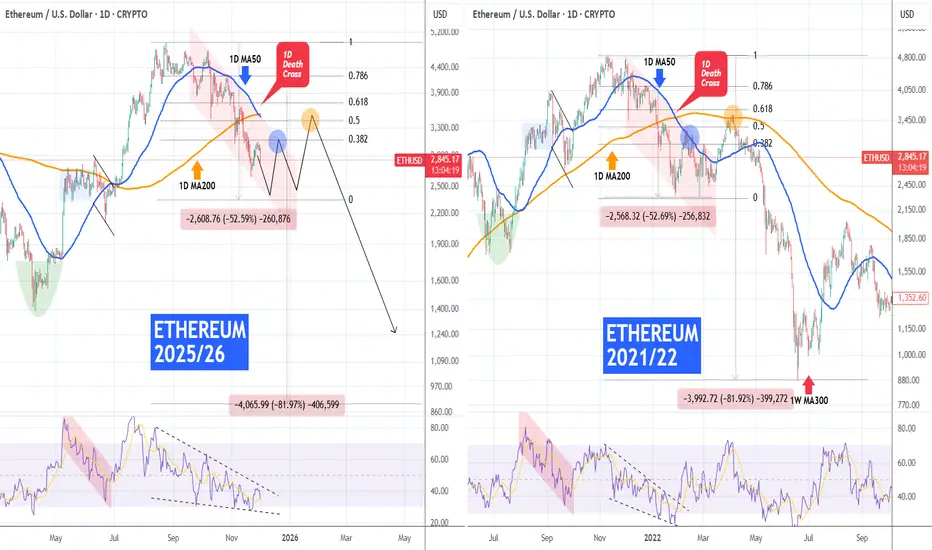
ETHEREUM made 1D Death Cross. Will it follow the 2022 BearCycle?Ethereum (ETHUSD) completed on Saturday its first 1D Death Cross in 9 months (since February 28 2025) and today the market is (so far) reacting violently to it with a strong sell-off.
The market didn't even manage to re-test its 1D MA50 (blue trend-line) on last week's rebound and if it follows the 2022 Bear Cycle, it may look for a bottom after completing a -52.50% decline from its Cycle Top. Technically, even the build up to the Cycle Top resembles the 2021/22 fractal and as you can see the similarities are even evident on their 1D RSI sequences.
As a result, if this 1st Bear Cycle wave for ETH bottoms around $2400, we could be expecting a first rebound to test the 1D MA50 (within the 0.382 - 0.5 Fibonacci range, i.e. around $3100) and get rejected, followed by one last to test the 1D MA200 (orange trend-line), within the 0.5 - 0.618 Fibonacci levels (i.e. above $3350) and get rejected to start the 2nd wave of the Bear Cycle.
Would you 'trust' this Bear Cycle build up?
---
** Please LIKE 👍, FOLLOW ✅, SHARE 🙌 and COMMENT ✍ if you enjoy this idea! Also share your ideas and charts in the comments section below! This is best way to keep it relevant, support us, keep the content here free and allow the idea to reach as many people as possible. **
---
💸💸💸💸💸💸
👇 👇 👇 👇 👇 👇
An Attempt at Seasonal Market Growth and BTC RollbackTo date, we have reached another bifurcation point in the market and it's time for another review. So far, there is a share of positivity in the market situation. As I wrote earlier, there is strong medium-term support for BTC in the 85-90k zone, from which a rollback is likely. Unfortunately, last month we broke through the 85k level, which is a signal for a possible test of 75k in the spring. However, the probability of a rollback from 85k to 90-100 still prevails. The broadcast opened the month ambiguously. According to Asian time, the opening is in the negative zone below 3000, higher in the neutral zone at GMT. I think the market will move this month based on the bullish BTC signal, and the coins will continue to move in different directions.
The seasonal growth period in the first half of December is also a positive signal. Once again, I would like to draw attention to the background trigger used by the United States to manipulate the market - brent oil. At the last bifurcation point, prices still collapsed, despite the positive data on US stocks, to which ETH immediately reacted with a consolidation below 3k, as I warned in the review. The current monthly candle opened above the interim support of $ 62.5, against which there is a signal for growth in the first half of the month at least.
As a result, we have signals for new growth waves for individual altcoins that have reached supports and have high growth goals, as part of seasonal growth, attempts to rollback BTC with oil and rollback according to the annual schedule. However, most of the alcoins, especially those with high capitalization or upcoming aggressive issuance, will not have time to show significant growth in this short period and will continue the medium-term bearish trend. Be careful with new purchases in the next couple of weeks. Today - tomorrow is the time when coins draw a shadow down the new monthly candle, but starting tomorrow evening or Wednesday, the probability of a reversal for individual coins will increase. If positive oil data is released in the middle of the week, then the growth of the crypt is likely to accelerate steadily by the end of the week, with a continuation in the next weekly candle. Next, the opening zone of the second half of the month will be of great importance.
For altcoins, in the event of a reversal attempt, the minimum target will be to overshoot the last monthly candle. For work today, I am considering the TURTLE NTRN ENSO VIC MITO BMT HOOK first of all. These tools were recently listed on binance, which reduces the threat of delisting hanging over projects from 20-22. The issue of these instruments is also smooth, which reduces the likelihood of further large drawdowns. Given today's circulating supply, these instruments are already in an oversold position and the likelihood of a reversal to growth at the slightest provocation from the market prevails. They also previously provided strong technical signals for growth up to 300%+, which will be worked out in the medium term.
Secondly, I am considering CHESS UTK COS DATA QUICK FIO for scalping, which can give new growth waves of up to 40-50% at least, but I recommend using a smaller position size for them. CHESS has been assigned the monitoring tag, but there are strong technical signals for a 0.1 retest, which is why a large exit pump is likely. After that, I will no longer consider using the token.
ETHUSD H1 | Bullish Bounce Off SupportMomentum: Bullish
Price is currently above the ichimoku cloud, and is still above the ascending trendline.
Buy entry: 2,982
- Overlap support
- 50% Fib retracement
Stop Loss: 2,896.63
- Swing low support
Take Profit: 3,076.67
- Swing high resistance
High Risk Investment Warning
Stratos Markets Limited (tradu.com/uk ), Stratos Europe Ltd (tradu.com/eu ):
CFDs are complex instruments and come with a high risk of losing money rapidly due to leverage. 70% of retail investor accounts lose money when trading CFDs with this provider. You should consider whether you understand how CFDs work and whether you can afford to take the high risk of losing your money.
Stratos Global LLC (tradu.com/en ): Losses can exceed deposits.
Please be advised that the information presented on TradingView is provided to Tradu (‘Company’, ‘we’) by a third-party provider (‘TFA Global Pte Ltd’). Please be reminded that you are solely responsible for the trading decisions on your account. Any information and/or content is intended entirely for research, educational and informational purposes only and does not constitute investment or consultation advice or investment strategy. The information is not tailored to the investment needs of any specific person and therefore does not involve a consideration of any of the investment objectives, financial situation or needs of any viewer that may receive it. Past performance is not a reliable indicator of future results. Actual results may differ materially from those anticipated in forward-looking or past performance statements. We assume no liability as to the accuracy or completeness of any of the information and/or content provided herein and the Company cannot be held responsible for any omission, mistake nor for any loss or damage including without limitation to any loss of profit which may arise from reliance on any information supplied by TFA Global Pte Ltd.
