ETH: Get Ready for the Final Rally (Elliott Wave 5)CRYPTOCAP:ETH is now in the 4th wave of a major uptrend. The next move is expected to be the final and powerful 5th wave.
What to watch for:
Wave 5 Target: Typically, the 5th wave is less dynamic than the 3rd, but it can still be a strong move. Look for it to be equal in length to Wave 1, or a Fi
Key data points
Previous close
—
Open
—
Day's range
—
About Ethereum
Ethereum — the world’s second-most famous blockchain network — is a platform for creating decentralized applications based on blockchain and smart contract technology (a command that automatically enforces the terms of the agreement based on a given algorithm). It's the chain that birthed DeFi (decentralized finance) and started the NFT craze which saw billions of dollars pour into cryptocurrency. Safe to say, it's one of the big dogs.

ETH Dip Before ATHSimple strategy using bolinger bands and various moving averages. Liquidity zone is around $4100. Expect to dip into that and maybe wick lower before the next leg up and break through ATH.

ETHERIUM Obeying The Elliott Wave(Updates and corrections)This is an update and minor correction of a previous post(link below). As posted earlier, the analysis remains the same till Wave 4(Blue) is complete. After this we saw a 5 wave move marked in Green but this was too small to be our Wave 5(Blue) for the Major Wave. This in turn is our Wave 1(Black).

#ETH #ETHUSDT #ETHEREUM #Analysis #Update #Eddy#ETH #ETHUSDT #ETHEREUM #Analysis #Update #Eddy
According to the formed pattern, namely QM in the RTM style on the weekly block breaker, I expect an upward movement and a ceiling hunt and an ATH of Ethereum, and also in the ICT and liquidity styles, I expect a Fake BOS and a drop to the weekly blo

ETHUSD bullish analysisTechnical analysis for ETHUSD.
Simplistic bull count that has price in corrective wave ((4)) of primary wave iii, expecting wave ((5)) of iii to be extended, target north of 8k.
Wave ((4)) needs to complete above end of wave ((1)), so bullish above 4093.50.

ETH BullcountFrom a momentum perspective, this would be a better fit, and it would also align with an ETH/BTC outperformance scenario, offering cleaner extensions within the wave structure.

ETHUSD 4 Hour Chart. Wave 3 possible targetsAs ETHUSD becomes more bulish, possible targets for this extended Wave 3 we are currently surfing.

ETh EW COunt I’m not a fan of the short wave 3 and wave 5 in that approach, but it could align with a potential Ending Diagonal Triangle (EDT). Also, since we haven’t taken out the all-time high, I’d still consider going long if strong setups occur (NFA)

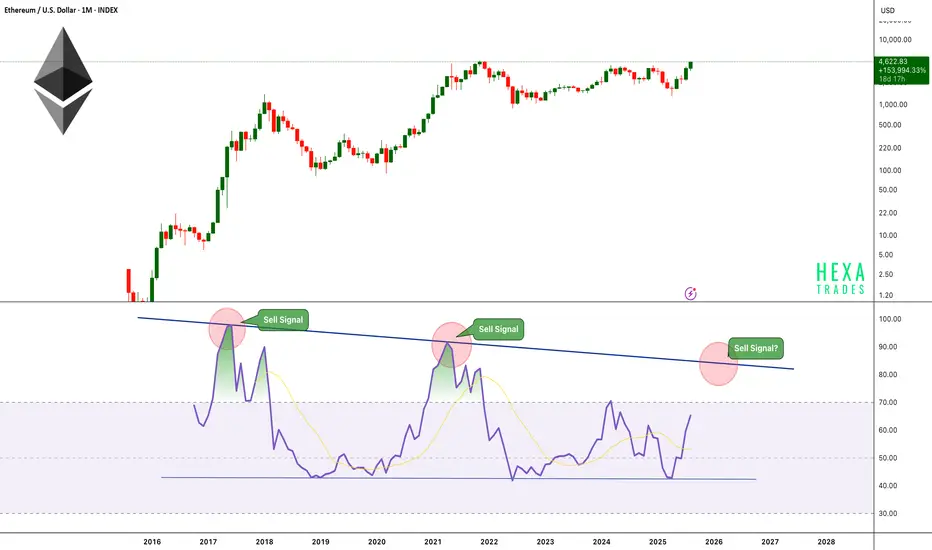
ETH Monthly RSI Approaches Cycle Top? Ethereum is showing strong momentum on the monthly timeframe, pushing toward levels not seen since its previous all-time highs. However, a critical technical indicator, the Monthly RSI is currently at 65 and steadily approaching its historically reliable sell zone between 83–85.
Key Observations:
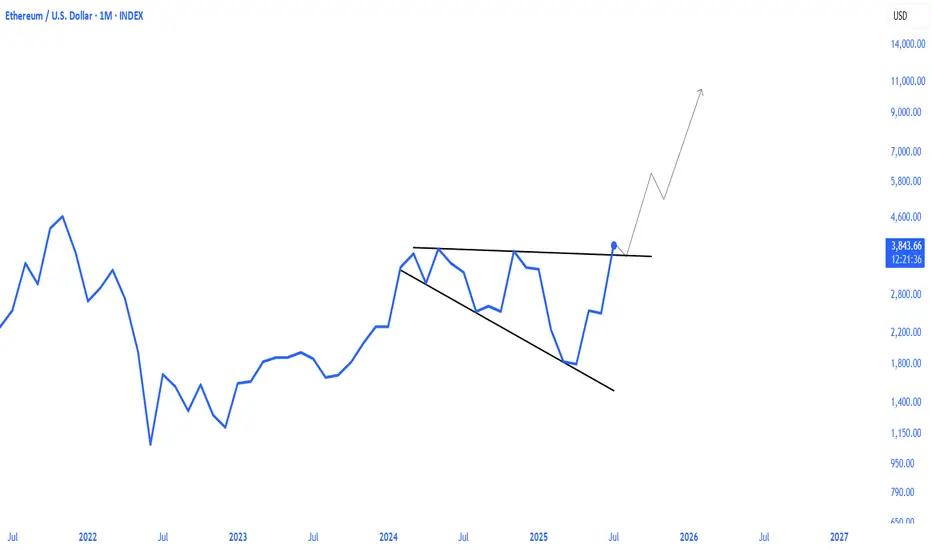
ethereum breakout bullish megaphone pattern ETHEREUM broke the bulish megaphone pattern in the 1M timeframe. it will continue to rise after the retest phase that will occur with the monthly closing today.
See all ideas
Displays a symbol's price movements over previous years to identify recurring trends.