THE CHART DOESN'T LIE: A NEW DAWN FOR ETHEREUM
🔍 TECHNICAL ANALYSIS
1. The long-term downtrend , which lasted approximately 3.5 years, has been **broken on the monthly chart**, signaling a confirmed breakout (BO).
2. The horizontal resistance level at 4045 USDT is a critical zone. This is expected to act as the next stop following the breakout. A clear breach of this level could potentially lead to **more aggressive upward movements**.
Note: We do not consider the all-time high at 4631 USDT to be a major resistance, as it previously acted not as a strong sell zone but rather as a **momentum acceleration point**. With the entry of new investors and resulting FOMO (Fear of Missing Out), we anticipate minimal resistance around this level.
3. Since its launch in 2016, the **MACD indicator** has issued three **buy signals** on the monthly timeframe:
* Two resulted in strong bull runs .
* One led to a ** 60% rally **.
* Currently, a new bullish crossover is forming.
4. The RSI indicator has historically provided clear insight into when rallies may begin to slow. In particular, the 88 level and above has marked overbought territory, which could be a suitable area for gradual profit-taking .
5. Important Fibonacci-based accumulation zones are located between 3262 and 2697 USDT.
🧠 FUNDAMENTAL ANALYSIS
1. Smart Contracts
Ethereum is a programmable blockchain that enables the execution of smart contracts—automated agreements without intermediaries.
🧠 Example: “If Team A wins, send payment automatically.”
2. Decentralized Application Platform (dApps)
Ethereum empowers developers to build dApps whose data is stored across the network, not on centralized servers—making it resistant to censorship.
3. Foundation of DeFi and NFT Ecosystems
* Most DeFi platforms (lending, staking, earning interest) are built on Ethereum.
* Roughly 80% of NFTs originated on Ethereum (OpenSea, Bored Ape, CryptoPunks, etc.).
4. Approval of Spot Ethereum ETFs (U.S.)
* Following Bitcoin ETFs, some Ethereum spot ETFs have been approved.
* This has **opened the door to institutional investment**, creating **upward price pressure**.
5. ETH 2.0 Upgrade & Staking
* Ethereum transitioned from Proof of Work to Proof of Stake, making the network more sustainable and scalable.
* Users can now stake ETH to earn passive income.
6. Enterprise Adoption
* Corporations such as Visa and JPMorgan are testing Ethereum’s infrastructure.
* Use cases: payments, data storage, contract management.
7. Favorable Regulatory Shifts Support Altcoins
* U.S. laws like GENIUS and CLARITY have laid a framework for stablecoins.
* This has increased institutional interest in **infrastructure coins** like Ethereum and Solana.
8. Capital Rotation into Altcoins
* While Bitcoin consolidates between \$115K–\$118K, capital is flowing into altcoins.
* Tokens like XRP, DOGE, BONK, PEPE, HYPE have surged.
* XRP is particularly favored due to its enterprise use case, with price targets of \$4–\$6 being speculated.
9. Growth in Futures and Institutional Trading
* CME Group data shows growing open interest in Solana and XRP futures.
* ETH farms also reflect strong institutional interest, as companies begin to hold crypto assets under treasury models.
10. Risks to Monitor
* Potential downward pressure may come from **Fed rate decisions**, **ETF inflows/outflows**, *miner selling, or regulatory actions (e.g., MiCA).
* Altcoins remain volatile and sensitive to regulation.
💹 IN SUMMARY – Key Accumulation Zone:
3262 – 2697 USDT
We haven't provided detailed Ethereum analysis in a while, as both technical and fundamental structures often require time to form. In short: not all assets are worth analyzing until they are.
"Wealth does not come from the number of trades, but from the patience to wait for the right trade." – Bull Investment
⚠️ DISCLAIMER:
Maintain proper capital and risk management to protect your psychology during market corrections.
This analysis is for educational purposes only and does not constitute financial advice. Making decisions based on this commentary may lead to losses.
Avoid following unverified tips and rumors.
ETHUSD trade ideas

ETHEREUM ELLIOTT WAVE: BULLISH MEGAPHONE BREAKOUT TO $10K? ETHUSD Analysis | Daily Timeframe
Current Price: $3,866
Bias: BULLISH 🟢 CONFIRMED
Pattern: Elliott Wave 5 + Bullish Megaphone
Status: 🔥 MOMENTUM BUILDING 🔥
THE SETUP - BULLISH CONFIRMATION
Elliott Wave Count:
✅ Wave 1: Completed at $4,100 (March 2024)
✅ Wave 2: Corrected to $1,600 (August 2024)
🔄 Wave 3: IN PROGRESS → Target $6,000-$6,200
⏳ Wave 4: Expected pullback to $2,800-$3,200
🎯 Wave 5: ULTIMATE TARGET $10,000+
Bullish Megaphone Pattern:
Expanding triangle since June 2022 low
Key breakout level: $4,100-$4,200 (APPROACHING)
Pattern height: $2,50
Measuring objective: $6,600
🎯 UPDATED PRICE TARGETS
T1: $4,700 (+21.6% gain) - 95% probability
T2: $5,290 (+36.8% gain) - 95% probability
T3: $6,245 (+61.5% gain) - 83.5% probability
🥈 SECONDARY TARGETS
T4: $7,200 (+86.2% gain) - 68% probability
T5: $8,745 (+126.2% gain) - 53% probability
🏆 MOONSHOT TARGET
T6: $10,000+ (+158.7% gain) - 16.8% probability
⚠️ UPDATED RISK MANAGEMENT
🛡️ SUPPORT LEVELS (Bull Market Invalidation)
S1: $3,737 (-3.3% from current) - 1st warning
S2: $3,648 (-5.6% from current) - 2nd warning
S3: $3,546 (-8.3% from current) - 3rd warning
S4: $3,356 (-13.2% from current) - MAJOR SUPPORT
🔴 STOP LOSS OPTIONS
Conservative: Below $3,356 (-13.2% risk)
Aggressive: Below $3,546 (-8.3% risk)
Tight: Below $3,737 (-3.3% risk)
🔥 UPDATED ENTRY STRATEGY
🟢 CURRENT ENTRY (RECOMMENDED)
Entry: $3,866 (current levels)
Stop: $3,356
Risk: -13.2%
R:R to T3: 1:4.7 (Excellent!)
🟡 BREAKOUT ENTRY
Entry: Above $4,200 (confirmation)
Stop: $3,737
Risk: -11.0%
R:R to T3: 1:4.4
🔵 PULLBACK ENTRY (If Available )
Entry: $3,450-$3,555 range
Stop: $3,356
Risk: -2.7%
R:R to T3: 1:18+ (Exceptional!)
🧠 ELLIOTT WAVE PSYCHOLOGY - ACCELERATION PHASE
Current Phase: Early Wave 3 🚀
Status: Momentum building toward breakout
Psychology: Growing recognition
Volume: Should expand on breakout
Participation: Institutional interest increasing
What's Happening NOW:
📈 Price approaching key resistance
📊 Volume building
🌊 Wave 3 characteristics emerging
💰 Smart money accumulating
🎪 MEGAPHONE PATTERN - BREAKOUT IMMINENT
Current Status:
📐 Price at 94% of breakout level
🔊 Volatility expanding as expected
⚡ Breakout catalyst building
🎯 $6,600 target on deck
Breakout Levels:
Resistance: $4,100-$4,200 (6.1-8.6% away)
Volume: Need 2x average on breakout
Target: $6,600 minimum (+70.7% gain)
🎲 UPDATED $10K PROBABILITY ANALYSIS
📊 SCENARIO BREAKDOWN (From $3,866)
🟢 Optimistic (40% probability)
Gain Required: +158.7%
Timeframe: 6-18 months
Catalyst: Parabolic Wave 5 + Major news
🟡 Moderate (25% probability)
Gain Required: +158.7%
Timeframe: 1-2 years
Catalyst: Institutional adoption wave
🔴 Conservative (15% probability)
Gain Required: +158.7%
Timeframe: 2-3 years
Catalyst: Extended crypto bull market
📈 WEIGHTED AVERAGE: 24%
🎯 RISK-ADJUSTED: 16.8%
🔍 IMMEDIATE CATALYSTS TO WATCH
🟢 BULLISH MOMENTUM DRIVERS
✅ Price approaching breakout zone
✅ Elliott Wave 3 acceleration
✅ Institutional accumulation
✅ DeFi TVL growth
✅ Layer 2 adoption
⚠️ NEAR-TERM RISKS
🔴 Rejection at $4,100-$4,200
🔴 Bitcoin correlation breakdown
🔴 Macro headwinds
🔴 Profit-taking pressure
📅 UPDATED TIMELINE EXPECTATIONS
📍 Next 2-4 weeks: Test $4,100-$4,200 breakout
📍 Q4 2025: Rally to $6,000-$6,200 (if breakout)
📍 Q1 2026: Potential Wave 4 correction
📍 Q2-Q4 2026: Wave 5 extension → $10,000+ potential
💡 UPDATED TRADING PLAN
🎯 POSITION SIZING (From $3,866)
Core Position: 60% at current levels (PRIORITY)
Breakout Add: 25% above $4,200
Pullback Add: 15% on any dip to $3,450-$3,555
💰 PROFIT TAKING STRATEGY
20% at $4,700 (lock in +21.6%)
25% at $5,290 (secure +36.8%)
25% at $6,245 (major target +61.5%)
30% HODL for $10K+ (moonshot +158.7%)
⏰ TIME MANAGEMENT
Immediate: Watch for $4,200 breakout
Short-term: Reassess if below $3,737
Long-term: Major review if below $3,356
🚨 URGENT UPDATE SUMMARY
🔥 WHAT CHANGED:
Price up +5.2% to $3,866 (bullish confirmation)
Now only 6.1% from key breakout at $4,100
Risk/reward ratios improved significantly
Momentum building toward critical resistance
⚡ IMMEDIATE ACTION:
BUY SIGNAL ACTIVE at current levels
Stop loss: $3,356 (-13.2% risk)
First target: $4,700 (+21.6% gain)
R:R = 1:4.7 (Excellent setup!)
🎯 KEY LEVEL TO WATCH:
$4,100-$4,200 = Make or break zone
Break above = Explosive move to $6,600+
Rejection = Pullback to $3,450-$3,555
🔮 BOTTOM LINE - UPDATED
The Setup: Even stronger! Price action confirming Elliott Wave count with momentum building toward the critical $4,100-$4,200 breakout zone.
The Opportunity: Now at $3,866, we're positioned perfectly for the next leg up. Risk/reward of 1:4.7 to major target is exceptional.
The Risk: Manageable at -13.2% to major support at $3,356.
The Play: BUY NOW - This is the sweet spot before the breakout. Scale in aggressively at current levels.
📊 UPDATED CHART FOCUS
🎯 CURRENT PRICE: $3,866 (+5.2% momentum)
📈 IMMEDIATE TARGET: $4,200 breakout (+8.6%)
🚀 HIGH PROBABILITY: $6,245 (+61.5%)
🌙 MOONSHOT: $10,000+ (+158.7%)
🛡️ STOP LOSS: $3,356 (-13.2%)
⚡ PATTERN: Bullish Megaphone + Elliott Wave 3
🚨 TRADE ALERT: BUY SIGNAL ACTIVE 🚨
Entry: $3,866 (NOW)
Stop: $3,356
Target 1: $4,700
Target 2: $6,245
Moonshot: $10,000+
⚠️ DISCLAIMER: This analysis is for educational purposes only. Cryptocurrency trading involves substantial risk. Always do your own research and never risk more than you can afford to lose.

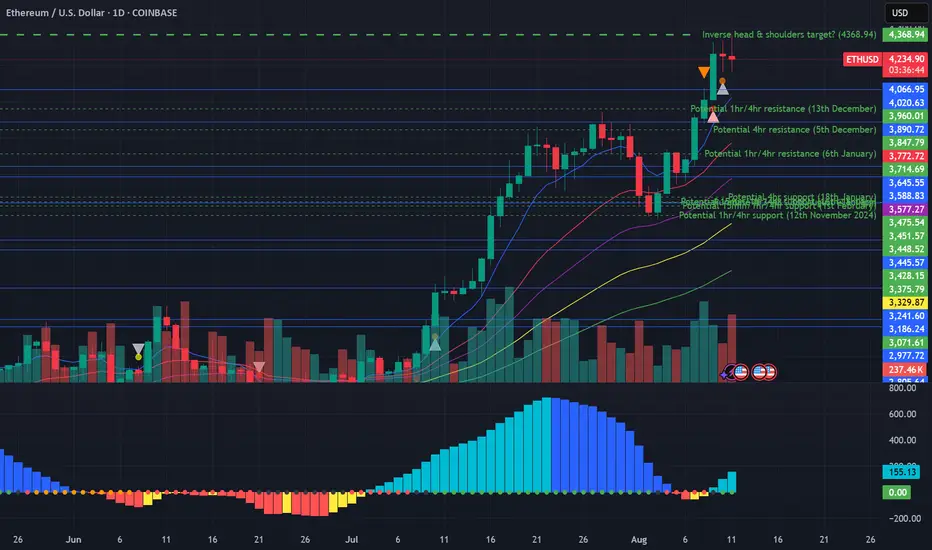
Potential inverse head and shoulders target reached on EthereumWell... nearly reached at this stage anyway. In a similar vein to Dow Theory (in which you would normally expect that the Dow Jones Industrial Average would rise alongside the Dow Jones Transportation Index, the Nasdaq Composite, the SP500 and the Russell 2000 indices), let's suppose you would expect that Ethereum would rise alongside Bitcoin and the other altcoins.
Let's face it, Ethereum has had a great run recently, but what has Bitcoin been doing over the past month in particular? Literally nothing. Zero, zilch, nada... But why am I bringing up caution at this stage whilst everyone is so bullish about Ethereum? Let's scale out. If you look very far out to earlier this year, there was spike down in February for Ethereum (which formed a 'left shoulder' downward), and further retracement in share price downward to the ultimate low in April two months later to form the 'inverted head', followed by upward movement to form the inverted 'right shoulder' in late June.
This allows us to draw a 'neckline' at around about the 2880 level. Extending calculations from this neckline to the inverted head provides a range of approximately 1400, but when utilising exact numbers utilising charting software, and extending this range upwards from the neckline northwards provides a potential target of 4,368.94, which is fairly close to where we've been recently (the high of 4,333.13 about 2 hours ago at the time of writing).
Unless Bitcoin can get itself moving, as well as Ethereum turn around with respect to the one hourly momentum, tread cautiously and consider the possibility that the target may be reached of this head and shoulders target for Ethereum (thus, neutral bias at this stage, with potential to turn bearish).
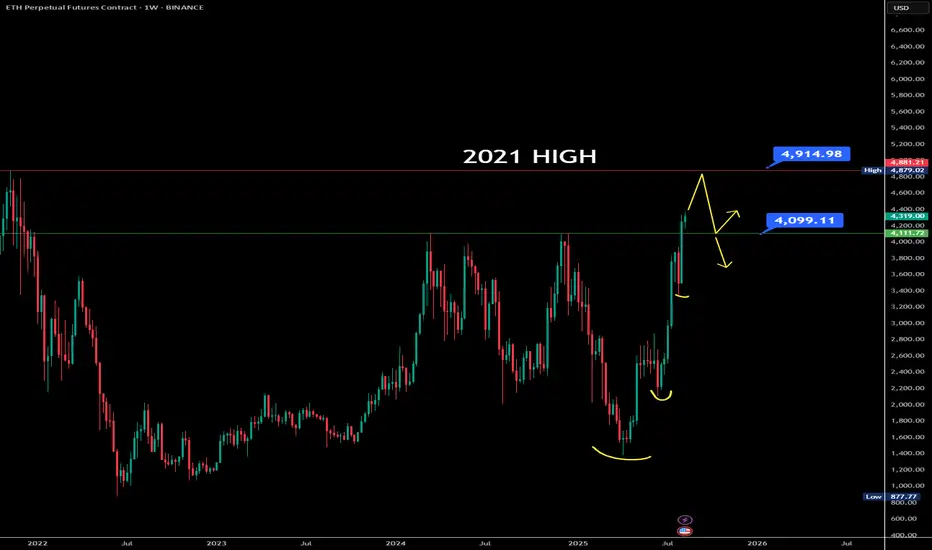
$ETH breakout leading to test 5000$Over the past three months, Ethereum has been consistently forming higher lows, starting from the ~$1,362 level, showing a strong and sustained uptrend. Recently, ETH decisively broke above the $4,100 resistance zone, which had previously rejected price action three times.
With this breakout, I’m not expecting an immediate retest of $4,100. Instead, price may continue its rally toward the 2021 all-time high near $4,900. Only after testing that level could we see a pullback to retest the $4,100 zone or even fill the small gap near $4,050.
On the fundamentals side, ETH ETF inflows remain positive on a daily basis, signaling strong institutional demand. Combined with increased whale accumulation, buying pressure continues to dominate.
Earlier, I considered this area for a potential short, but the price action and on-chain data now clearly indicate this is not a shorting opportunity—momentum remains bullish.
Extreme Euphoria - ETH weekly update August 11 - 17thFrom an Elliott Wave perspective, Ethereum is likely advancing within Cycle degree Wave 3, Primary degree Wave 5, at the end of Intermediate degree Wave 3, and in Minor degree Wave 5. While theoretical upside targets for this structure have already been met, ETH has shown little sign of slowing down. On lower timeframes, the price action suggests the move is not yet complete.
The first alternative scenario would see the current wave extending further upward. The second, less probable alternative, would classify the move as part of an ongoing corrective formation — but the structure lacks the characteristics to strongly support this view.
Liquidity analysis reveals significant clusters below the low of Intermediate Wave 4 on the heatmap. In the order book, notable sell orders are stacked above the current price at $4,500 and $5,000 — levels of interest because they align with key technical confluences. Additionally, a Fair Value Gap (FVG) appears on the 1-hour chart, suggesting the possibility of a short-term pullback before price resumes its move toward the main target zone.
Funding rates are in a normal positive range and open interest is rising but beginning to flatten, signalling a steady but maturing uptrend. It’s worth noting that these funding rates have recently come down from elevated highs, indicating that the market was previously overheated.
ETH ETF flows remain steadily positive, but as mentioned in the Bitcoin analysis, these inflows appear to be driven more by rising prices and associated FOMO than by deliberate accumulation.
From a sentiment perspective, the Fear and Greed Index shows the market in “Greed” territory, while Ethereum’s own index indicates extreme greed. On LunarCrush, mentions of ETH are increasing, reflecting heightened market attention. However, sentiment measured per network interaction remains mostly neutral — a divergence that is worth monitoring.
In summary, caution is warranted at current levels. The primary target remains the 2.618 Fibonacci extension around $4,500, where a confluence of liquidity, order book resistance, and Elliott Wave projections converge. This level stands out as the most probable area for the current wave to complete before any significant correction.
Trade safe.

ETHEREUM: The $4,000 Triangle - Breakout or Breakdown?🎯 THE MEGA SETUP: Giant Symmetrical Triangle
🔍 What We're Looking At: 📐 Triangle Specifications:
🟢 $3,042.00 - Triangle Lower Trendline
🟢 $2,875.00 - 1W FVG (Fair Value Gap)
🔴 $4,087.00 - BSL (Buy Side Liquidity)
🔴 $4,200.00 - Psychological barrier
_______________________
🛡️ CONSERVATIVE LONG:
Entry: $2,800 - $2,850 (Triangle support bounce) 📊
Stop Loss: $2,740 (Below triangle) ❌
Targets: $3,500 → $3,800 → $4,200 🎯
! Smash that follow button for more killer setups! 🔥📊
____________ NOTE __________
⚠️ RISK MANAGEMENT
⚠️ DYOR
Remember: No setup is guaranteed. Always manage risk and never invest more than you can afford to lose.

ETH to hit $12,000?Ethereum’s monthly chart now resembles Bitcoin’s structure before its 2020 massive breakout. Could this mean COINBASE:ETHUSD is going to hit $12000?
Here is the explanation:
www.cointrust.com

ETH ROAD TO 20K+I think we are getting closer to the final accumulation stage on ETH.
We can see a potential shape of huge channel in log scale.
After forming median of the channel I would like to see a big and fast correction near 30% from here towards 2900 support which must hold imo.
After that test of smthg around 3600 rgion and double bottom would be the best option just before few months of consolidation before breaking up and starting blow off top part.
Top of that channel depends on timing so the later the better I guess.

ETH/USD – 1H | Liquidity Run to OB in Play Price is holding below the P1D High/Swing High, showing signs of weakness after multiple failed attempts to break higher.
If structure plays out, expecting a liquidity sweep toward P1D Low and further delivery into the OB + Equal Low zone.
MMC Key Points:
P1D High rejection → potential liquidity run
Multiple Strong Lows acting as interim targets
Final delivery into deep Order Block near Equal Lows
Watch for reaction at OB for potential reversal setups
Levels to Watch:
Resistance: 4,326 – 4,273
Support Zones: 4,162 / 4,080 / 3,920 OB
🎯 Plan: Monitor for short entries on pullback to resistance zones; target liquidity pools below.

Eth in WYCKOFF Distribution SchematicEth is in a type 1 wyckoff distribution schematic. I am looking for a higher high in the light red supply zone before selling off in a manipulation. I’ll be buying the dip if I see proper accumulation

ETHUSD big bada boomClearly after finishing 3rd wave with extended flat, we are now in 5th and looking at the first wave I can't get around this idea - it's first and the most longest wave in fifth which makes the rest 2 shorter, making it ending diagonal. The correction of the first in this diagonal is usually 60-70%, so be aware of this. Good luck trader. I'm back again.

Was that it for $ETH this year?ETH just tapped the most important level to the upside $4300, and unless it can flip the $4387ish as support and continue higher, I think that's likely it for the year. Needs to take out the top resistance to be in a full bull trend.
I'm very bullish on ETH over the long term, however, in the short term the market looks extended here and I think we can see a major correction.
Will people longing here be stuck buying the highs like they were in Dec 2024 when everyone thought we were going to new highs? TBD. But I think they might be.
Here's why:
1. I think BTC has topped in the short term . If this corrects significantly, it's going to take all of crypto with it.
2. The reason why I think BTC miners haven't really run yet, is because the overall crypto market isn't bullish yet . We need to flip the $1.2T level on the chart for the entire crypto market to be in a bull trend.
3. The charts all look very similar to how they did right before the covid drop. I don't know what causes a large move down, but I can't ignore the signs.
If you're bullish here, you want to see the $4300 level get flipped as support. However, I think it's possible that we can see the lower supports get tagged before we see the resistances get taken out. Here is my long term chart of ETH (I think we go up to $18k+).
If you don't agree, all good, keep doing your thing.
Just want to provide an alternative perspective to the bullish narrative here because it seems like the entire market believes the exact same outcome is likely.
Also note: I don't plan on shorting ETH - I do not short the crypto market - I only aim to buy lower levels.
Good luck from here on out!

Ethereum Struggles to Complete above the 0.786 Bearish 5-0 ZoneWhile on the intra-bar price action on ETH has gotten pretty excited above the 0.786 it is still worth considering that ETH has not completed any bars above the 0.786 since the breakout and that at a moments noticed much of the current price action above the main 0.786 PCZ could later find itself being filtered out of the Renko charts as a whole depending on how many Average True Ranges above the 0.786 PCZ ETH possible move.
Based on the fact that the current candle is simply still in the projection phase I'd caution longs here and remain accumulative of longer dated puts. There is also a 2x leveraged ETF of ETH called ETHU which has OTM monthly call options trading at 20-40 dollar premiums. I'd consider farming off of those premiums in the form of Bear Vertical Spreads as a way to hedge off the costs of holding the long puts.
Overall, we are still trading at the PCZ of the Bearish 5-0 which seems to also be in the similar shape of a Bearish Head and Shoulders pattern; the measure move of which could take ETH down to around $355 upon the break of $1,600

ETHUSD Is Going Up! Buy!
Here is our detailed technical review for ETHUSD.
Time Frame: 2h
Current Trend: Bullish
Sentiment: Oversold (based on 7-period RSI)
Forecast: Bullish
The market is on a crucial zone of demand 3,601.00.
The oversold market condition in a combination with key structure gives us a relatively strong bullish signal with goal 3,751.96 level.
P.S
Please, note that an oversold/overbought condition can last for a long time, and therefore being oversold/overbought doesn't mean a price rally will come soon, or at all.
Disclosure: I am part of Trade Nation's Influencer program and receive a monthly fee for using their TradingView charts in my analysis.
Like and subscribe and comment my ideas if you enjoy them!

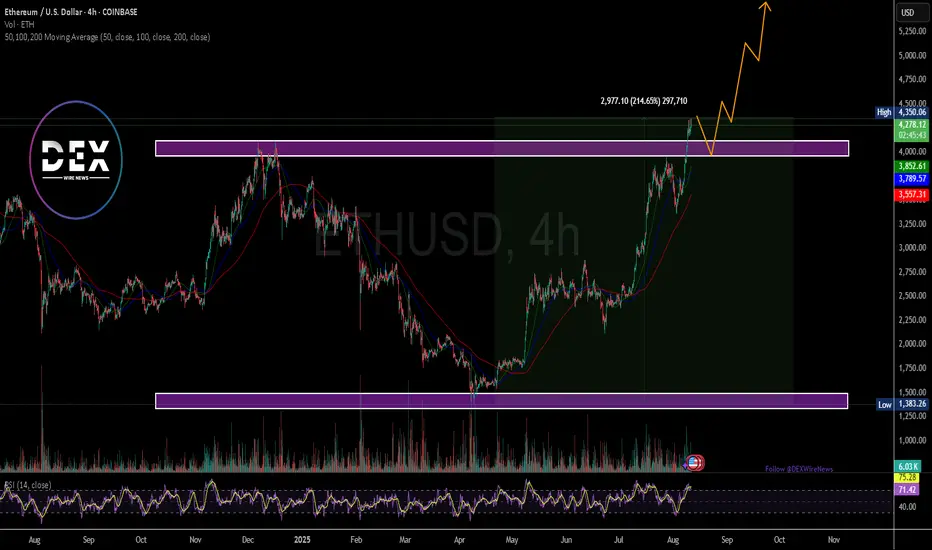
Breaking: Ethereum Is Set To Reclaim the $5k Price Pivot The price of the notable Altcoin- Ethereum ( CRYPTOCAP:ETH ) is set to reclaim the $5k resistance amidst growing interest and buying momentum.
For the past 3 months Ethereum ( CRYPTOCAP:ETH ) spiked 200+% breaking out from a cup and handle pattern amidst growing interest ikn the Ethereum chain.
Crypto Pundits on X, LinkedIn and Discord envisage the influx of memecoins on the Ethereum ( CRYPTOCAP:ETH ) chain- while most skeptics think the layer 1 blockchain is dead, Ethereum's sojourn to the $5k pivot is just days away as popular folks like Eric Trump the son of the present president of USA hints on investor's to buy Ethereum's dip.
As of the time of writing, CRYPTOCAP:ETH is up 0.58% already breaking the $4k resistance trading at $4276. With the Relative strength Index (RSI) at 71, CRYPTOCAP:ETH is on the verge of reaching overbought region. CRYPTOCAP:ETH might experience a respite before picking momentum up.
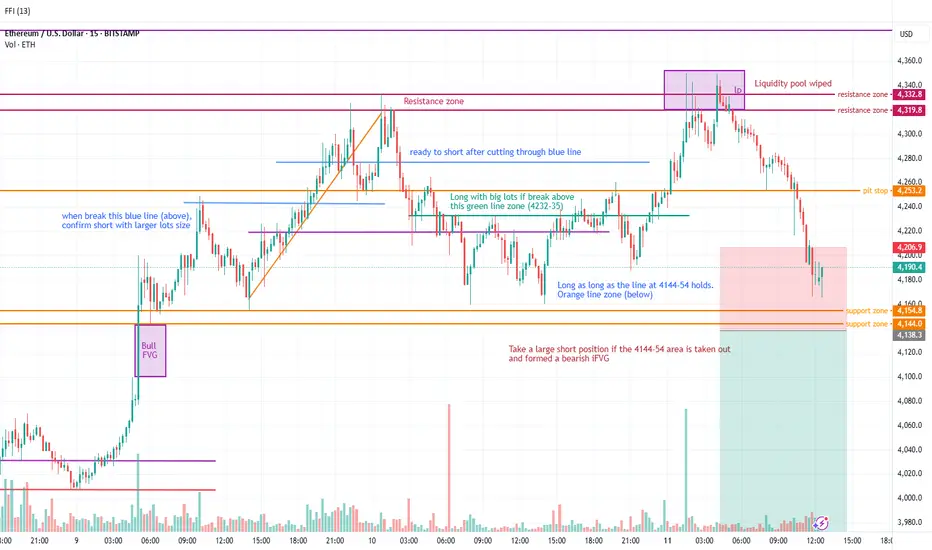
Day trading Ethereum (for both Long and Short)My analysis is based on the price action movement using liquidity pool to identify turnaround or fake manipulation move. Use FVG and iFVG to identify clear confirmation for trend movement. Price action allows me to shed light on the psychology and manipulated movement driven by market maker.
ETHUSD - Ethereum can't crack the Warning lineWe can see ETHUSD nibbling at the WL.
This currently looks like a short-term pullback.
If Ether pulls back, we will at least see the U-MLH.
After that, the centerline would be the next target before further support can be expected.

ETHUSD - Technical picture The long-term trend remains bullish: Technical picture
The long-term trend remains bullish: The price is confidently holding above the 20-, 50-, 100- and 200-day moving averages, which indicates a stable uptrend.
TipRanks indicators:
Almost all key MAs (5-200 days) are showing a “Buy” signal, with the exception of MA20 (Sell).
The current price of Ethereum (~$4,188) is significantly above all MAs, which confirms growth.
RSI (14) — 58.75 (neutral), MACD — Buy, ADX — neutral, ROC — Buy.
Result — “Strong Buy”.
TipRanks
Price levels
ETH previously relied on EMA50 (support zone), and demonstrates a continuation of the uptrend on short-term timeframes.
Economies.com
Support and resistance levels
Resistance: Near the psychological mark of $4,000 — an important barrier, the breakout of which can trigger another growth round.
Support: The standard of the ongoing bullish trend is the EMA50, as well as the levels of $3,700–$3,800, where ETH demonstrated stability.
Result
The trend remains positive: ETH is confidently above all key MAs, MACD and other signals confirm the strength of the bulls.
The key level is $4,000: breaking it can return ETH to the growth zone.
RSI at 58.8 and MACD in the Buy zone confirm the potential. However, given the overbought conditions, a small correction or consolidation is possible.
Recommendation: long positions on a rebound from support with a target of $4,000+, or entry upon a confident breakout of the resistance level.


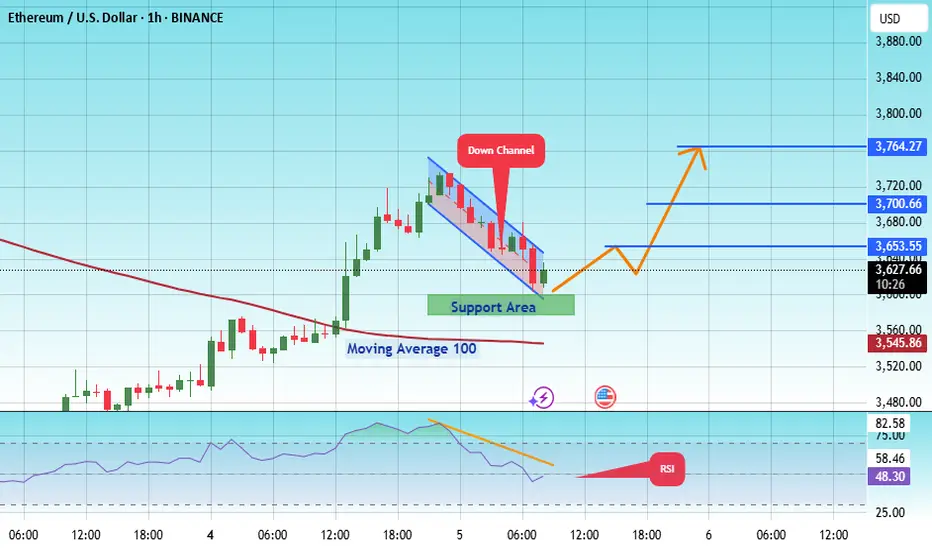
#ETH/USDT : Price is going as expected in previous ideas on eth#ETH
The price is moving within an ascending channel on the 1-hour frame, adhering well to it, and is on track to break it strongly upwards and retest it.
We have support from the lower boundary of the ascending channel, at 3593.
We have a downtrend on the RSI indicator that is about to break and retest, supporting the upside.
There is a major support area in green at 3582, which represents a strong basis for the upside.
Don't forget a simple thing: ease and capital.
When you reach the first target, save some money and then change your stop-loss order to an entry order.
For inquiries, please leave a comment.
We have a trend to hold above the 100 Moving Average.
Entry price: 3626.
First target: 3653.
Second target: 3700.
Third target: 3764.
Don't forget a simple thing: ease and capital.
When you reach your first target, save some money and then change your stop-loss order to an entry order.
For inquiries, please leave a comment.
Thank you.
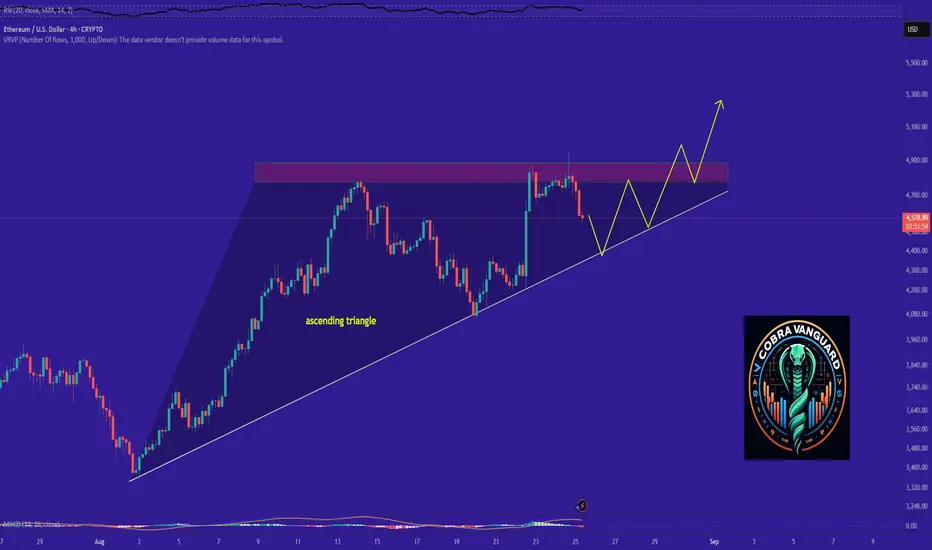
ETH is bullish now and many Traders don't see it !!The price on the 4h timeframe is within an ascending triangle, which can be promising. If the price breaks this pattern with bullish candles, it could easily rise by the distance of AB=CD .
Best regards CobraVanguard.💚
ETH LONG RESULT Ethereum traded down in a falling channel to the support zone and held the zone creating HH & HL, which was why I took the long from the next support/ retest zone.
But price didn't reach the zone and moved to our TP hence.
Still a Good Setup, Better one's to Come.
_THE_KLASSIC_TRADER_.💪🔥

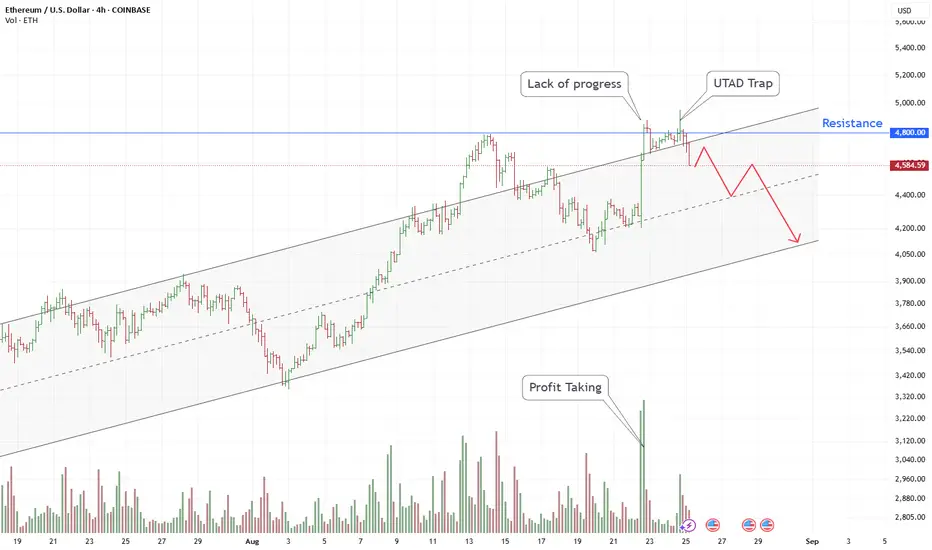
ETH/USD Chart Analysis: Signs of Weakness at the $4800 LevelDespite an uptrend since early August that has formed a stable channel, the ETH/USD price has been showing clear signs of weakness in recent days.
The chart shows that the price is struggling to advance above the key resistance level of $4800. This "Lack of progress," combined with a volume spike marked as "Profit Taking," suggests that large players ("smart money") may be selling their assets.
The recent false breakout above $4800 can be interpreted as a "UTAD Trap" (Upthrust After Distribution). Such maneuvers are often used to capture liquidity before initiating a downward phase.
Based on this, the current situation suggests the beginning of a downward correction. A likely target for this move is first the channel's midline around $4,400, after which the price may head towards its lower boundary in the $4,100-$4,200 region.