Ethereum Wave Analysis – 31 October 2025- Ethereum reversed from support level 3800.00
- Likely to rise to resistance level 4200.00
Ethereum cryptocurrency recently reversed from the key support level 3800.00 (which has been reversing the price from the start of October) intersecting with the support trendline of the daily down channel from August and the support trendline from June.
The upward reversal from the support level 3800.00 stopped the previous short term correction ii – which is a part of the impulse waves 3 and (3).
Given the clear daily uptrend, Ethereum cryptocurrency can be expected to rise toward the next resistance level 4200.00, which stopped the previous waves 1 and i.
Trade ideas

40% November Candle coming!!!Welcome to the second part of my thesis. This section takes a short-term view of price action. Several key factors support a +40% ETH rally in November, let's break them down:
LIQUIDITY: The past two months have delivered choppy price action. ETH repeatedly swept prior lows while failing to print higher highs. This reinforces short-term bearish sentiment, yet the long-term uptrend remains intact. Such consolidation is classic liquidity engineering in a bull market, its sole purpose is to harvest stops and shake out weak hands.
Key KPI: Record Liquidations – Over $2.1B in total crypto liquidations since September (per Coinglass), with $1.4B longs wiped in October alone—the highest two-month cascade on record. This flushed leveraged bulls and primed sideline capital. Short-term sentiment is now deeply pessimistic (Fear & Greed Index at 25), positioning the market for a mean-reversion squeeze.
I don’t expect a vertical moonshot. A steady grind of fifteen +3% days (average daily gain needed: 1.8%) compounds to +40% by month-end—entirely achievable in a low volatility breakout.
INCREASING SHORT INTEREST: Crypto is a short-horizon arena dominated by retail and algo traders. Prolonged sideways action erodes conviction, pushing participants to flip bearish out of boredom. Rising short interest creates upside liquidity pools—the market always hunts the crowd.
Key KPI: Perpetual futures funding rates flipped negative (-0.05% 8h avg on Binance/Bybit) for the first time since July, while open interest rose 12% amid flat price. Uptober bulls are capitulating; short interest hit a 3-month high (45% of OI on major exchanges). Exhaustion of sell pressure is imminent.
HIGHER LOW: ETH defended the mid October low on multiple retests, forming a clear higher low on the daily timeframe. This signals bearish momentum exhaustion, dips are now absorption zones, not breakdowns.
In summary: Extreme liquidations have cleared the runway, negative funding rates stack shorts for a squeeze, and structural higher lows prove demand dominance. November’s catalyst stack (Pectra + post-election clarity) meets a technically washed-out market. The +40% move isn’t hope, it’s probability.

Technical analysis for ETH nov 2025There is a historic fair value gap between 3700 and 4300 which the recent drop from 4300 is moving inside. We see four well defined bases and rallies starting from the historically established 3700 level, Looking to the williams vix fix we see moderately strong buying at the 3700 level.
The expectation would be that we see an immediate rally back to the rally neckline at 3900 but it's also reasonable to see a lot of ranging between the current price (3800) and the 100hr moving average. This is because the market must establish more confidence in the rally neckline before moving higher. Once a base at 4000 is established we'll see a medium term-fair value gap fill back to 4300.

+40% CANDLE IN NOVEMBER FOR ETH!!!This is going to be the first of my two-part thesis on why I believe ETH is set up for a +40% rally in November. First, the fundamentals:
**FED RATE CUT TRAP:** It might be hard to notice we are in a rate cut cycle, as crypto prices seem to have ignored the core thesis that money is getting cheaper and assets should be worth more. Well, this isn’t the first time we’ve gone in the opposite direction in the middle of a rate cut cycle. Back in September 2024, the Fed cut rates by 50 bps, and the crypto market had a meh reaction to it. Another 25 bps cut was expected in early November and wasn’t priced in during October. ETH gained and lost roughly 3% in both months. Basically, my point is that the correlation between rates and crypto isn’t uncommon, but it’s usually an anomaly that never lasts. Some call it manipulation; I call it MARKET FORCES.
**WALL STREET IS BUILDING ON THE ETHEREUM NETWORK:** Ethereum has the largest share of tokenized assets. This only means there is strong demand for ETH beyond speculation. I believe dips should have been more painful if Wall Street wasn’t scooping up excess supply.
**ETH Pectra UPGRADE (formerly "Fukasa"):** Scheduled for early November 2025, Pectra combines Prague (execution) and Electra (consensus) upgrades which results in lower issuance, higher staking, and stronger institutional tooling.
Why +40% in November?
Timing Catalyst: The upgrade activates right after the U.S. election dust settles (Nov 5), giving the market a clean macro window to front-run the narrative.
Supply Shock: Pectra’s staking reforms are expected to push staking participation from ~28% to 35%+ within 60 days (per Lido/Figment forecasts), pulling ~2.5M ETH off exchanges. Combined with blob fee burns, issuance drops to its lowest post-Merge level.
The rate-cut “trap” was just the market mispricing cheaper capital; Pectra is the technical trigger that turns latent institutional balance sheets into aggressive ETH bids. November is when the flywheel spins.

BULLISH MOMENTUM AIMING FOR KEY RESISTANCR BREAKOUTTechnical Analysis:
Market Structure:
Ethereum has shown a clear change of character (CHoCH) around the $4,080 level, confirming a bullish shift in structure after consolidating for several sessions between $3,900 and $4,100.
Trend:
The pair is now in a strong ascending channel, with a clear parabolic curve supporting the recent rally. Price action has been consistently forming higher lows, indicating healthy momentum from buyers.
Support Zone:
Primary Support: $3,700 – $3,750
Intermediate Support: $4,050 – $4,080
These areas are key for potential pullbacks before further continuation upward.
Resistance Zone:
The main resistance lies at $4,280 – $4,330, marked by previous structural highs and supply zone rejection.
A clean break and retest above $4,330 could open the path toward $4,450 – $4,500.
Momentum & Volume:
The bullish impulse leg highlighted in blue shows strong momentum with minimal retracement, suggesting institutional participation or aggressive buying pressure.
Projection:
Short-term expectation is a minor pullback around $4,200 – $4,150, followed by another push upward toward the resistance zone ($4,300 – $4,350).

ETHUSD Neutral bias remains intact above 3,723The ETHUSD remains in a neutral trend, with recent price action indicating a corrective pullback within the broader trading range.
Support Zone: 3,723 – a key level from previous consolidation. Price is currently testing or approaching this level.
A bullish rebound from 3,723 would confirm ongoing upside momentum, with potential targets at:
4,020 – initial resistance
4,118 – psychological and structural level
4,210 – extended resistance on the longer-term chart
Bearish Scenario:
A confirmed break and daily close below 3,723 would weaken the bullish outlook and suggest deeper downside risk toward:
3,620 – minor support
3,520 – stronger support and potential demand zone
Outlook:
Neutral bias remains intact while the ETHUSD holds above 3,723. A sustained break below this level could shift momentum to the downside in the short term.
This communication is for informational purposes only and should not be viewed as any form of recommendation as to a particular course of action or as investment advice. It is not intended as an offer or solicitation for the purchase or sale of any financial instrument or as an official confirmation of any transaction. Opinions, estimates and assumptions expressed herein are made as of the date of this communication and are subject to change without notice. This communication has been prepared based upon information, including market prices, data and other information, believed to be reliable; however, Trade Nation does not warrant its completeness or accuracy. All market prices and market data contained in or attached to this communication are indicative and subject to change without notice.

Triangle on ETHTrading in uncertain conditions, like when a triangle pattern appears on the charts, can be tricky. Such patterns often indicate consolidation, where price movement isn't clearly bullish or bearish.
Would you wait for a clear breakout from the pattern before taking a position ?

ETH >>>>>>> ShortIn the 12-month cyclical pattern of Ethereum, I foresee a downward trend developing during 2026 and 2027.
Based on the recurring structure of Ethereum’s price movements and its historical cycle behavior, I’ve identified three potential levels (or “steps”) of decline that could act as key support zones during this corrective phase.
These three steps represent possible stages where:
The first pullback may begin .. a short-term correction or initial cooldown.
The second step could serve as a consolidation or mid-cycle stabilization area.
The third step may form the major cycle bottom, where market accumulation begins and prepares for the next upward phase.
Overall, this outlook is derived from Ethereum’s repeating annual patterns, historical cycle analysis, and its correlation with broader crypto-market dynamics.
Therefore, I expect a corrective and accumulation phase throughout 2026–2027, potentially setting the stage for Ethereum’s next major rally once the cycle resets.

ETH Outlook after the Dip. What to expect NOW?Finally, the price broke the wedge, and the price experienced a significant drop. I think now is the time for ETH to rise again to 1900 . STRONG SUPPORT 1400 .
Give me some energy !!
✨We spend hours finding potential opportunities and writing useful ideas, we would be happy if you support us.
Best regards CobraVanguard.💚
_ _ _ _ __ _ _ _ _ _ _ _ _ _ _ _ _ _ _ _ _ _ _ _ _ _ _ _ _ _ _ _
✅Thank you, and for more ideas, hit ❤️Like❤️ and 🌟Follow🌟!
⚠️Things can change...
The markets are always changing and even with all these signals, the market changes tend to be strong and fast!!

Ethereum 3rd Cycle Inevitable ⚡️
Same structure.
Same rhythm.
Different cycles
Same silence before the storm.
Every CRYPTOCAP:ETH cycle begins the same way, accumulation, disbelief, and then an unstoppable breakout.
The 3rd cycle isn’t a question of if, it’s a matter of when.

ETH/USD | 1H Long SetupModels: ICT • SMC • Bill Williams
ETH swept liquidity beneath the SMT divergence low, tapping discount pricing and reacting strongly from a demand zone. Market structure shifted after the sweep, signaling accumulation and potential upside expansion.
The Alligator indicator shows the lips crossing upward — signaling the transition from compression to trend development, aligning with the bullish narrative.
✅ Trade Logic
ICT / SMC Confluence:
Sell-side liquidity taken below SMT divergence level
Bullish displacement breaking short-term structure
Return to mitigation block + FVG for entry
Price now operating above reclaimed structure
Bill Williams Confirmation:
Alligator waking up: green > red > blue
Early phase of new bullish wave
📊 Setup
Value
Entry 3,849
Stop Loss 3,676
Targets TP: 4,234 (buy-side liquidity pool)
RR ~4:1
🎯 Outlook
ETH is positioned for continuation if price sustains above reclaimed structure. Expecting continuation into premium levels and liquidity above 4.2K.
Smart Money Accumulation → Expansion Cycle underway

Ethereum confirmation of breakout, downside targetEthereum confirmed a breakout below the 4050–4100 zone, completing the double top pattern. The price stays under the 50 and 100 EMA, showing continued bearish pressure. Priority remains on short positions during pullbacks.
Nearest downside targets: 3463 (Target 1) and 3007 (Target 2). A move above 4100 would cancel the bearish scenario.
Amid expectations of the Fed’s rate decision and rising bond yields, risk assets remain under pressure. Inflows to crypto funds are declining, increasing the downside risks for ETH. In the short term, correction may continue until new bullish catalysts appear.
ETHUSD remains in a bearish setup. Downside targets — 3460 and 3000. Long positions should be considered only after a confirmed move above 4100.

The Pillars of Global Trade Dynamics1. The Economic Foundation: Supply, Demand, and Comparative Advantage
At the heart of global trade lies the principle of comparative advantage, introduced by David Ricardo in the early 19th century. This concept explains why nations trade — even when one nation can produce everything more efficiently than another. Instead of self-sufficiency, countries specialize in producing goods where they have a lower opportunity cost, leading to mutual benefit through exchange.
For example, if India focuses on software services and textiles while importing advanced machinery from Germany, both countries benefit from efficiency and specialization. This principle underpins global trade structures and ensures that resources — from labor to capital — are utilized optimally.
Global supply and demand dynamics also play a critical role. When consumer preferences shift or production costs change, global trade adjusts rapidly. The pandemic, for instance, disrupted both supply chains and demand patterns, forcing the world to reconsider its dependence on certain countries and industries. Similarly, rising middle-class consumption in Asia has altered global demand, turning countries like India, China, and Indonesia into consumption powerhouses.
Economic interdependence has deepened as well. A smartphone assembled in China, using components from South Korea, software from the United States, and raw materials from Africa, showcases how global production networks interlink economies. This interdependence creates efficiencies but also vulnerabilities, as seen during trade disruptions, geopolitical tensions, or shipping crises.
2. Policy and Governance: The Regulatory Pillars of Trade
Trade doesn’t occur in a vacuum; it is guided and regulated by policies, agreements, and global institutions. The World Trade Organization (WTO), International Monetary Fund (IMF), and World Bank form the triad of international governance that promotes free and fair trade.
These institutions were established after World War II to prevent the economic nationalism that contributed to the Great Depression and global conflict. The WTO, for instance, provides a platform to settle disputes and negotiate trade liberalization, ensuring countries abide by agreed-upon rules.
However, in the 21st century, trade policy has become a strategic weapon. Tariffs, sanctions, and subsidies are now tools of economic diplomacy. Trade wars, such as the U.S.–China conflict, illustrate how policy decisions ripple across the global economy — raising costs, shifting supply chains, and altering investment flows.
Moreover, regional trade agreements (RTAs) such as the European Union (EU), North American Free Trade Agreement (now USMCA), and the Regional Comprehensive Economic Partnership (RCEP) have reshaped trade patterns. These blocs promote intra-regional cooperation and reduce barriers, allowing countries to integrate economically and enhance competitiveness.
In contrast, protectionist policies — often driven by domestic political pressures — can distort markets and fragment global trade. The balance between globalization and protectionism remains one of the defining policy challenges of our era.
3. Technological Advancement: The Catalyst of Modern Trade
Technology has revolutionized every facet of global trade — from production and logistics to finance and communication. The digital revolution, automation, and artificial intelligence (AI) have made trade faster, more efficient, and more data-driven.
In logistics, innovations like real-time tracking, blockchain-based shipping records, and automated ports have streamlined global supply chains. The containerization revolution in the mid-20th century was one of the earliest technological breakthroughs that drastically cut transport costs and boosted trade volumes.
In manufacturing, technologies such as robotics, 3D printing, and Internet of Things (IoT) are reshaping the global distribution of production. Countries with advanced infrastructure and technological expertise now dominate high-value segments of the global value chain, while developing economies specialize in labor-intensive manufacturing.
Furthermore, the digital economy has expanded trade beyond physical goods. Digital services — from cloud computing and fintech to online education — are now significant components of international commerce. A freelancer in the Philippines, a software firm in India, and a design studio in the U.S. can collaborate seamlessly in real time, thanks to digital trade platforms.
However, this technological leap also brings challenges. Automation threatens traditional manufacturing jobs in developing nations, while data localization laws and digital protectionism create new trade barriers. As the world moves toward digital globalization, ensuring inclusive access and digital equity becomes a new trade priority.
4. Financial and Monetary Systems: The Flow of Global Capital
Trade cannot function without finance. The global financial system — encompassing currency exchange, cross-border payments, and investment flows — acts as the bloodstream of trade. The U.S. dollar, long the dominant reserve currency, facilitates most international transactions, while central banks and financial institutions provide the credit and liquidity necessary for trade expansion.
Trade finance — letters of credit, guarantees, and export financing — ensures that exporters get paid and importers receive goods. The stability of global finance directly impacts trade volumes. For instance, during the 2008 global financial crisis, liquidity dried up, leading to a sharp contraction in global trade.
Exchange rate fluctuations also affect trade competitiveness. A weaker currency makes exports cheaper and imports costlier, influencing trade balances. Hence, countries often intervene in foreign exchange markets to maintain favorable trade positions — a practice sometimes criticized as “currency manipulation.”
Additionally, capital mobility — the ability of investors to move funds across borders — has made financial markets more intertwined with trade. Foreign direct investment (FDI) fuels industrial growth, infrastructure, and technology transfer, while portfolio investments reflect global confidence in economies.
As digital currencies and blockchain-based payment systems evolve, the future of global trade finance may shift toward decentralization. Central Bank Digital Currencies (CBDCs) could make international payments faster and cheaper, redefining the global monetary order.
5. Infrastructure and Logistics: The Physical Backbone of Trade
Trade relies heavily on physical connectivity — ports, roads, railways, and airports form the arteries of global commerce. Efficient infrastructure determines how fast and cost-effectively goods move from producers to consumers.
Maritime transport carries around 80–90% of world trade by volume. Hence, modern ports like Shanghai, Singapore, and Rotterdam serve as critical global trade hubs. The expansion of the Panama and Suez Canals, along with new infrastructure projects like China’s Belt and Road Initiative (BRI), reflects the growing emphasis on connectivity.
Poor infrastructure, on the other hand, remains a major bottleneck in developing countries. Delays, congestion, and high logistics costs reduce competitiveness and deter investment. Therefore, trade infrastructure investment is not just an economic necessity — it’s a strategic imperative for sustainable development.
The logistics revolution has also introduced new efficiencies. Just-in-time (JIT) inventory systems, global freight management software, and last-mile delivery innovations have minimized waste and improved responsiveness. Yet, as the pandemic revealed, these lean systems can also be fragile when global shocks occur.
6. Geopolitical and Social Factors: The Human Dimension of Trade
Global trade is deeply intertwined with geopolitics. Trade routes, resource control, and economic influence are often used as instruments of national power. Countries form alliances or impose sanctions based on strategic interests, shaping the flow of trade and investment.
The rise of geoeconomics — where economic tools are used for geopolitical aims — marks a major shift. Energy trade, for instance, has been a central element in international relations, with oil-producing nations wielding significant influence. Similarly, rare earth minerals — vital for electronics and renewable technologies — have become a new front in global trade rivalries.
Social factors are equally important. Labor standards, human rights, and environmental sustainability now shape consumer choices and corporate strategies. The ESG (Environmental, Social, and Governance) movement has pushed multinational corporations to adopt responsible sourcing and ethical production practices.
Moreover, trade influences societies by transforming employment patterns, income distribution, and cultural exchange. While globalization has lifted millions out of poverty, it has also widened inequalities in some regions. Thus, social equity and inclusivity have become essential considerations in modern trade policy.
7. Sustainability and the Green Trade Transition
The future of global trade depends on its ability to align with sustainability. As climate change intensifies, nations and businesses are rethinking supply chains, energy sources, and production methods. The concept of “green trade” emphasizes reducing carbon footprints, promoting renewable energy, and developing circular economies.
Green policies — such as the European Union’s Carbon Border Adjustment Mechanism (CBAM) — are reshaping trade norms. Exporters to such markets now face carbon pricing, pushing industries to adopt cleaner technologies. Similarly, green finance and ESG-focused investments are channeling capital toward sustainable trade infrastructure.
Sustainability is no longer an optional pillar but a central force defining competitiveness and resilience in global trade.
Conclusion: Interconnected Pillars for a Shared Future
The pillars of global trade dynamics — economic principles, policy frameworks, technology, finance, infrastructure, geopolitics, and sustainability — together uphold the vast structure of global commerce. Each pillar is interdependent, reinforcing and influencing the others.
The coming decades will witness a reconfiguration of trade networks — driven by technological innovation, climate imperatives, and shifting geopolitical alignments. The challenge lies in ensuring that trade remains inclusive, sustainable, and equitable — balancing efficiency with resilience, and growth with environmental stewardship.
Ultimately, global trade is more than an economic process; it is a reflection of human collaboration and interdependence. As nations navigate the complexities of the 21st century, strengthening these foundational pillars will determine not just the direction of commerce, but the shared prosperity of the global community.
Bullish reversal off major support?The Ethereum (ETH/USD) is reacting off the pivot and could bounce to the 1st resistance.
Pivot: 3,710/52
1st Support: 3,395.28
1st Resistance: 4,063.46
Disclaimer:
The above opinions given constitute general market commentary, and do not constitute the opinion or advice of IC Markets or any form of personal or investment advice.
Any opinions, news, research, analyses, prices, other information, or links to third-party sites contained on this website are provided on an "as-is" basis, are intended only to be informative, is not an advice nor a recommendation, nor research, or a record of our trading prices, or an offer of, or solicitation for a transaction in any financial instrument and thus should not be treated as such. The information provided does not involve any specific investment objectives, financial situation and needs of any specific person who may receive it. Please be aware, that past performance is not a reliable indicator of future performance and/or results. Past Performance or Forward-looking scenarios based upon the reasonable beliefs of the third-party provider are not a guarantee of future performance. Actual results may differ materially from those anticipated in forward-looking or past performance statements. IC Markets makes no representation or warranty and assumes no liability as to the accuracy or completeness of the information provided, nor any loss arising from any investment based on a recommendation, forecast or any information supplied by any third-party.

ETH ShortMirroring my BTC analysis I see support clearly broken with consolidation below support showing its getting ready for the next leg down. Short ETH with little risk right now. Smart money is selling

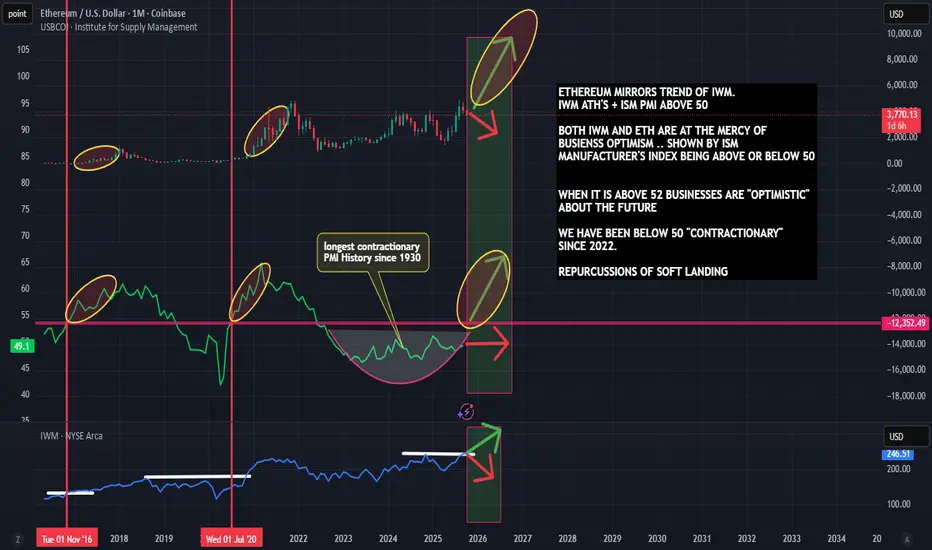
Ethereum Moves with The Business Cycle and Small Cap StocksThere's still hope for Ethereum and Altcoins into 2026
Why Altcoins Never Caught the Bull: The Missing Piece in the Crypto Cycle
Bitcoin, gold, and the S&P 500 (SPY) have long proven their close relationship with M2 money supply — when liquidity expands, they rise.
But Ethereum and the broader altcoin market play by a slightly different rulebook. They don’t just need liquidity… they need optimism.
Specifically, expanding small-cap stocks and a strong business sentiment environment.
Higher-risk assets — from growth stocks to altcoins — thrive when the economy believes in itself. And throughout this entire crypto cycle, that optimism never fully materialized.
Despite strong narratives, legal wins, and technological progress, altcoin expansions never sustained. Why? Because the business cycle is the true king of risk-taking.
🧭 Where to Watch: IWM & PMI
Two of the best gauges for this optimism are:
IWM (Russell 2000) – tracks small-cap stocks and risk appetite
ISM PMI – measures manufacturing activity and future order expectations
When the PMI is above 52, the economy is in expansion mode — and that’s historically when IWM hits new highs.
Interestingly, Ethereum has mirrored IWM’s trend, even showing outperformance when IWM pushes into all-time highs. That means ETH’s bullish potential could be closely tied to the next leg of small-cap and business expansion.
💡 The Takeaway
In the past, money supply (M2) and business optimism rose together.
Now, they’ve decoupled — giving us a clearer way to separate which catalyst drives which asset.
So, the big question:
👉 If business sentiment improves in 2026… does Ethereum finally get its real bull run?
Only time — and the next PMI reading — will tell.
Bullish? Maybe This Will Change Your Mind About ETHHi guys,
This monthly inverse chart should make things clear to you that the market is about to crash hard!
Everyone is so bullish and Microstrategy just announced another BTC purchase which is a huge RED ALERT for all crypto investors.
Stay safe and let me know what do you guys think about this !

ETHCRYPTOCAP:ETH remains within a descending channel pattern and is approaching the $3500 support level, likely for the final time in this cycle. Market structure suggests this could be the last shakeout before a major reversal. A breakout could accelerate toward $5000 sooner than expected.

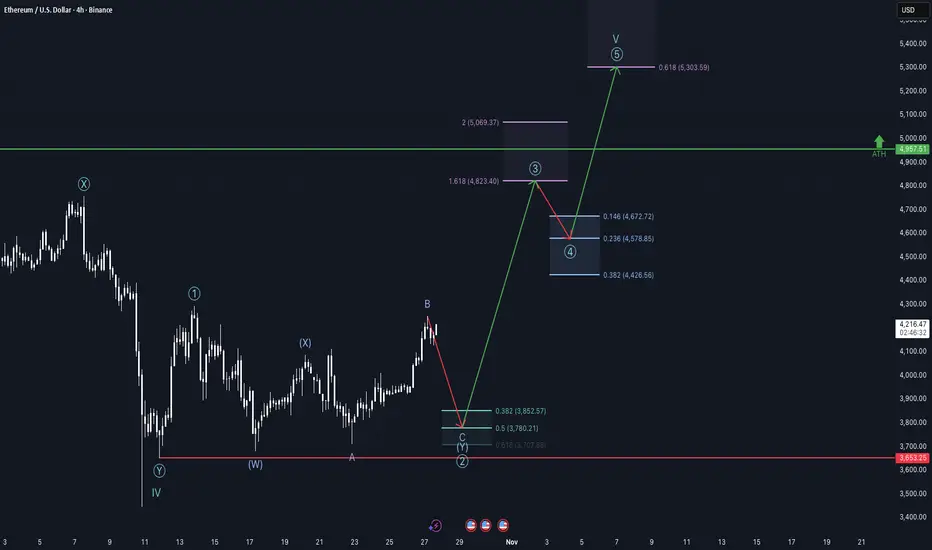
Front run or discount prices - ETH weekly update Oct 27 - 02ndDear traders and investors,
I firstly want to mention that everyone who took that last weeks trade, it is now time to close it or, if you want to take on more risk, you can hold through the next descending phase where you could get stopped out. But lets get into the analysis.
As I mentioned in todays Bitcoin analysis, the macro environment is currently bullish. We have a rate cut coming in on Wednesday with a high probability and lower than expected CPI on last Friday, leading to Powell being rather dovish than hawkish but still cautious. Trump is also signaling a tariff deal with China may be coming in soon. I do think this also has to do with his ambitions to lower the rates and tariffs may impact the inflation so he avoids more uncertainty.
Looking at the money flows, ETFs are receiving and inflows are looking like they are topping out right now. I think this is a typical behavior for a fifth wave, as institutionals are backing of from the market and using the late retailers as exit liquidity.
Moving on to market structure, it seems to be likely that this pump on Sunday was rather a overshooting wave B, than a actual impulsive move of the third wave. There is just to much lethargic in this move. In addition to that, funding rates rose to higher-than-normal highs and there is a bunch of liquidity forming under the current price. Therefore, the odds for longs getting liquidated rise. Alternatively, this is actually the third wave. If so, Ethereum should pump further without hesitation within the next few candles.
All in all, I would favor a short postion with stop loss at the high of the minor wave B or one percent above and the take profit at the 0.5 fibonacci extension level. This scenario is also in favored by Bitcoin, as I also anticipate a short-term drop. nonetheless be careful with short positions, we are in a bull market, the upside is overall in favor and shorts being liquidated is really easy right now. For people who look for a opportunity to buy in, the extension levels are all a good trade with stop loss at the low of the primary wave Y and take profit at the anticipated third wave or fifth wave high.
I hope i was able to give some value, have an exceptional successful week!
ETHUSD bullish fractalEhereum is repeat bullish patterns that did in previous cycles.
-ETH exited the consolidation triangle that started from nov 21, and now is retesting the structure, meaning a bullish continuation is likely to happen.
-In adition, there is an inverted head and shoulders that is taking shape.
I am watching closely this formation of this triangle for any bullish confirmation:

ETH/USD – Bulls Ready for the Next Leg Up?Ethereum is showing a clean retrace into the rising trendline and POC/ VWAP zone — classic setup for a continuation move.
As long as price holds above $3,950, bulls remain in control with targets at $4,733 and beyond.
Momentum is cooling but structure stays bullish. Is this just the calm before the next breakout? 👀
💬 What’s your plan here — riding the trend or waiting for confirmation?

Final Push into the 24MA weekly This could be the final Push into the 24MA before we slingshot higher. Time will tell first target should be 6500ish

EthereumETHUSD
- Bearish Channel as an corrective pattern in Short Time Frame
- Sell Side Liquidity
- Change of Characteristics
- Completed " 1234 " Impulsive Waves
- Order Block
